APPENDIX B
SUPPLEMENTARY OBSERVATIONS RELEVANT TO THE SECULAR COMMODITY BULL MARKET
In Chapter 4 we pointed out how inflation can slowly but surely eat away at portfolio values over the years and that the most likely outcome is for an extension of the secular bull market for industrial commodity prices for the balance of the current decade. In this section we examine two aspects of the inflation/deflation battle, the inflationary aspects of the recent unprecedented expansion in the monetary base and the deflationary consequences of the debt overhang and continued accumulation of obligations. First let’s examine the issue of the rapid expansion in the monetary base.
Expansion of the Monetary Base—Is the Gas Already on the Fire?
The monetary base is the raw material for creating money. It comprises currency in circulation, member bank reserves held at the Fed, and vault cash. We all know that when the supply of money expands relative to the amount of goods in the system, price inflation results. The degree of the inflation will depend on changes in the velocity of circulation. When banks create loans, this has the effect of increasing the money supply. They are limited in their ability to do this by the fact that there is also a requirement for them to hold a certain proportion of those loans in the form of reserves. These reserves also form part of the monetary base.
In September 2008 the Fed engineered a 180-degree turn as it reversed its policy from fighting inflation to one of promoting it. The objective was to stem the tide of deflation, and the vehicle was an expansion in the monetary base, which it controls by purchasing and selling assets on the open market. Purchasing assets held by the banks puts cash into the system, which is inflationary, and selling them drains it, which is deflationary. This was no ordinary change of heart because the scope of the operation was unprecedented. Economist Arthur Laffer in a June 11, 2009, Wall Street Journal article titled “Get Ready for Inflation and Higher Interest Rates,” noted, “The percentage increase in the monetary base is the largest increase in the past 50 years by a factor of 10.” He went on to point out that the bank reserve component of the base, which is where the system gets its leverage, had increased twentyfold. At that time the bank reserves comprised 50 percent of the base. This was significant since reserves—as opposed to currency in circulation, which is the other major base ingredient—are the foundation of loan creation and therefore money supply growth. Laffer went on to explain the consequences of these developments, “It’s difficult to estimate the magnitude of the inflationary and interest-rate consequences of the Fed’s actions because, frankly, we haven’t ever seen anything like this in the U.S. To date what’s happened is potentially far more inflationary than were the monetary policies of the 1970s, when the prime interest rate peaked at 21.5% and inflation peaked in the low double digits. Gold prices went from $35 per ounce to $850 per ounce, and the dollar collapsed on the foreign exchanges. It wasn’t a pretty picture.”
That was in 2009, and as you can see in Chart B-1 the base, after consolidating, resumed its upward path.

CHART B-1 Monetary Base, 1987–2011
Thus we have the gasoline and we have the fire, but we do not yet have the match to set it alight because banks at the beginning of 2012 had not expanded their loan portfolios to any great degree. If they had, it would be imperative for the Fed to reduce the base, either by selling Treasuries on the open market or by raising the reserve requirements on banks. (Banks are required to keep a certain amount of their assets in the form of reserves against the loans they create. Raising the requirement gives them less leeway to make loans.)
Selling Treasuries would put a significant amount of supply on the market and push up interest rates. Raising reserve requirements would put a lid on bank lending, and that too would have the effect of elevating rates. We are assuming here that the demand for credit would not immediately abate. Historically the Fed has been reluctant to raise rates as quickly as it should. After all, who wants to risk a recession, because a recession would take place if the Fed was to be too aggressive as was the case in 2000–2001 when it actually reined in the base.
Given the lopsided U.S. government debt structure, it could well be that such a policy would run the risk of tipping the inflation/deflation balance toward excessive deflation. This would undoubtedly extend the equity secular bear. We think it’s important to remember that deflation can result in a sudden loss of confidence and the by-product of that is a sharp decline in equities. Just ask traders in the late 1870s and early 1930s about this. It was no coincidence that the unexpected 2008 stock market rout was caused by deflationary forces. By way of a footnote, an expansion in the monetary base has not been limited to the United States as it also expanded in Europe, Japan, China, and the United Kingdom in the 2002–2011 period. This is shown in Chart B-2, where it can be seen that the expansion in central bank balance sheets has been a global “team” effort.
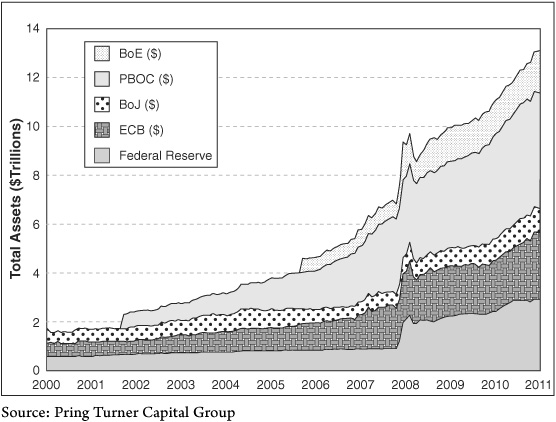
CHART B-2 Total Assets of Major Central Banks, 2000–2011
The U.S. Federal Reserve has received considerable criticism concerning its excessive creation of liquidity. This chart shows that it’s been a “team” effort as the European Central Bank, Bank of Japan, People’s Bank of China, and the Bank of England have all joined in.
Chart B-3 examines the idea that commodity prices are influenced not just by changes in the money supply but also by those changes when adjusted by monetary velocity. In other words, while it is important to note the huge increase in liquidity that took place in the opening decade of the century, we also need to be aware of how it is being used. If, for example, the money supply expands but people park a lot of it in a bank account or under the bed, this results in far less stimulation than if it were used to purchase goods and services. As long as that is the case, increases in the money supply are benign, just like a can of gas placed near an unlit fire. On the other hand, if people start to use that money so it circulates around at a fast pace, its influence on levels of economic activity and later on prices is much more powerful. It’s the same effect as scattering the can of gas over logs and using a match to set it alight. In a crude way, the oscillator in the bottom panel of the chart attempts to gauge the relationship between changes in the money supply and its velocity (GDP/M2). The shaded areas roughly correspond to the declines in this momentum series, and you can see these periods line up very well with commodity bear markets, though the 2004–2005 experience shows this is not a perfect match. Neither would we expect it to be since commodity prices are determined by global forces, not just U.S. ones.

CHART B-3 CRB Spot Raw Industrials Versus the Momentum of Money Supply Adjusted by Velocity
The lower panel contains an 18-month rate of change (ROC) of M2 adjusted for fluctuations in the velocity of circulation. The shaded areas flag when the oscillator is in a declining trend and when commodity prices usually decline. The 2004–2005 period was an exception to this rule.
The Debt Overhang—Will It Result in Inflation or Deflation?
One significant factor hanging over the United States is excessive levels of public debt, which also has a bearing on whether the secular bear market in equities is likely to extend. In their book This Time Is Different (Princeton University Press, 2011), Kenneth Rogoff and Carmen Reinhart researched a data set of public debt covering 44 countries for up to 200 years. They concluded that a debt overhang becomes a problem for economic growth when public debt reaches 90 percent of the GDP. The United States, in 2009, was perilously close to this number (see Chart B-4). The 90 percent level is not a make-or-break number but an approximate one. For example, off-balance-sheet guarantees and creative accounting often make it difficult to assess a country’s true debt level until a crisis brings everything out in the open.
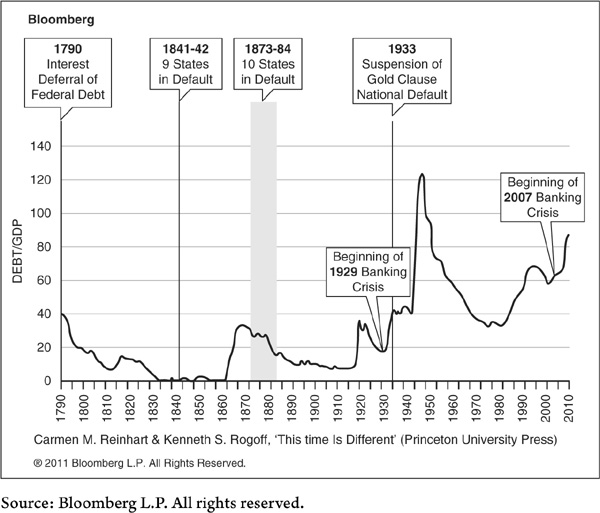
CHART B-4 U.S. Debt as a Percentage of the GDP, 1790–2009
As an example, the debt of mortgage lenders Fannie Mae and Freddie Mac was never officially guaranteed until the 2008 crisis. In the early part of the twenty-first century, any discussion of public liabilities in developed countries should also take into account the demographic challenges from a progressively aging population relative to workers. Their 90 percent threshold was largely based on periods prior to the escalation of pensions and healthcare, which suggests that these factors will act as an additional inhibitor of growth.
There are really only three ways to get out of a debt problem: inflate, default, or pay the debt down to a more comfortable level. A fourth possibility, growing out of the problem, becomes progressively more problematic the higher the ratio. All three of the other solutions are long-term negatives for equities. First, the amount of inflation required to do the job would have to be substantial. We have already seen how excessive inflation can be bearish for equities. Second, default would result in a loss of confidence, probably setting off a downward deflationary spiral. This would also likely extend the secular bear and lower price/earnings ratios. So too would the third alternative, paying off the debt and cutting expenditures. That would be the preferred solution, but the short-term economic pain it would cause would also result in an extension to the secular bear. The good news is that such a policy could ultimately restore confidence thereby possibly truncating its length by a few years. Political haggling will likely answer this issue in the next few months and set the course for the length of the second lost decade.