Try not to become a man of success, but rather try to become a man of value- A. Einstein
What do you want to write on your next resume? JBoss developer? Dare to write JBoss specialist! In today's highly competitive workplace, you need outstanding skills. Being a developer is only part of your duty. What makes you different from the queue of competitors is the ability to solve critical situations. Mastering JBoss services requires time and devotion. You don't have the coolest widgets in the market; most of the time you have to edit the configuration files, either manually or by using a raw web interface. However, in this chapter we'll try to make your journey through JBoss services as pleasant as can be. This chapter discusses the following topics:
- An introduction to JBoss AS monitoring services
- All about JBoss thread pool
- How to configure logging services
- Configuring connections to the database
- Configuring the transaction service
JBoss has several options for monitoring your services, spanning from web interfaces to command-line tools. Most developers are familiar with the JMX console web application. It provides a raw view of the microkernel of the JBoss Application Server by listing all active registered services (MBeans).
Another available option is the Web console. This is quite similar to the JMX console, except that it contains an interactive applet that can be used to capture system metrics.
The Web console is not covered in this book as it has not been upgraded since a long time and so de facto is going to be deprecated. Rather, we would like to encourage the reader to learn about the newer web-based admin console that is an offshoot of the Jopr project. This project aims at producing administrative, monitoring, alerting, and operational control on JBoss AS and related projects. Since release 5.1.0 of the application server, the admin console is bundled as a web application in the deploy folder of JBoss AS.
The last monitoring option that we will discuss is the twiddle command execution tool that provides access to registered services using a command line.
The JMX console is the most widely used tool for inspecting JBoss MBeans components. It requires nothing but a standard web browser. The default URL for the console is http://localhost:8080/jmx-console/.
Tip
What are MBeans?
MBeans are single, manageable components that are plugged into JBoss by registering on a central server (MBean server). MBeans were the foundation of JBoss Kernel in pre 5.0 releases.
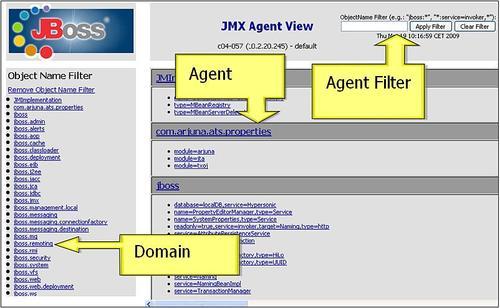
The console is divided into two frames—the left frame contains the list of domains of the JBoss Server, while the right frame is called the agent view and exhibits the list of all MBeans that are registered for the selected domain (at start up it just contains all MBeans registered grouped for every domain). In the top-right corner, you can filter on domains and agents.
Note
By domain, we just mean a logical group of components (MBeans) that are related to a certain service. So, we have a domain jboss.system that handles the system parameters such as jboss.jdbc, which is about datasource configuration, and so on.
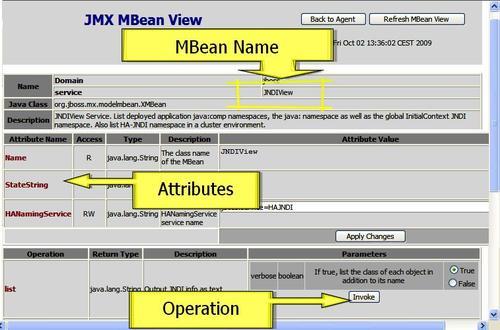
When you select one of the MBeans, you will be taken to the JMX MBean View. In this panel, you can view and edit the MBean's attributes, as well as invoke operations on it.
Tip
Security warning
The JMX console doesn't require any authentication to log on. This might expose your system to severe vulnerability. Check out how to secure the JMX console in Chapter 13, JBoss AS Security Architecture.
Here is a typical scenario where the JMX console is really required. Somehow it happened that you failed to retrieve one object from the JNDI tree. Chances are that the object was registered in the wrong namespace; however, don't panic, the first aid is a JNDI tree dump.
Navigate to the jboss domain and in the next view select service=JNDIView MBean. Follow the link and you'll be taken to the MBean view. Once there, scroll down to the list operation.
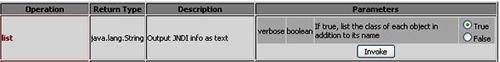
By clicking Invoke, you should be able to see a page dump of your JNDI tree:
java: Namespace
+- securityManagement (class: org.jboss.security.integration.JNDIBasedSecurityManagement)
+- comp (class: javax.namingMain.Context)
+- XAConnectionFactory (class: org.jboss.jms.client.JBossConnectionFactory)
+- TaskListEar (class: org.jnp.interfaces.NamingContext)
| +- TaskListSessionBean (class: org.jnp.interfaces.NamingContext)
| | +- remote (class: Proxy for: sample.ejb.manager.TaskListSession)
| | +- remote-sample.ejb.manager.TaskListSession (class: Proxy for: sample.ejb.manager.TaskListSession)
Global JNDI Namespace
+- UserTransactionSessionFactory (proxy: $Proxy150 implements interface org.jboss.tm.usertx.interfaces. UserTransactionSessionFactory)
+- UUIDKeyGeneratorFactory (class: org.jboss.ejb.plugins.keygenerator.uuid.UUIDKeyGeneratorFactory)
+- HiLoKeyGeneratorFactory (class: org.jboss.ejb.plugins.keygenerator.hilo.HiLoKeyGeneratorFactory)
+- XAConnectionFactory (class: org.jboss.jms.client.JBossConnectionFactory)
+- topic (class: org.jnp.interfaces.NamingContext)
+- ClusteredConnectionFactory (class: org.jboss.jms.client.JBossConnectionFactory)
+- ProfileService (class: AOPProxy$0)
The JNDI tree is divided into several sections, each one gathering information for a specific namespace. If you cannot look up an object from the JNDI tree, it is likely that it is an issue with namespaces. For example, if you look at the JNDI tree, you can see a component TaskListSessionBean registered in the java: JNDI namespace. Registering a component in the java: namespace is perfectly valid; however, bear in mind that the component will not be accessible outside the JBoss server JVM. If your objects need to be looked up from remote clients too, then you should rather register them in the global namespace.
The newer admin console ships with JBoss AS, since the release of 5.1.0. If you are running an earlier version of JBoss AS, then you should check and install a compatible release of the the Embedded Jopr project. The downloads available are listed at http://www.jboss.org/community/wiki/EmbeddedJoprDownloads.
If your JBoss AS is bound at localhost, then you can access the admin console at the following URL: http://localhost:8080/admin-console. You can log in with the default administrator credentials: admin/admin.
Note
These credentials come from the jmx-console security domain, which by default is configured through JBOSS_HOME/server/xxx/conf/props/jmx-console-users.properties. Security domains are discussed in detail later in Chapter 13., JBoss AS Security Architecture
The web application is basically divided into two frames—the left frame provides the navigation between the resources available on the application server, while the central frame is your Control Panel where you can manage the single resource.
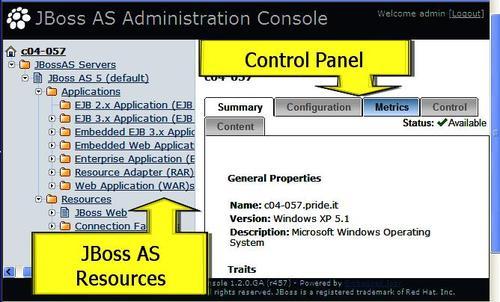
The Control Panel is composed of the following options:
- Summary: This option summarizes the general properties of the resource (for example, JNDI name) along with the most relevant metrics.
- Configuration: This option allows editing or creation of new resources. For example, it can be used to add a new service without the need to edit the configuration file.
- Metrics: As the name implies, this option displays the available metrics collected for the resource.
- Control: If this option is enabled, you can use some special actions that are related to the resource. For example, in a connection pool, you might want to flush the connections from the pool.
We will see some of these options in more detail as we approach the configuration of AS resources.
JBoss provides a simple command-line tool called twiddle (for twiddling bits using JMX) that allows interaction with a local or remote JMX server instance. This tool is located in the bin directory of the distribution. It can be executed using either twiddle.sh (Unix/Linux) or twiddle (Windows). Passing a -h (--help) argument provides the basic syntax, and the --help command shows what you can do with the tool.
This is the basic syntax of twiddle:
$ ./twiddle.sh -h
A JMX client to 'twiddle' with a remote JBoss server.
usage: twiddle.sh [options] <command> [command_arguments]
The list of available commands that can be passed to twiddle is presented in the following table:
|
Command |
Description |
|---|---|
|
|
Print out JSR77 related information |
|
|
Print out MBean metadata as an XMBean descriptor |
|
|
Get the metadata for an MBean |
|
|
Get the values of one or more MBean attributes |
|
|
Invoke an operation on an MBean |
|
|
Create an MBean |
|
|
Set the values of one or more MBean attributes |
|
|
Unregister one or more MBeans |
|
|
Query the server for a list of matching MBeans |
|
|
Set the value of one MBean attribute |
|
|
Get information about the MBean server |
So, for example, the equivalent twiddle command to dump the JNDI tree can be written as follows:
./twiddle.sh invoke jboss:service=JNDIView list true
If you want to contact a remote JBoss server, you have to use the s option as follows:
./twiddle.sh s 192.168.0.1 invoke jboss:service=JNDIView list true