The most significant change introduced by release 5.1.0 of the application server is the new administration console that is also known as Embedded Jopr project. For those who are new to the Jopr project, this is a sophisticated management platform for the JBoss middleware stack and is based on project RHQ.
Embedded Jopr is based on the same set of libraries as the Jopr project. However, there's a clear distinction between them; Jopr is a distributed management solution with agents on the managed resources and a central server. On the other hand, Embedded Jopr is supposed to run within a JBoss AS instance and thus it is intended to replace the JMX console.
In Chapter 3, Customizing JBoss AS Services, we had a bird's eye view of the new administration console. So by now you should already have some rudiments of it. The following section will be a useful administration reference for the most common management tasks.
A very common need of every software administrator is the management of deployed applications. If we are running the application server locally, this task is generally easy and can also be carried out by the Eclipse IDE. However, handling remotely deployed applications can be awkward if the only instrument available is the JMX console.
The administration manages Java EE applications in the following squared section:
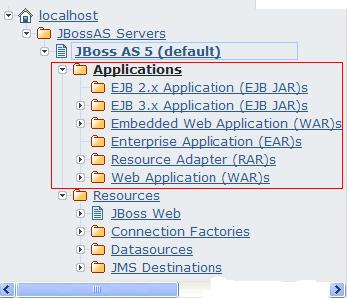
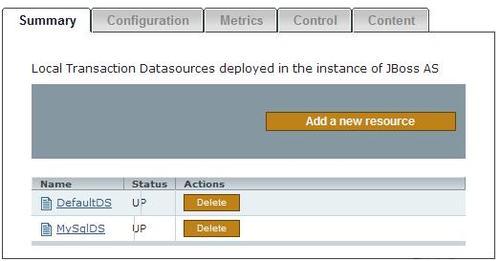
In order to deploy or undeploy an application, first choose the appropriate application type you need to manage, for example, a web application, and then focus on the central frame. There you can see the list of deployed applications for your selected type.
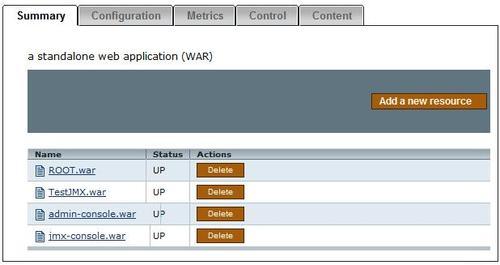
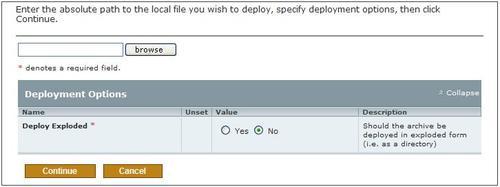
If you need to undeploy an application, just hit the Delete Actions button. Conversely, if you need to deploy a new application, click the Add a new resource button. The deployment of a new resource merely requires browsing the filesystem to locate the application and choosing whether to deploy it in the exploded format or not.
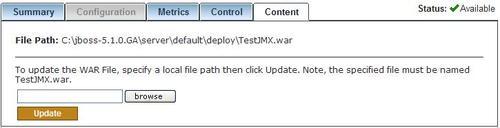
If your application has already been deployed and you just need to update it, there's an appropriate form that is reachable by clicking on the application name (in the application list) and then selecting the Content tab.
Again you just have to browse the filesystem to specify a local path for the application to be uploaded.
The administration console takes care managing application server resources in the lower part of the left frame.
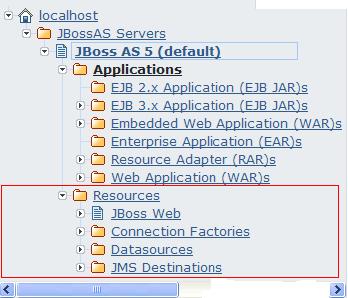
Start by expanding the type of resource you want to include. For example, if you want to add a new local-tx-datasource, expand the Datasources element, and click on the Local tx Datasources link. In the tabbed panel window, choose the Add a new resource button.
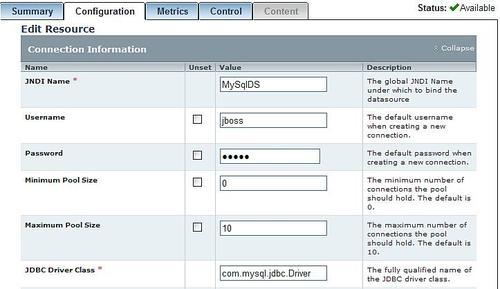
The administration console will then prompt you to choose a template, if one exists, for the resource (for example, a template for Oracle datasource) and finally will take you to a form for inserting the Connection Properties:

The previous connection schema will result in a new datasource definition, which will be persisted in the server/default/deploy directory in a file bearing the JNDI name and the ds.xml extension.
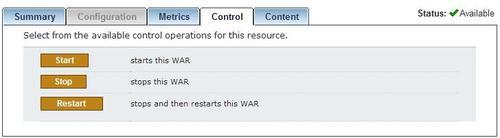
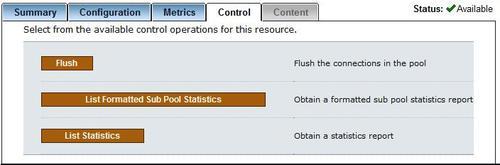
Administering resources includes a set of operations that are specific for each resource. For example, a connection pool would require to list pool statistics and flush the connection pool. A JMS resource would need to display messages, or stopping and restarting message delivering, and so on.
Resources can be managed by clicking on an individual resource in the central frame, and then selecting the Control tab option. From there you can choose among the list of available control operations.
In the same tab panel, you can manage the resource configuration by selecting the Configuration tab. From there on, you can alter the resource configuration and persist the changes.
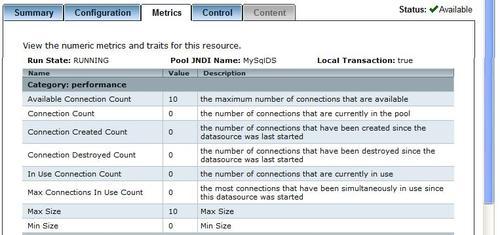
Both applications and resources have a list of metrics associated, which can be examined by choosing the option Metrics in the tabbed panel. For example, the following screenshot shows the Metrics for MySqlDS:
If you are curious to know where metrics configurations are stored, you need to dig a bit into the administration console structure. Precisely, you have to unzip the file rhq-plugin.xml that is located in the file server/default/deploy/admin-console.war/pluginsjopr-jboss-as-5-plugin-2.3.0.EmbJopr.1.2.0-1.jar.
For example, here's the metric for the Available Connection Count element:
<metric property="availableConnectionCount" measurementType="dynamic" displayType="summary" displayName="Available Connection Count" description="Number of available connections." defaultOn="true" defaultInterval="60000" dataType="measurement" category="performance"/>
<metric property="availableConnectionCount" measurementType="dynamic" displayType="summary" displayName="Available Connection Count" description="Number of available connections." defaultOn="true" defaultInterval="60000" dataType="measurement" category="performance"/>
If you want to expand your knowledge on plugins and metrics, we suggest you read this in-depth paper from Red Hat website: