Computers are dynamic and multipurpose machines; they do a variety of jobs using many tools. This chapter describes the ways you can manage these tools. One aspect of software management is installing, uninstalling, and upgrading software packages. Another aspect of this task is in managing programs after they’re running. Finally, this chapter covers log files, which record details of what running programs do—particularly programs that run automatically and in the background.
Understanding Package Management
Package management is an area of Linux that varies a lot from one distribution to another. Nonetheless, certain principles are common across most Linux distributions. This section describes these principles, followed by some of the basics of the two major Linux package management systems. It then describes how to manage packages using both the RPM Package Manager (RPM; a recursive acronym) and Debian package systems.
Linux Package Management Principles
If you’ve installed software in Windows, you’re likely familiar with the procedure of double-clicking on an installer program, which places all the files associated with a program where they should go. A Windows software installer is similar to a Linux package file, but there are a few differences. Linux packages have the following characteristics:
Each package is a single file that can be stored on a disk or transmitted over the Internet.
Linux package files, unlike Windows installers, are not programs; packages rely on other programs to do the work of installing the software.
Packages contain dependency information—that is, they can tell the packaging software what other packages or individual files must be installed in order for the package to work correctly.
Many program packages depend on library packages; libraries provide code that can be used by many programs.
Packages contain version information so that the packaging software can tell which of two packages is more recent.
Packages contain architecture information to identify the CPU type (x86, x86-64, ARM, and so on) for which they’re intended. A separate code identifies packages that are architecture-independent, such as fonts and desktop themes.
Binary packages (that is, those that contain executable programs that are CPU-specific) are typically built from source packages (which contain source code that a programmer can understand). It’s possible to build a new binary package, given the source package, which can be useful in some unusual circumstances.
You can compile and install software from source code manually, without using a packaging tool. This advanced topic is beyond the scope of this book.
The package software maintains a database of information about installed packages (the package database). This information includes the names and version numbers of all the installed packages, as well as the locations of all the files installed from each package. This information enables the package software to quickly uninstall software, establish whether a new package’s dependencies have been met, and determine whether a package you’re trying to install has already been installed and, if so, whether the installed version is older than the one you’re trying to install.
Packages can, and frequently do, contain files that will be installed to many directories on the computer. This fact makes tracking package contents critical.
Understanding Package Systems
As noted earlier, two package systems, RPM and Debian, are common, although others exist as well. These systems differ in various technical details, as well as in the commands used to manage packages and in the format of the package files they use. You cannot install a Debian package on an RPM-based system, or vice versa. Indeed, installing a package intended for one distribution on another is a bit risky even when they use the same package type. This is because a non-native package may have dependencies that conflict with the needs of native packages.
Table 1.1 in Chapter 1, “Selecting an Operating System,” summarizes some features of several popular Linux distributions, including the package system each uses.
Originally, package systems worked locally—that is, to install a package on your computer you would first have to download a package file from the Internet or in some other way. Only then could you use a local command to install the package. This approach, however, can be tedious when a package has many dependencies—you might attempt an installation, find unmet dependencies, download several more packages, find that one or more of them has unmet dependencies, and so on. By the time you’ve tracked down all these depended-upon packages, you might need to install a dozen or more packages. Thus, modern distributions provide network-enabled tools to help automate the process. These tools rely on network software repositories, from which the tools can download packages automatically. The network-enabled tools vary from one distribution to another, particularly among RPM-based distributions.
In practice, then, the process of managing software in Linux involves using text-mode or GUI tools to interface with a software repository. A typical software installation task works something like this:
You issue a command to install a program.
The software locates dependencies of the specified program and notifies you of any additional software that must be installed.
You issue a final approval for software installation (or decide against it, in which case the process stops).
The software downloads all the necessary packages.
The software installs all the packages.
You can configure most distributions to use local media instead of or in addition to Internet repositories.
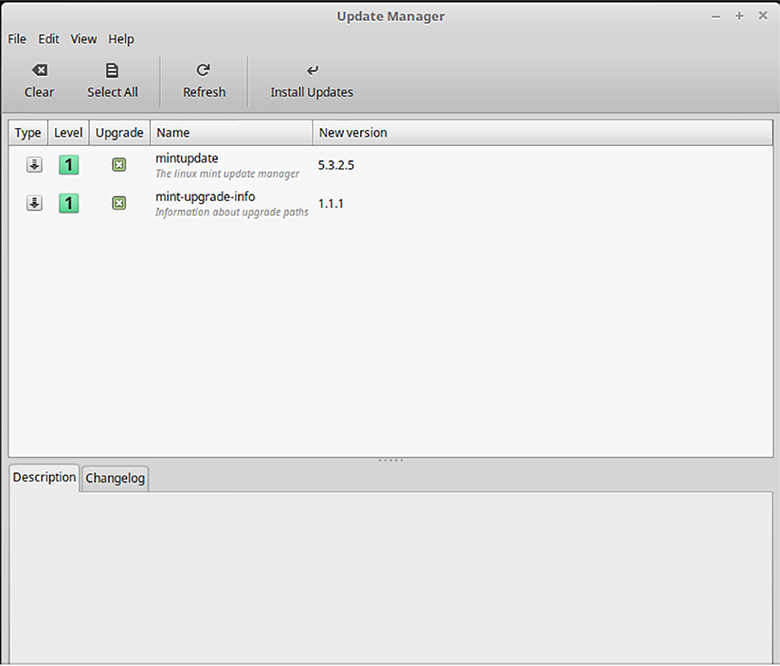
Upgrading software works in a similar way, although upgrades are less likely to require downloading depended-upon packages. Removing software can be done entirely locally, of course. Many distributions automatically check with their repositories from time to time and notify you when updates are available. Thus, you can keep your system up-to-date by clicking a few buttons when you’re prompted to do so. As an example, Figure 9.1 shows the Software Update utility in Linux Mint 18.3, which shows a list of available updates.
Immediately after installing a distribution, you may find that a large number of updates are available.
Package management necessarily involves root access, which is described in more detail in Chapter 13, “Creating Users and Groups.” If you follow the automatic prompts to update your software, you can keep the system up-to-date by entering the root password, or on some distributions your regular password, when the update software prompts for it.
Figure 9.1 Most Linux distributions tell you when updates are available for your software.
Managing Red Hat Systems
RPM-based distributions include Red Hat, Fedora, CentOS, SUSE Enterprise, openSUSE, and Mandriva. The basic tool for installing software on these distributions is the text-mode rpm command. This program works on local files, though; to use a network repository, you must use another tool, which varies by distribution:
Red Hat, Fedora, and CentOS use the text-mode yum or dnf, or various GUI front ends to them, such as PackageKit and Yumex.
SUSE Enterprise and openSUSE use zypper or a GUI front end such as YaST 2.
Because of the variability between these distributions, particularly for network-enabled updates, providing a complete description of all these tools is impractical here. Fortunately, the GUI tools are easy to use and accessible. Even the text-mode tools are fairly straightforward, although you may need to consult their man pages to learn the details. Typically, they use logical subcommands, such as install to install a package, as in:
# dnf install yumex
You might use this command to install the GUI Yumex tool on a Red Hat, Fedora, or CentOS system. Similarly, you can remove a specific package by using the remove subcommand or upgrade all of a computer’s packages by using upgrade:
If you want to both upgrade software and remove packages, it’s generally best to remove software first. This can obviate some downloads, reducing the upgrade time.
# dnf remove zsh# dnf upgrade
This example removes the zsh package, then upgrades the remaining packages on the system. Both commands will produce a number of lines of output, and you may be asked to verify their actions. Consult the man page for yum (or whatever package management software your distribution uses) to learn more about this tool.
If you need to deal with RPM package files directly, you should be aware that they have filename extensions of .rpm. These files also usually include codes for architecture type (such as i386 or x86_64), and often codes for the distribution for which they’re intended (such as fc30 for Fedora 30). For instance, samba-4.10.2-0.fc30.x86_64.rpm is a package file for the samba package, version 4.10.2, release 0, for Fedora 30, on the x86-64 platform. To install it using the rpm command, you’d type.
# rpm –Uvh samba-4.10.2-0.fc30.x86_64.rpm
That takes a bit more work than using the yum command, as you need to know the complete filename of the installation package.
Managing Debian Systems
The Debian GNU/Linux distribution created its own package system, and distributions based on Debian, such as Ubuntu and Mint, use the same system. Atop the basic Debian package system lies the Advanced Package Tool (APT), which provides access to network repositories.
Third-party implementations of APT for many RPM-based distributions also exist. See apt4rpm.sourceforge.net for details. At least one RPM-based distribution, PCLinuxOS, uses APT natively.
The dpkg command is the lowest-level interface to the Debian package system; it’s roughly equivalent to the rpm utility on RPM-based systems. Just as with the rpm utility, to use the dpkg command you need to know the exact name of the package to install:
# dpkg –i samba_4.9.5+dfsg-5+deb10u1_amd64.deb
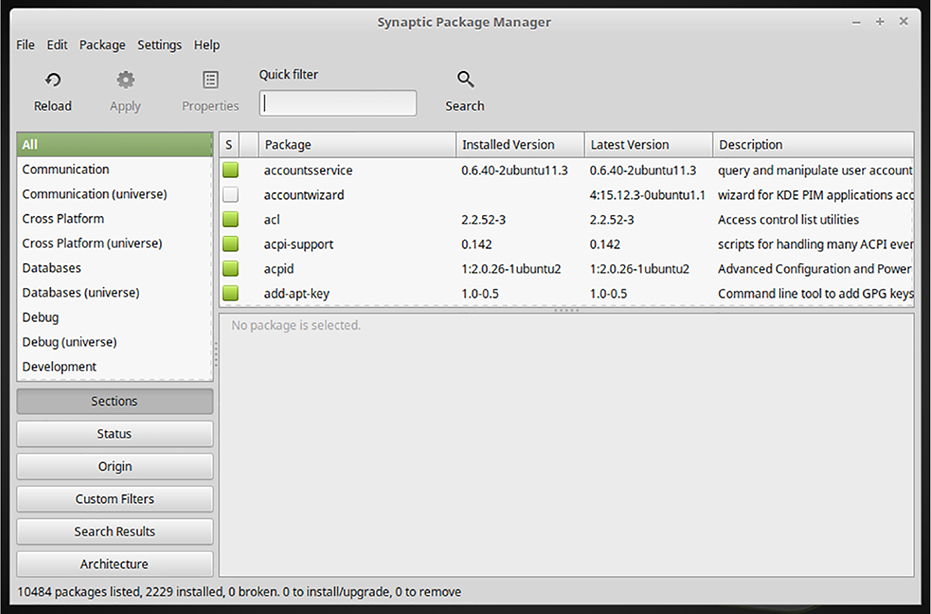
Several tools provide text-mode and graphical interfaces atop dpkg, the most important of these being the text-mode apt-get or the newer apt tool and the GUI Synaptic. As their names imply, apt-get and Synaptic provide access to network repositories via APT. Figure 9.2 shows Synaptic in use.
Figure 9.2 Synaptic enables you to search for, select, install, and uninstall software on Debian-based systems.
Debian package files have names that end in .deb. Like RPM packages, these names typically include codes for the software version and architecture (such as i386 or amd64). For instance, samba_3.6.1-3_amd64.deb is a Debian package file for the samba package, version 3.6.1, revision 3, for AMD64 (x86-64) CPUs. You can install such files using dpkg or apt-get, or you can use apt-get to download a package and its dependencies from the Internet, using its install command, as in:
# apt install samba
As with RPM packages, you can remove packages or upgrade your computer’s software, too:
# apt remove zsh# apt upgrade
APT is a powerful tool, as is the underlying dpkg. You should consult these programs’ man pages to learn more about how to use these programs.
Understanding the Process Hierarchy
The Linux kernel is the core of a Linux installation. The kernel manages memory, provides software with a way to access the hard disk, doles out CPU time, and performs other critical low-level tasks. The kernel is loaded early in the boot process, and it’s the kernel that’s responsible for managing every other piece of software on a running Linux computer.
One way the kernel imposes order on the potentially chaotic set of running software is to create a sort of hierarchy. When it boots, the kernel runs just one program—usually either /lib/systemd or /sbin/init. These processes are then responsible for starting all the other basic programs that Linux must run, such as the programs that manage logins and always-up servers. Such programs, if launched directly by systemd or init, are called its children. The children processes can in turn launch their own children. This happens when you log into Linux. The process that launched a given process is called its parent.
You can change which program runs as the first process by adding the init= option to your boot loader’s kernel option line, as in init=/bin/bash to run bash.
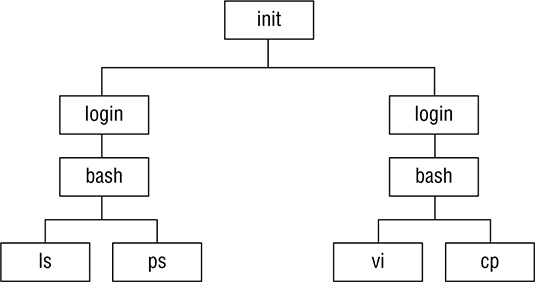
The result of this system is a treelike hierarchy of processes, as illustrated in Figure 9.3. (“Trees” in computer science are often depicted upside down.) Figure 9.3 shows a small subset of the many processes that run on a typical Linux installation: just a few processes associated with a text-mode login, including the login tool that manages logins, a couple of bash shells, and a few user programs. A working Linux system will likely have dozens or hundreds of running processes. The one on which I’m typing these words has 213 processes going at once!
Figure 9.3 Linux processes are arranged in a hierarchical tree.
Occasionally, a process will terminate but leave behind children. When this happens, init “adopts” those child processes.
Every process has a process ID (PID) number associated with it. These numbers begin with 1, so init’s PID is normally 1. Each process also has a parent process ID (PPID) number, which points to its parent. Many of the tools for managing processes rely on these numbers, and particularly on the PID number.
Internally, the kernel maintains process information in the process table. Tools such as ps and top (described shortly) enable you to view and manipulate this table.
Identifying Running Processes
Before you can manage processes, you must be able to identify them. The ps and top utilities can help you identify processes. In either case, you can search for processes in various ways, such as by name or by resource use. You may also want to identify how much memory your processes are consuming, which you can do with the free command.
Using ps to Identify Processes
The simplest tool for identifying processes is ps, which produces a process listing. Listing 9.1 shows an example of ps in action. In this example, the -u option restricts output to processes owned by the specified user (rich), whereas ––forest creates a display that shows parent/child relationships.
Listing 9.2 shows a second example of ps. In this example, the u option adds informational columns, whereas U rich restricts output to processes owned by rich. The ps command supports a huge number of options (consult its man page for details).
The version of ps used in most Linux distributions combines features from several earlier ps implementations. The result is a huge selection of sometimes redundant options.
Listing 9.2: Output of ps u U rich$ ps u U richUSER PID %CPU %MEM VSZ RSS TTY STAT START TIME COMMANDrich 19221 0.0 1.5 4484 1984 ? S Sep07 0:01 dfmrich 2451 0.0 0.8 1856 1048 pts/3 S 16:13 0:00 -bashrich 2496 0.2 3.2 6232 4124 ? S 16:17 0:00 /opt/kdrich 2498 0.0 0.8 1860 1044 pts/1 S 16:17 0:00 bashrich 2505 0.1 2.6 4784 3332 pts/1 S 16:17 0:00 neditrich 2506 0.0 0.7 2124 1012 ? S 16:17 0:00 /bin/csrich 2544 0.0 1.0 2576 1360 ? S 16:17 0:00 xeyesrich 2556 0.0 0.7 2588 916 pts/3 R 16:18 0:00 ps u U
Given the large number of ps options, different users can have favorite ways to use the program. One popular combination of options is ax, which produces the information most system administrators want, including PID values and command names (including command-line options) for all the processes on the computer. Adding u (as in ps aux) adds usernames, CPU loads, and a few other tidbits. The sheer scope of the information produced, however, can be overwhelming. One way to narrow this scope is to pipe the results through grep, which eliminates lines that don’t include the search criterion you specify. For instance, if you want to know the PID number for the gedit process, you can do so like this:
Because ps ax produces commands with their options, using grep to search for a string in the output returns the searched-for command, as well as the grep command itself.
This command reveals that gedit has a PID value of 27946. This is usually the most important information when you use ps, since you’ll use the PID value to change a process’s priority or terminate it.
Using top to Identify Processes
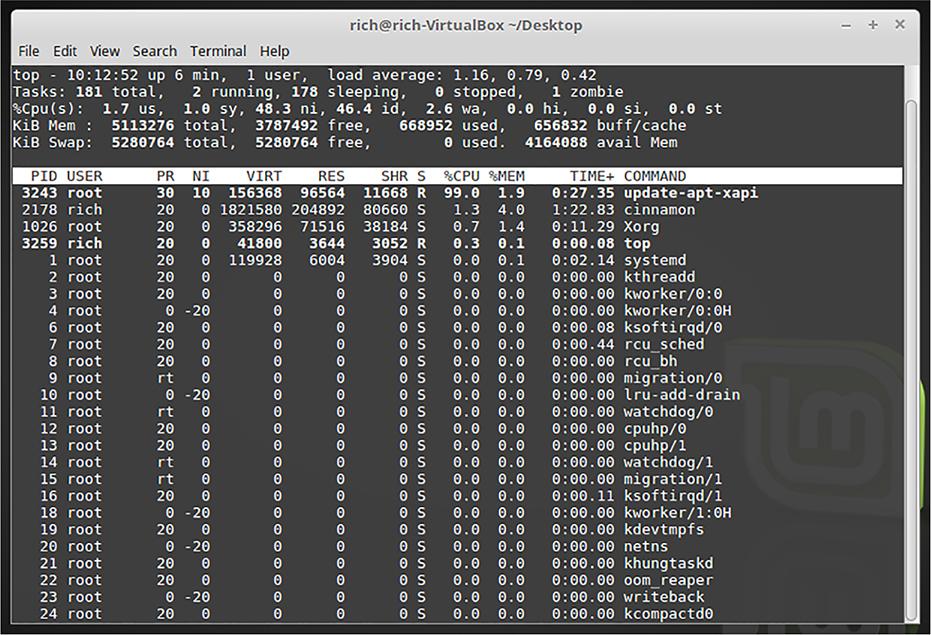
Although ps can return process priority and CPU use information, the program’s output is usually sorted by PID number and provides information at only a single moment in time. If you want to quickly locate CPU- or memory-hogging processes, or if you want to study how resource use varies over time, another tool is more appropriate: top. This program is essentially an interactive version of ps. Figure 9.4 shows top running in a GNOME Terminal window.
Figure 9.4 The top command shows system summary information and information about the most CPU-intensive processes on a computer.
By default, top sorts its entries by CPU use, and it updates its display every few seconds. You’ll need to be familiar with the purposes and normal habits of programs running on your system to determine if a CPU-hungry application is misbehaving. In the example shown in Figure 9.4, an APT update process is taking up almost all of the CPU time. To determine that, note the %CPU column entry, then scan to the far-right COMMAND column to note the process that’s using the CPU time. Although this is a useful tool, be careful not to jump to conclusions too quickly. In this example, yes, the APT update process is taking up lots of CPU time at that moment, but that’s a short burst of activity and drops when the update completes. The legitimate needs of different programs vary so much that it’s impossible to give a simple rule for judging when a process is consuming too much CPU time.
You can do more with top than watch it update its display. When it’s running, you can enter any of several single-letter commands, some of which prompt you for additional information, as summarized in Table 9.1. Additional commands are described in top’s man page.
Kill a process. The top program will ask for a PID number, and if it’s able to kill the process, it will do so.
q
Quit from top.
r
Change a process’s priority.
s
Changes the display’s update rate, which you then enter in seconds.
P
Set the display to sort by CPU usage, which is the default.
M
Change the display to sort by memory usage.
One piece of information provided by top is the load average, which is a measure of the demand for CPU time by applications. In Figure 9.4, you can see three load-average estimates on the top line; these correspond to the current load average and two previous measures. Load averages can be interpreted as follows:
A system on which no programs are demanding CPU time has a load average of 0.
A system with one program running a CPU-intensive task has a load average of 1.
Higher load averages on a single-CPU system reflect programs competing for available CPU time.
On a computer with multiple CPUs or CPU cores, load averages can reach the number of CPUs or cores before competition for CPU time begins. For instance, a load average of 4.0 on a system with a four-core CPU reflects processes demanding exactly as much CPU time as the computer has available.
Most computers sold today are multicore models, but if you’re running Linux on an older system, single-core models dominated the marketplace prior to about 2006. Use the lscpu command to see how many CPUs your system contains.
The load average can be useful in detecting runaway processes. For instance, if a system normally has a load average of 0.5 but it suddenly gets stuck at a load average of 2.5, a few CPU-hogging processes may have hung—that is, become unresponsive. Hung processes sometimes needlessly consume a lot of CPU time. You can use top to locate these processes and, if necessary, stop them.
The w command, described in Chapter 13, can tell you how much CPU time entire terminal sessions are consuming.
Measuring Memory Use
Processes consume a number of system resources, the most important of these being CPU time and memory. As already noted, top sorts your processes by CPU time by default, so you can identify processes that are consuming the most CPU time. You can press the M key within top to have it sort by memory use, thus identifying the processes that are consuming the most memory. As with CPU time, you can’t say that a process is consuming too much memory simply because it’s at the top of the list, though; some programs legitimately consume a great deal of memory. Nonetheless, sometimes a program consumes too much memory, either because of inefficient coding or because of a memory leak—a type of program bug in which the program requests memory from the kernel and then fails to return it when it’s done with the memory. A program with a memory leak consumes increasing amounts of memory, sometimes to the point where it interferes with other programs. As a short-term solution, you can usually terminate the program and launch it again, which resets the program’s memory consumption, something like draining a sink that’s filled with water from a leaky faucet. The problem will recur, but if the memory leak is small enough, you’ll at least be able to get useful work done in the meantime.
The kernel grants programs access to sets of memory addresses, which the programs can then use. When a program is done, it should release its memory back to the kernel.
If you want to study the computer’s overall memory use, the free command is useful. This program generates a report on the computer’s total memory status:
$ free total used free shared buffers cachedMem: 7914888 7734456 180432 0 190656 3244720-/+ buffers/cache: 4299080 3615808Swap: 6291452 1030736 5260716
The Mem: line reveals total random access memory (RAM) statistics, including the total memory in the computer (minus whatever is used by the motherboard and kernel), the amount of memory used, and the amount of free memory. This example shows that most of the computer’s memory is in use. Such a state is normal, since Linux puts otherwise unused memory to use as buffers and caches, which help speed up disk access. Thus, the Mem: line isn’t the most useful; instead, you should examine the -/+ buffers/cache: line, which shows the total memory used by the computer’s programs. In this example, 4,299,080 KiB of 7,914,888 KiB are in use, leaving 3,615,808 KiB free. In other words, a bit over half the computer’s memory is in use by programs, so there should be no memory-related performance problems.
The Swap: line reveals how much swap space Linux is using. Swap space is disk space that’s set aside as an adjunct to memory. Linux uses swap space when it runs out of RAM, or when it determines that RAM is better used for buffers or caches than to hold currently inactive programs. In this example, 1,030,736 KiB of swap space is in use, with 6,291,452 KiB total, for 5,260,716 free. Swap space use is generally quite low, and if it rises very much, you can suffer performance problems. In the long run, increasing the computer’s RAM is generally the best solution to such problems. If you’re suffering from performance problems because of excessive swap use and you need immediate relief, terminating some memory-hogging programs can help. Memory leaks, described earlier, can lead to such problems, and terminating the leaking program can restore system performance to normal.
The free command supports a number of options, most of which modify its display format. The most useful of these is -m, which causes the display to use units of mebibytes (MiB) rather than the default of kibibytes (KiB).
Using Log Files
Many programs that run in the background (that is, daemons) write information about their normal operations to log files, which are files that record such notes. Consulting log files can therefore be an important part of diagnosing problems with daemons. The first step in doing this is to locate your log files. In some cases, you may need to tell the program to produce more verbose output to help track down the problem, so this section provides some pointers on how to do that. This section also describes the kernel ring buffer, which isn’t technically a log file but can fill a similar role for kernel information.
Locating Log Files
Linux stores most log files in the /var/log directory tree. Some log files reside in that directory, but some servers create entire subdirectories in which to store their own log files. Table 9.2 summarizes some common log files on many Linux systems. In addition, many server programs not described in this book add their own log files or subdirectories of /var/log. If you experience problems with such a server, checking its log files can be a good place to start troubleshooting.
Log file details vary between distributions, so some of the files in Table 9.2 may not be present on your system, or the files you find may have different names.
Services that are started late in the boot process via SysV startup scripts
cron
Processes run at regular intervals via the cron daemon. Although this book doesn’t cover cron, a problem with it can cause glitches that recur at regular intervals, so you should be aware of it.
cups/
Directory holding log files related to the Linux printing system
gdm/
Directory holding log files related to the GNOME Display Manager (GDM), which handles GUI logins on many systems
messages or syslog
A general-purpose log file that contains messages from many daemons that lack their own dedicated log files
secure
Security-related messages, including notices of when users employ su, sudo, and similar tools to acquire root privileges
Xorg.0.log
Information on the most recent startup of the X Window System (X)
Log files are frequently rotated, meaning that the oldest log file is deleted, the latest log file is renamed with a date or number, and a new log file is created. For instance, if it’s rotated on December 1, 2019, /var/log/messages will become /var/log/messages-20191201, /var/log/messages-1.gz, or something similar, and a new /var/log/messages will be created. This practice keeps log files from growing out of control.
Log file rotation occurs late at night, so it won’t happen if you shut off your computer. Leave it running overnight periodically to ensure log files are rotated.
Most log files are plain-text files, so you can check them using any tool that can examine text files, such as less or a text editor. One particularly handy command is tail, which displays the last 10 lines of a file (or as many lines as you specify with the -n option). For instance, typing tail /var/log/messages shows you the last 10 lines of that file.
Note that not all programs log messages. Typically, only daemons do so; ordinary user programs display error messages in other ways—in GUI dialog boxes or in a text-mode terminal. If you think a program should be logging data but you can’t find it, consult its documentation. Alternatively, you can use grep to try to find the log file to which the program is sending its messages. For instance, typing grep sshd /var/log/* finds the files in which the string sshd (the SSH daemon’s name) appears.
Creating Log Files
Some programs create their own log files; however, most rely on a utility known generically as the system log daemon to do this job. This program’s process name is generally journald, syslog, or syslogd. Like other daemons, it’s started during the boot process by the system startup scripts. Several system log daemon packages are available. Some of them provide a separate tool, klog or klogd, to handle logging messages from the kernel separately from ordinary programs.
You can modify the behavior of the log daemon, including adjusting the files to which it logs particular types of messages, by adjusting its configuration file. The name of this file depends on the specific daemon in use, but it’s typically /etc/rsyslog.conf or something similar. The details of log file configuration are beyond the scope of this book, but you should be aware that such details can be altered. This fact accounts for much of the distribution-to-distribution variability in log file features.
After it’s running, a log daemon accepts messages from other processes using a technique known as system messaging. It then sorts through the messages and directs them to a suitable log file depending on the message’s source and a priority code.
Producing More Verbose Log File Entries
Sometimes log files don’t provide enough information to pin down the source of a problem. Fortunately, many programs that produce log file output can be configured to produce more such output. Unfortunately, doing so can sometimes make it harder to sift through all the entries for the relevant information.
The procedure for increasing the verbosity of log file output varies from one program to another. Typically, you must set an option in the program’s configuration file. You should consult the program’s documentation to learn how to do this.
Examining the Kernel Ring Buffer
The kernel ring buffer is something like a log file for the kernel; however, unlike other log files, it’s stored in memory rather than in a disk file. Like regular log files, its contents continue to change as the computer runs. To examine the kernel ring buffer, you can type dmesg. Doing so creates copious output, though, so you’ll typically pipe the output through less:
Because the kernel ring buffer has a limited size, its earliest entries can be lost if the computer runs for a long time or if something produces many entries.
$ dmesg | less
Alternatively, if you know that the information you want will be associated with a particular string, you can use grep to search for it. For instance, to find kernel ring buffer messages about the first hard disk, /dev/sda, you might type the following:
$ dmesg | grep sda
Kernel ring buffer messages can be particularly arcane; however, they can also be invaluable in diagnosing hardware and driver problems, since it’s the kernel’s job to interface with hardware. You might try searching the kernel ring buffer if a hardware device is behaving strangely. Even if you don’t understand a message you find, you could try feeding that message into a web search engine or passing it on to a more knowledgeable colleague for advice.
Some distributions place a copy of the kernel ring buffer when the system first boots in /var/log/dmesg or a similar file. You can consult this file if the computer has been running for long enough for its earliest entries to be lost. If you want to create such a file on a distribution that doesn’t do so by default, you can edit the /etc/rc.d/rc.local file and add the following line to its end:
dmesg > /var/log/dmesg
Summary
An operating Linux computer can be thought of as consisting of running programs—that is, processes. Managing processes begins with managing the programs installed on the computer, which is a task you can perform with package management tools such as rpm or dpkg. You can learn what processes are running by using tools such as ps and top. Log files can help you learn about the actions of daemons, which may not be able to communicate error messages through the type of text-mode or GUI output that other programs can generate.
Exam Essentials
Explain how package management makes installing software easy. Package management bundles all the files required for an application into a single installation process. When you install an application using a package management system, it places the files in the correct location automatically and tracks the version of each file required for the application. If a newer version of the application is available, the package management software can inform you and make updating the application files a simple one-step process.
Describe how you can view the programs running on your Linux system. Programs running on the Linux system are called processes. You can view currently running processes using either the ps or top commands. The ps command provides a snapshot view of what processes are running when you run the command. It has lots of options that allow you to customize what information it displays. The top command produces a real-time chart of running processes, allowing you to sort the chart data based on different criteria, such as CPU usage, memory usage, or program name.
Describe how you can see error messages generated by the kernel. Linux stores messages generated by the kernel in the kernel ring buffer, a circular buffer area reserved in memory. As new messages enter the buffer area, old messages are deleted to make room. You use the dmesg command to view the messages currently stored in the kernel ring buffer, but any old messages are lost and can’t be retrieved.
Review Questions
You can find the answers in Appendix A.
Which of the following tools is best suited to installing a software package and all its dependencies on a Debian computer?
yum
zypper
dmesg
rpm
apt-get
What are the two most popular utilities used as the first process that the Linux kernel runs, aside from itself? (Choose two.)
init
bash
systemd
login
grub
Where do most log files reside on a Linux computer?
/var/log
/etc/logging
/usr/log
/home/logging
/log/usr
True or false: When using suitable commands, you can normally install a program and be sure that all the software on which it depends will also be installed, provided you have an Internet connection.
True or false: By default, the first process listed in top is currently consuming the most CPU time.
True or false: The dmesg command may produce different output after a computer has been running for weeks than when it first started.
Most Linux distributions maintain information on what packages are installed in the ________.
kernel
package database
graphical desktop
/usr/lib directory
Software updater
You’re using Bash, and you type emacs to launch the emacs editor. In this case, emacs is Bash’s ________ process.
child
parent
server
client
parallel
General system messages are likely to be found in /var/log/messages or /var/log/, ________ depending on your distribution.
secure
dmesg
syslog
mail
wtmp
The command you use to read messages generated during the boot process and stored in the kernel ring buffer is the ________ command.

 Computers are dynamic and multipurpose machines; they do a variety of jobs using many tools. This chapter describes the ways you can manage these tools. One aspect of software management is installing, uninstalling, and upgrading software packages. Another aspect of this task is in managing programs after they’re running. Finally, this chapter covers log files, which record details of what running programs do—particularly programs that run automatically and in the background.