
Chapter Ten. Build Quality In
When things go wrong, the cause is almost always inherent in the system, and therefore it is a management problem. Managers who push harder on people to meet deadlines or reduce defects are ignoring the system problem and will usually make things worse. Instead, leaders must envision and institute fundamental changes that address the systemic causes of current problems.
Mary and Tom Poppendieck1
1. Mary and Tom Poppendieck, Implementing Lean Software Development: From Concept to Cash (Addison-Wesley, 2007), p. 123.
You’ve probably heard the story about the light bulb factory that stopped testing all the bulbs when they figured out how to improve quality to the point where they all worked. This story may be an urban myth, but it makes the point. In a perfect world, testing is waste; just build it right the first time. If all prior steps in a software development cycle were perfect, there wouldn’t be a need for testing at all.
However, perfect knowledge, perfect requirements and design, perfect automation and mass customization, perfect team empowerment, and so on are outside the current capabilities and state of technology at the enterprise system-of-systems scale. So we will concede that short test cycles are not waste. The reason organizations perform long test cycles over several months is that they typically find a large number of defects. Most defects occur because of less-than-perfect quality in prior steps, particular requirements definition.
How do you strive for perfect requirements? One way is to simulate and execute the business process during development. If users are required to specify requirements to a level of precision and specificity needed for a business process simulator to function, most issues would be identified early. The problem with most requirements is that users/analysts throw up their hands when they don’t know exactly what data or transformations are required, and in the interest of sticking to the project schedule, they write very general requirements and let the developers figure out the details. The developers, of course, don’t have the in-depth business knowledge, so they make their best guess using whatever information they have. This ultimately leads to elongated testing cycles where the “real” requirements are discovered.
If every step in a process has high standards and strives to ensure that its output to the next step never has to backtrack to the previous step, we can envision a time when integration testing that today takes months can be reduced to days. This leads to small batch sizes. Large batch sizes and expensive integration testing feed on each other. If integration testing is expensive, the tendency is to make releases as big as possible. If batches are large, there are lots of defects, so organizations feel they need a lot of testing. And so on.
Building quality in is a journey that uses all six of the other Lean principles. The Lean approach to quality is to create a culture in which the objective is to identify problems as early as possible and immediately stop to fix those problems. Lean focuses on doing it right the first time. Rather than finding, accumulating, and fixing issues in batches downstream, Lean means building quality into the flow of development and fixing problems in small batches (ideally batches of one) as soon as they are identified.
With Lean Integration, data quality and integration quality are two distinct areas you should be working to improve. Initiatives to improve quality in these areas are somewhat different, involving different people and approaches. This chapter discusses both of these areas.
The chapter finishes with a case study from a utility company ICC showing how the team drove a data quality program to achieve “one version of the truth.”
Two Areas of Quality: Data Quality and Integration Quality
Data quality is a broad umbrella term used to describe the accuracy, completeness, consistency, conformity, and timeliness of a particular piece or set of data. Numerous books have been written about data quality, so we will only summarize thoughts on this topic in this chapter. We suggest checking out Larry English’s book Information Quality Applied2 and Jack E. Olson’s book Data Quality3 for more detailed information.
2. Larry P. English, Information Quality Applied: Best Practices for Improving Business Information, Processes, and Systems (Wiley Publishing, 2009).
3. Jack E. Olson, Data Quality: The Accuracy Dimension (Morgan Kaufmann, 2003).
The gigabytes, terabytes, or even petabytes of data held by large organizations should be one of the most valuable assets those organizations have. However, examination of that data shows that its quality can be quite poor. Bad data results in loss of value and measurable business waste. This waste is measured in lost business, shrinking market share, process inefficiencies, or lost revenue from cross-sell or up-sell opportunities missed because of bad or missing customer data. Additionally, newspaper headlines announce the costs of bad data that lead to compliance issues in banking, insurance, health care, and just about every other industry. Incomplete, missing, or inconsistent data has monetary repercussions. Quantifying this cost is not always easy, but companies that do so are able to energize management and staff to improve data quality and thereby reduce risks, improve customer service, and drive bottom-line financial results.
Integration quality refers to the quality of the software services, workflows, processes, transformations, and other logic that control the movement and integration of data. The complexity of the integration dependencies in the system-of-systems and the need to modify them frequently because of the changing needs of the business make maintaining high-quality standards challenging and typically inefficient. Lean approaches that build quality into the integration construction process itself can eliminate a tremendous source of waste in the value stream.
The payload for integration is data. One of the most frequent reasons for cost overruns is finding data quality issues late in the project cycle. Other books have treated data and software or integration quality separately, but we bring these two topics together because if they are not attacked together, it is difficult to remove waste from your ICC.
Lean Integration aligns beautifully with the manufacturing metaphor. Imagine an automobile factory: We can view cars and their parts as being like data in our Integration Factory. Additionally, we can view the assembly lines as being like the integrations that transport and manipulate the data in the Integration Factory. Quality involves the continual improvement of identifying and fixing the root causes of problems in the cars/parts (the data) as well as the processes or assembly lines (the integration logic and metadata) that move and change these cars/parts.
Quality Evolution and Lean
Quality initiatives swept through the North American and European business communities starting in the late 1970s and 1980s when the superior quality of Japanese cars and electronics became recognized worldwide. At that point, North American and European businesses recognized the work of W. Edwards Deming, who had been working with Japanese industry starting in 1950. They began studying his thinking and adopting his principles and ideas in the quality revolution that followed. Quality initiatives took hold not only in the manufacturing world but in the service and retail industries as well. The benefits of high quality and the costs of poor quality were too great to ignore, and high quality became a business imperative in order to be more competitive.
Overall, one of Deming’s most important innovations in management thinking is that mistakes are typically not the fault of the person making them. They are the fault of the system that fails to mistake-proof the places where mistakes can occur. The cause of problems is almost always inherent in the system, and therefore the problem is a management problem. Managers who pressure workers to work harder to produce more or meet deadlines or reduce defects are ignoring the system problem and are often making things worse.
Efforts to reduce the variance in data or integration quality by using the mass customization and automation-of-processes principles discussed in the previous chapters go a long way toward mistake-proofing data and integration systems. Discussions with organizations that use mass customization and automation show that quality benefits actually outweigh productivity benefits, which might come as a surprise to many.
One of the key tenets of Lean thinking is that it is less costly to fix problems immediately than it is to let problems build up and fix them in batches later.
Toyota implemented a system on its assembly lines that allowed individual workers to stop the line the moment that they identified any problem. This visual and tactile system for immediately identifying problems as they occur and initiating action to do something about them is a completely novel way of attacking quality. At first glance, fixing problems every time they surface seems extremely inefficient. Traditional manufacturers, for instance, would pull bad-quality items out of the line into another area to be reprocessed later. The traditional approach to mass production is to keep the line moving at all times for maximum efficiency.
At Toyota, a worker would pull an “andon cord,” which notified the team leader of the problem at that station. The team leader would look at the issue, identify the root cause, and decide whether to stop the line or not, depending on the size and severity of the problem. In either case, the objective was to fix the underlying problem as quickly as possible. Do not let problems fester or accumulate. Fix problems immediately. Letting problems linger means more items will be produced with the same problem. Fixing the underlying root cause will result in less waste and higher value for the customer.
As Toyota began implementing its Lean philosophy at plants in North America, an interesting dynamic occurred. North American plant managers who came to Toyota after working for years at American car companies were not stopping the lines when problems occurred. They had to unlearn the goal of keeping the line running at all times. It took time and repeated reinforcement to convince these new plant managers that management supported these stoppages and was willing to live with slightly slower output at first in order to achieve higher quality and higher output later.
The Lean (and agile) objective of working quickly in small batch sizes, fixing most problems as they are discovered, ultimately results in less waste from the perspective of the overall customer value stream.
Data Quality
Data is one of the most important assets in any organization. Data represents the customers, products, transactions, events, outcomes, and results of the enterprise. As data gets older, it usually degrades in quality and therefore depreciates in value. The reasons for data quality degradation are many, but principal causes include human error, process inconsistencies, and system changes that do not address all impacted data dependencies. There is so much data in organizations that most data problems are hidden. Here are some examples:
• A bank holding more in reserve because of concerns over the householding and identity-matching success of its algorithms
• Direct mailings being returned or duplicated because addresses are incomplete or incorrect
• Bad management decisions because analysis is made using incomplete or incorrect data
• Costs incurred because manufacturing processes are done improperly but are masked by incomplete or inconsistent data
Business Drivers and Objectives
Poor data quality costs businesses money and leads to breakdowns in the supply chain, poor business decisions, and inferior customer relationship management. Defective data also hampers efforts to meet regulatory compliance responsibilities. More subtly, inconsistent data quality implementations at different levels of the organization—even when individually the data quality is good—impose additional costs as organizational data is migrated to more centralized locations.
Data quality encompasses more than finding and fixing missing or inaccurate data. It means delivering comprehensive, consistent, relevant, fit-for-purpose, and timely data to the business, regardless of its application, use, or origin.
Ensuring data quality is a challenge for most organizations—partly because they may not be fully aware of their own data quality levels. Without this information, they cannot know the full business impact of poor or unknown data quality or how to begin addressing it. While moving this information to the enterprise level increases the challenge, it also greatly increases the potential return as duplication of effort may be reduced, the hidden costs of data inconsistencies may be avoided, and a holistic understanding of enterprise data quality issues may be realized.
The most common business drivers for data quality initiatives are
• Mergers and acquisitions (M&A)
Beyond data quality, we need to govern all aspects of data as an asset that requires the joint collaboration of IT and the business. We define data governance as “the processes, policies, standards, quality, consistency, auditability, and security of data in a company or institution.” The following sections examine the business drivers in more detail to understand the integral role data governance can play in furthering these business drivers by “building quality in” as part of a sustainable practice rather than reacting to discrete events.
Growing Revenue
A top-priority goal for almost any business is to grow revenue, and one of the effective ways to do so is to increase cross-sell and up-sell rates and improve retention among existing customers. To do so, organizations require a broad and deep understanding of their existing customers. They need a “single view of the customer” in order to be able to provide superior service and to better target campaigns and offers based upon a specific customer’s needs.
Customer data is often scattered across dozens or even hundreds of different business systems. To resolve these data issues, companies must address the underlying organizational, process, and technical issues related to the data. Data governance provides the framework for building quality in by addressing complex issues such as improving data quality and developing a single view of the customer at an enterprise level.
Lowering Costs
One of the important ways organizations can reduce costs and increase operational efficiency is to automate business processes. For example, organizations may automate their procurement processes to lower purchasing and administration costs. While business process automation increases efficiency, problems with enterprise data prevent companies from capitalizing on the full potential of operational efficiency initiatives. Streamlining business processes across multiple financial, human resource, sales, and other business systems requires that the structure and meaning of data be reconciled across those systems—a task that has often been an afterthought in operational efficiency initiatives.
The need to lower costs is driving projects such as supplier or product master data management that enable companies to streamline core business processes (e.g., inventory and supply chain management) by rationalizing, cleansing, and sharing key master data elements. Data governance plays a critical role in the success of such projects, providing a structure for addressing the organizational, policy, and process issues around data.
Ensuring Compliance
Virtually every business today is required to comply with a number of external regulations as well as with internal corporate governance policies designed to increase transparency and prevent corporate malfeasance and fraud. To ensure compliance with regulations such as Sarbanes-Oxley (SOX), Basel II, the U.S. Patriot Act, the U.S. Health Insurance Portability and Accountability Act (HIPAA), and with internal policies and controls, companies must streamline the collection of reporting data. For many regulations they must also document the sources of the data being reported, certify its accuracy, and implement specific governance policies. Complying with these regulations and policies can be a burden.
Data governance is an essential foundation for ensuring compliance. It establishes the rigorous data standards, policies, and processes that are required by regulations and corporate governance policies, and it helps to automate compliance-related tasks (while lowering costs). It also helps to ensure auditability and accountability for the data.
Mergers and Acquisitions
With M&A activity, organizations are faced with the need to rationalize and reconcile the IT environments from merged or acquired entities. Typically these IT environments have very different systems, data models, and business processes. Post-M&A, IT organizations are often pressed to meet very tight timelines for integration. The goal is to accelerate the promised synergies from the merger, in the form of both cost reductions from eliminating redundancies and revenue growth from increased cross-selling.
The process of migrating and consolidating the data after a merger or acquisition is a huge task—one that is often underestimated. IT organizations must deal with unknown systems, resolve quality issues, and provide detailed documentation of how the information has been merged. The task involves much more than technical integration. Not only must IT organizations reconcile different data definitions and models, but processes must be put in place to ensure alignment of the various entities. A data governance framework provides significant value in managing the organizational and technical complexities of M&A consolidation and accelerating positive business results.
Partnering and Outsourcing
Another broad market trend is the increasing use of partners and outsourcers to manage parts of the value chain. Organizations are focusing on core competencies and handing off non-core functions and processes to partners and outsourcing providers. Here are some examples:
• High-tech equipment companies rely on contract manufacturers for production.
• Manufacturers turn to UPS and FedEx for logistics and warehouse management.
• Pharmaceutical companies rely on third-party clinical trials management firms.
• IT departments outsource application development and network management.
• HR groups outsource administrative functions such as payroll or benefits management.
As business processes and IT systems shift to outside providers, the data associated with those processes and systems is relocated outside the boundaries of the organization. Organizations must ensure that the data is correctly migrated to the outside provider. The data must be complete and accurate, and it has to be restructured to work in the third-party system. It is important to note that although the data has been moved to a third party, it remains a core asset of the organization. Even though it sits outside the firewall, the organization cannot relinquish visibility into and control over that data. A data governance framework is critical to managing data that is fragmented across the extended value chain, especially when it comes to defining the standards and processes for interaction and collaboration with external partners and outsourcers.
Ideas for Where to Start and How to Prioritize
We just outlined some of the business drivers for institutionalizing data quality, but with the inventory of existing quality problems, how does one prioritize what data to correct and what to ignore?
First off, as we’ve already said, Lean thinking means fixing problems when they are identified. An organization may have many data quality problems that are not formally identified or may be covered up by manual processes so that they are not visible to senior management. Business priorities drive data quality priorities. Don’t try to resolve data quality problems if you can’t develop a fact-based justification to do so. While this seems obvious, it is important to keep in mind.
That being said, what can be done to be proactive about improving the quality of data that will benefit the business? One technique that many organizations have used is to identify, define, and track the quality of the “golden elements” that drive the business. These are the business terms, metrics, or database fields that the business feels are most critical for efficient operations and solid business decisions.
Typically, it is useful to limit the number of golden elements to 50 or so, and then group these elements into subject areas or categories. Obviously, there are tens of thousands of potentially important data elements, and different sectors of the business will have their own lists, but the key concept when getting started is to pare the list down to several dozen to keep this problem manageable, as we demonstrated in the Smith & Nephew case study in Chapter 6.
But even limiting the elements or subject areas typically does not help to prioritize the quality problems fully enough to make the problem manageable. There can be millions of customers, hundreds of thousands of SKUs, or tens of millions of orders. For that reason it is necessary to tie information about problem records to the importance of those records (How much business have we done with that customer? How many places do we use that part? Is that order information recent and sizable?) in order to focus on fixing the important records in the midst of the totality of records that have problems.
Stop the Line: Using Andon and Visual Management
At Lean manufacturing companies, andon lights are used to “stop the line” when problems are identified. Any individual on the line can “pull a cord” that causes that station’s number to light up on a board. This immediately notifies the team leader, who helps to fix the root cause of the problem. This low-tech communication system is useful in a manufacturing environment to bring real-time attention to quality issues.
The corollary to this for integration is the data quality scorecard or dashboard. As data problems are identified by business rules against the data records of the golden elements, the magnitude of these problems is visually highlighted on a computerized data quality dashboard for business owners to see. On these scorecards, users can click into the dashboard to either fix the underlying problems or work with IT either to determine a root cause to be fixed or to validate the data upstream.
Creating a scorecard that highlights quality issues is extremely effective at involving the business in the data quality improvement process. This dashboard or scorecard of the golden elements not only engages business managers in the process of fixing the underlying data, but it also creates friendly competition in the process. No business unit wishes to have lower quality scores than other business units. Using friendly competition is helpful in motivating the business to get involved in playing its critical role in data quality improvement.
But the scorecard is not just for scoring and motivation; it is also intended to keep front-line staff and business users focused on what is most important. As we mentioned, the number of potential problems that the business could be asked to help fix is literally limitless. Therefore, having a scorecard helps keep IT and the business aligned and focused on the same things.
Identify Problems as Early as Possible
A common cause of cost overruns in integration projects is identifying data quality problems too late in the project cycle. The best way to resolve this is to profile the characteristics of the data early in the life cycle of every integration project. Dealing with data quality problems or with complex matching and joining problems is extremely time-consuming. Therefore, including this task early in the schedule will set expectations properly. Frequently, when we have seen projects run late because of data issues that were discovered in the integration testing phase or user acceptance testing phase, and we asked whether the data had been analyzed up front, the answer was “No, not really.” Profiling data late in the project cycle results in a tremendous amount of rework and wasted time and effort.
As data is profiled, rules are uncovered, anomalies are discovered, and patterns emerge. Do not waste the profiling opportunity to begin documenting what is discovered during this early stage before the project gets under way.
Make Business Involvement Simple
For all the vast amounts of data that exist, computers can be brought to the rescue for only certain parts of the problem. For example, matching algorithms, address cleansing, and so forth can eliminate a tremendous amount of waste and do certain repetitive things more accurately than humans. Because these types of quality issues are so frequent and so time-consuming, it is important to bring automation to bear to improve quality.
On the other hand, fixing other quality issues requires a business analyst’s eyes and insights. Frequently, data records that do not pass quality controls are copied to files that IT puts into spreadsheets for the business to fix. Manual approaches like this, while hardly ideal, can get the job done but are quite difficult to manage in complex projects with large amounts of bad data.
A leaner approach is to create a simple Web-based user interface where the business users can fix data problems and/or consolidate potentially matching records. Connected to the visual management or dashboard user interface, this approach is designed to get each business user to participate in the data quality improvement process simply and easily. Not only can the business user alter problem data directly in a staging area, but governance of this process is improved because IT and/or other business users have the ability to audit the changes prior to updating the production systems.
There are massive numbers of data issues in virtually all large enterprises. Priorities must be established, data must be examined, rules for determining good versus bad data must be set, and then the process of fixing the high-priority data records must be streamlined and made as easy as possible. The Lean approach to data quality means automating the collaboration between business and IT, using visual management, automating workflow, using automated algorithms, and identifying and fixing data quality problems as early as possible. Data quality has a tendency to degrade over time in a similar fashion to the natural tendency toward entropy in nature. Unless forces are brought to bear on improving data, data quality will get worse. Data quality does not improve on its own.
Integration Quality
Integration quality, as we have said, refers to the quality of the software services, workflows, processes, transformations, and other logic that control the movement and integration of data. While much has been written about improving quality in the software development life cycle, we will focus on approaches to building quality into integration code in ways that eliminate significant waste in the integration process.
When we discuss code in the integration space, we mean all software, business rules, and systems required to access, transform, cleanse, and move data to and from business applications and users. This includes Web services, integration mappings, SQL, Java, COBOL, stored procedures, and the plethora of other code that is written, either by hand or with graphical and metadata-driven integration platforms. This code represents the integration points between applications in the enterprise system-of-systems. Building quality into the development and continual change of this code goes a long way toward eliminating waste.
The Five Ss: Create a Workspace Suitable for Visual Control
When Japanese companies adopted Lean production, one of the tools they used was to clean up their environments so that problems would be more visually identifiable. They developed what they called “5S programs” that comprised activities for eliminating wastes that contribute to errors and injuries. Here are the five Ss:
1. Sort (seiri): Separate needed items from unneeded items. Throw away the unneeded items.
2. Straighten (seiton): Arrange and identify items for ease of use and visual accountability: “A place for everything and everything in its place.”
3. Shine (seiso): Cleaning the environment is an effective form of inspection that reveals problems that could hurt quality or future failures.
4. Standardize (seiketsu): Create the processes to maintain and monitor the first three Ss.
5. Sustain (shitsuke): Make the previous four Ss a habit. Develop the discipline to make this an ongoing process of self-improvement.
What Japanese companies found was that without these cleanup procedures, waste accumulates over the years and covers up the underlying problems. The more these wastes accumulate, the more difficult they are to clean up in the future and the more likely they are to hide current or potential problems.
This is even more important in the integration environment. How much of the integration hairball is waste because of redundant and duplicate data or integration points, and how much is waste because no one is using the integration anymore? With the rapid growth in complexity of the IT environment, constantly cleaning and refactoring it is a crucial exercise that can promote higher quality in several ways. First, a clean virtual environment can increase pride in the workplace; developers and administrators are less likely to foul the system if they find an environment where visually all items have their place and everything looks tidy and understandable. Second, developers will be able to more quickly understand the environment, allowing them to learn and be productive more quickly. And most important, excess code bloat and complexity can be removed, making the entire environment more understandable and supportable over time.
The five Ss can be applied to the virtual world of software by making the integration environment clean and organized, stripping unnecessary complexity from systems, and allowing people to manage the environment more efficiently.
1. Sort: Sort through the services, business rules, mappings, workflows, adapters, queues, parameter files, and other objects to identify those that were never deployed or are no longer used. A general rule of thumb is that 25 to 50 percent of the integration infrastructure in most Global 2000 companies is waste (unless the organization has already applied a rigorous simplification initiative). As part of this process, create queries or reports that can be rerun in the future to continually maintain the freshness of the environment by identifying the deadwood easily.
2. Straighten: Are the items organized into projects, folders, or categories, or tagged in a way that will allow them to be easily found by the people who need them? In particular, in the integration space, it is highly useful to organize the same objects in multiple ways. For instance, sometimes it is useful to see objects organized by project. Other times it might be useful to see things organized by the system or subject that they access. And at still other times you may want to see code organized by the business function that is relevant to that code. In other words, some kind of tagging or flexible organization capability, as well as a powerful search and metadata reporting capability, is extremely useful in being able to flexibly organize objects so that they can be found and interpreted easily.
3. Shine: Shining the integration environment can mean resolving test case failures and improving the test coverage. Improving operational performance, resolving outstanding defects, and enhancing monitoring and error-logging features of integration objects are further examples of shining.
4. Standardize: Create a series of reports that are run on a schedule to identify items that do not follow the standards or are the deadwood in your environment. Implement continuous improvement activities to refactor existing integration components that do not conform to standards.
5. Sustain: Create a process where users are excited to think of new reports or queries to ferret out other problems on a regular basis.
Defining and Enforcing Standards
Standardized work is one of the most powerful countermeasures to quality problems. By limiting variance and promoting best practices, standards help integration developers “get things right the first time.” Standards help to improve predictability, in that different developers will solve similar problems in similar ways. Here are some examples of standards in an integration environment:
• Standard approach to tool choices for integration projects
• Standard processes for the integration development life cycle
• Naming conventions
• Canonical data models
• Object organizing standards (folder structures, categories, tags, etc.)
• Use of integration patterns and common data definitions wherever possible
• Deployment and configuration management processes
• Security standards
The recommended way to promote standards is to make them easy to find, understand, and use. To some degree it is possible to force (push) people to use standards, but a more effective and sustainable approach is to pull everyone to the standards by making them easy to follow. Many organizations maintain these standards prominently on the ICC Web site or make them available from the Help area of the different integration tools in order to keep the information close at hand for the people who need it, where they need it.
As part of defining standards, you must also define how to measure compliance. For example, you could create queries against the integration environment that deliver reports on the number of items that don’t conform to the standards with the ability to drill into those numbers to find the offending items. Running these reports on a daily basis against the development metadata is an important part of monitoring whether people are adhering to the standards and limiting the variation, complexity, and waste of the integration environment.
Some developers see standards as rules that restrict their creativity. One of the best ways that organizations have found to overcome this concern is to keep these standards undergoing continuous improvement with the involvement and input of all the developers and architects. Most developers don’t mind the concept of standards if they participated in their evolution, or if they know about the standards before they do their work. Usually, developers balk at following standards when the standards dictate a way of doing things that is different from either what they are used to or what they think is most efficient. Whatever the reason, going back to the team empowerment principles provides the best foundation for getting developers on board.
Code Reviews
One of the most common refrains we hear from ICC managers is that their team is always behind in reviewing the integration code of the different project groups. In other words, there is a huge inventory of yet-to-be-reviewed integration code. In order to fix this problem, think Lean. Think “flow” rather than “batch.” Batching up lots of code for a seemingly more efficient review process creates the major obstacle of finding the time for team members to participate in heavyweight batch review sessions, causing review inventory to back up even further.
To change the approach from batch to flow, we suggest following a “pairing” approach throughout the development process. Pair developers so that they are learning, reviewing, and problem-solving each other’s code. Building this into the flow of the integration development process is significantly more efficient and workable than the traditional code review approach. Even when a pair is geographically separated by distance and time zones, viewing review as a constant process rather than a periodic process helps to keep review inventories low and to keep developers on task.
Another benefit of mass customization and automation is the familiarity of the integration logic for review. Leveraging configurable reusable objects means that the core of the service or mapping or data flow will be familiar—only the specifics that deal with the data peculiarities will be different. This is where the time should be devoted in any event. The efficiency of the review process can be significantly enhanced by following other Lean principles as well. This improves quality and makes the review process smoother and more effective.
Automation of Quality Testing
Automation can provide tremendous efficiencies in the testing of integration code. Traditionally, this has been an extremely manual process, involving writing SQL or visually examining before and after data to ensure that the logic is working properly. In the Web services area, utilities for testing individual services with test messages have been in use for a number of years. When large, complex integrations involving data from multiple systems must be tested, the lack of testing automation makes validation extremely time-consuming and error-prone.
However, this situation has been changing, and we are entering a new era of software maturity. As we said in Chapter 9, this is a perfect time to “use the computer.” Some start-up companies have begun to create products that address this area. These tools work by allowing the QA engineer to define the before and after data tests against the before and after data images and automatically highlight the anomalies. This approach is somewhat similar to data profiling, except that it compares the data sets in a way that uses the computer to mine lots of data rather than requiring a human to find the defects in the integration code.
For instance, keys can be compared across large data sets to ensure that they were either generated or resolved properly. Automated tests can identify orphan records, duplicate records, and missing records. Certainly, these are the kinds of checks that QA engineers have been manually creating for years, but the ability to automatically add these to a regression test harness as the tests are being developed, and then to re-execute these tests on periodic schedules in the future, takes the QA environment to the next level of maturity.
What frequently happens when integration projects fall behind is that testing becomes a manual process rather than a more automated process. To be Lean and to work both more efficiently and more effectively, turning human manual testing into automated testing early in the process enables flow. The breakthrough with these new software approaches is that it is faster to perform testing in this automated query-and-comparison environment, while automatically constructing the regression test suite. The end result is that you are able to make changes in small batch sizes and flow them to production with often up to 90 percent reduction in lead times.
Make Quality Issues Visual
In addition to the five Ss, another practice we can learn from the Lean principle of “building quality in” is visual control. Many integration environments have used dashboards to show the behavior of the operational integration environment. Earlier in this chapter we wrote about how many companies have used scorecards to track and improve data quality. Organizations should use the same andon approach to improving integration quality as well. Display the summary of the reports that track waste in integration artifacts on an integration quality dashboard. What objects are not following standards? What objects are performing most poorly? As with data quality, one of the best ways to get people involved in the continual improvement process is to make the important process metrics visible.
As has been demonstrated by many data warehousing projects, significant numbers of data quality problems don’t surface until people actually look at large amounts of data. Similarly, metadata quality problems don’t surface until metadata is made visible. In the same way, standards issues don’t surface until nonstandard objects are made visible.
Visual controls are yet another action that organizations can take to tame the integration hairball and transform it into a well-managed and efficient integration system.
Case Study: Building Quality In at a Utility Company ICC
With over 18,000 employees across approximately eight states, Good Energy (our made-up name to disguise the source) is a large power company in the United States Midwest, offering a diverse mix of energy- and power-generating resources, including nuclear, coal-fired, oil- and natural-gas-fired, and hydroelectric power plants. The company supplies and delivers energy to 4 million U.S. customers and also has operations in South America.
Good Energy began considering a change in how to achieve “one version of the truth” in 2005. Up to that point, data was integrated across the company in a variety of ways without a consistent approach. The enterprise data integration challenges caused a number of issues for the company, including
• High cost of integration due to a lack of standardization on enterprise class tools
• High cost of IT maintenance due to project silos producing a high degree of variety
• Difficulty integrating systems from acquired organizations
• Inconsistent data models leading to a lack of a “single view” of transactional data
• Reporting models tied to source systems that made changes to such systems very difficult
• Poor data quality in terms of consistency and accuracy across functional areas
As a result of Good Energy’s analysis of its data integration needs on an enterprise level, the organization launched an Integration Competency Center in order to establish policies and procedures that would encourage best practices and reuse of existing components across its enterprise data integration projects. The ICC also built an enterprise data hub to “untangle the integration hairball” with the following objectives:
• Reduce integration costs.
• Accelerate future acquisitions.
• Eliminate IT constraints in scaling business growth.
• Establish the Good Energy Data Model and Integration Hub.
Through the Good Energy ICC, best practices, standards, and policies were subsequently implemented.
A key element of the solution is the Good Energy Data Model and Integration Hub. This resulted in a consistent definition of information applied across all business functions independent of the technology implementation and based on a sustainable integration infrastructure that separates the consolidated enterprise view from the many departmental and functional systems in a loosely coupled fashion. The Good Energy Data Model consists of 11 subject areas, as shown in Figure 10.1. Each of the subject areas has a responsible data sponsor, data steward, and IT hub owner.
Figure 10.1 Good Energy enterprise subject area model
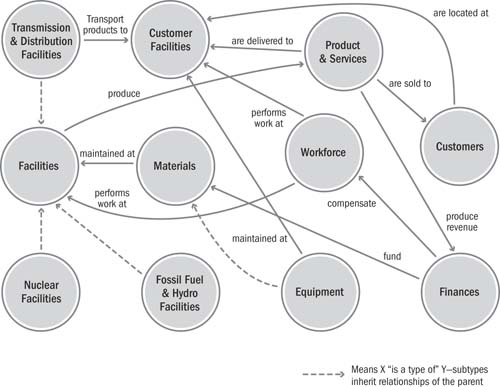
The strategy the ICC selected was to treat each of the subject areas as an “application” and implement them in a centralized integration hub. The core purpose of the integration infrastructure was to maintain the consolidated enterprise view by collecting and synchronizing data across operational systems, and to do so in a loosely coupled fashion so that individual applications could change with little or no impact on other applications.
The ICC used a continuous improvement philosophy to build out the integration hubs. Specifically, several key governance touchpoints were established to ensure that as business-driven projects were executed, the necessary hub interfaces were developed.
The key process touchpoints included the following:
1. The project team modeled data for the hub environment:
a. Identified data for the systems in scope for the project
b. Defined entity-level relationships and distinguishing attributes
c. Received approval of the model by the enterprise data architect
2. Entities were mapped to subject areas:
a. The project data architect reviewed the subject area model and performed initial mapping.
b. Both the model and the mapping were reviewed in a joint meeting with the data stewards (to resolve ambiguities, issues, etc.).
c. The mapping was approved by the appropriate data stewards.
3. Integration analysis was performed:
a. Identified data requirements, sources, targets
b. Designed a preliminary integration plan (ETL, messaging, Web services)
c. Received approval by the project
4. Information delivery requirements were finalized:
a. Identified information and end-use patterns
b. Designed the preliminary data mart and reporting plan
c. Received approval by the project
The benefits of this integration strategy have been significant. For example, the HR system went from 50 integration points with other applications across Good Energy down to 1. All the information that needs to be shared with other applications or for consolidated reporting is sent to the hub. Everyone, or every system, that needs HR data simply obtains it from the hub. This has resulted in a number of business benefits, such as increased performance of the HR system since it is not bogged down by reporting or other operational demands, and increased organizational agility since the HR system can evolve and needs to consider the impact of only 1 integration point rather than 50.