We may be able to do better by trying other features. We have a method for testing how accurate our models are. The cross_val_score method allows us to try new features.
There are many possible features we could use, but we will try the following questions:
We will also try putting the raw teams into the algorithm to check whether the algorithm can learn a model that checks how different teams play against each other.
For the first feature, we will create a feature that tells us if the home team is generally better than the visitors. To do this, we will load the standings (also called a ladder in some sports) from the NBA in the previous season. A team will be considered better if it ranked higher in 2013 than the other team.
To obtain the standings data, perform the following steps:
- Navigate to http://www.basketball-reference.com/leagues/NBA_2013_standings.html in your web browser.
- Select Expanded Standings to get a single list for the entire league.
- Click on the Export link.
- Save the downloaded file in your data folder.
Back in your IPython Notebook, enter the following lines into a new cell. You'll need to ensure that the file was saved into the location pointed to by the data_folder variable. The code is as follows:
standings_filename = os.path.join(data_folder, "leagues_NBA_2013_standings_expanded-standings.csv")
standings = pd.read_csv(standings_filename, skiprows=[0,1])
You can view the ladder by just typing standings into a new cell and running the code:
Standings
The output is as follows:
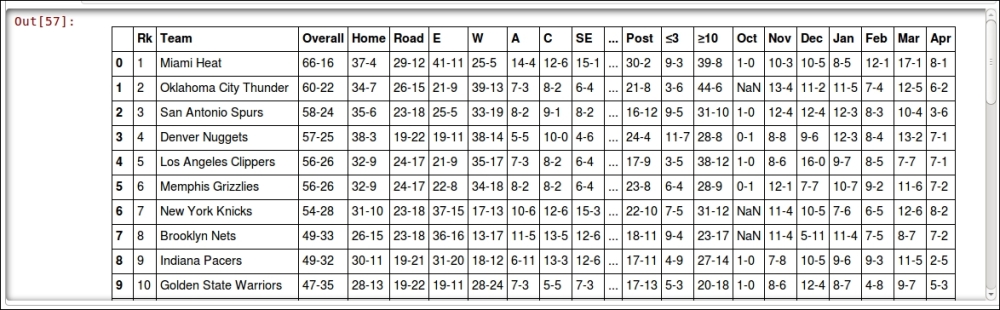
Next, we create a new feature using a similar pattern to the previous feature. We iterate over the rows, looking up the standings for the home team and visitor team. The code is as follows:
dataset["HomeTeamRanksHigher"] = 0
for index, row in dataset.iterrows():
    home_team = row["Home Team"]
    visitor_team = row["Visitor Team"]
As an important adjustment to the data, a team was renamed between the 2013 and 2014 seasons (but it was still the same team). This is an example of one of the many different things that can happen when trying to integrate data! We will need to adjust the team lookup, ensuring we get the correct team's ranking:
    if home_team == "New Orleans Pelicans":
        home_team = "New Orleans Hornets"
    elif visitor_team == "New Orleans Pelicans":
        visitor_team = "New Orleans Hornets"
Now we can get the rankings for each team. We then compare them and update the feature in the row:
  home_rank = standings[standings["Team"] == home_team]["Rk"].values[0]
        visitor_rank = standings[standings["Team"] == visitor_team]["Rk"].values[0]
        row["HomeTeamRanksHigher"] = int(home_rank > visitor_rank)
        dataset.ix[index] = row
Next, we use the cross_val_score function to test the result. First, we extract the dataset:
X_homehigher = dataset[["HomeLastWin", "VisitorLastWin", "HomeTeamRanksHigher"]].values
Then, we create a new DecisionTreeClassifier and run the evaluation:
clf = DecisionTreeClassifier(random_state=14)
scores = cross_val_score(clf, X_homehigher, y_true, scoring='accuracy')
print("Accuracy: {0:.1f}%".format(np.mean(scores) * 100))
This now scores 60.3 percent—even better than our previous result. Can we do better?
Next, let's test which of the two teams won their last match. While rankings can give some hints on who won (the higher ranked team is more likely to win), sometimes teams play better against other teams. There are many reasons for this – for example, some teams may have strategies that work against other teams really well. Following our previous pattern, we create a dictionary to store the winner of the past game and create a new feature in our data frame. The code is as follows:
last_match_winner = defaultdict(int)
dataset["HomeTeamWonLast"] = 0
Then, we iterate over each row and get the home team and visitor team:
for index, row in dataset.iterrows():
    home_team = row["Home Team"]
    visitor_team = row["Visitor Team"]
We want to see who won the last game between these two teams regardless of which team was playing at home. Therefore, we sort the team names alphabetically, giving us a consistent key for those two teams:
teams = tuple(sorted([home_team, visitor_team]))
We look up in our dictionary to see who won the last encounter between the two teams. Then, we update the row in the dataset data frame:
      row["HomeTeamWonLast"] = 1 if last_match_winner[teams] == row["Home Team"] else 0
        dataset.ix[index] = row
Finally, we update our dictionary with the winner of this game in order to compute the feature for the next time these two teams meet:
  winner = row["Home Team"] if row["HomeWin"] else row
    ["Visitor Team"]
  last_match_winner[teams] = winner
Next, we will create a dataset with just our two features. You could try different combinations of features to see if they obtain different results. The code is as follows:
X_lastwinner =  dataset[["HomeTeamRanksHigher", "HomeTeamWonLast"]].values
clf = DecisionTreeClassifier(random_state=14)
scores = cross_val_score(clf, X_lastwinner, y_true, scoring='accuracy')
print("Accuracy: {0:.1f}%".format(np.mean(scores) * 100))
This scores 60.6 percent . Our results are getting better and better.
Finally, we will check what happens if we throw a lot of data at the decision tree, and see if it can learn an effective model anyway. We will enter the teams into the tree and check whether a decision tree can learn to incorporate that information.
While decision trees are capable of learning from categorical features, the implementation in scikit-learn requires those features to be encoded first. We can use the LabelEncoder transformer to convert between the string-based team names into integers. The code is as follows:
from sklearn.preprocessing import LabelEncoder
encoding = LabelEncoder()
We will fit this transformer to the home teams so that it learns an integer representation for each team:
encoding.fit(dataset["Home Team"].values)
We extract all of the labels for the home teams and visitor teams, and then join them (called stacking in NumPy) to create a matrix encoding both the home team and the visitor team for each game. The code is as follows:
home_teams = encoding.transform(dataset["Home Team"].values)
visitor_teams = encoding.transform(dataset["Visitor Team"].values)
X_teams = np.vstack([home_teams, visitor_teams]).T
These integers can be fed into the decision tree, but they will still be interpreted as continuous features by DecisionTreeClassifier. For example, teams may be allocated integers 0 to 16. The algorithm will see teams 1 and 2 as being similar, while teams 4 and 10 will be different—but this makes no sense as all. All of the teams are different from each other—two teams are either the same or they are not!
To fix this inconsistency, we use the OneHotEncoder transformer to encode these integers into a number of binary features. Each binary feature will be a single value for the feature. For example, if the NBA team Chicago Bulls is allocated as integer 7 by the LabelEncoder, then the seventh feature returned by the OneHotEncoder will be a 1 if the team is Chicago Bulls and 0 for all other teams. This is done for every possible value, resulting in a much larger dataset. The code is as follows:
from sklearn.preprocessing import OneHotEncoder
onehot = OneHotEncoder()
We fit and transform on the same dataset, saving the results:
X_teams_expanded = onehot.fit_transform(X_teams).todense()
Next, we run the decision tree as before on the new dataset:
clf = DecisionTreeClassifier(random_state=14)
scores = cross_val_score(clf, X_teams_expanded, y_true, scoring='accuracy')
print("Accuracy: {0:.1f}%".format(np.mean(scores) * 100))
This scores an accuracy of 60 percent. The score is better than the baseline, but not as good as before. It is possible that the larger number of features were not handled properly by the decision trees. For this reason, we will try changing the algorithm and see if that helps. Data mining can be an iterative process of trying new algorithms and features.