To visualize the system metrics using Kibana, execute the following steps:
- Navigate to http://localhost:5601 and open up Kibana.
- Click on the Dashboard link found in the left navigation menu and select either [Metricbeat System] Overview ECS or [Metricbeat System] Host Overview ECS from the dashboard, as shown in the following screenshot:

[Metricbeat System] Overview Dashboard ECS: This dashboard provides an overview of all the systems that are being monitored. Since we are monitoring only a single host, we see that the Number of hosts is 1, as shown in the following screenshot:

[Metricbeat Host] Overview Dashboard: This dashboard is useful for finding the detailed metrics of individual systems/hosts. In order to filter metrics based on a particular host, enter the search/filter criterion in the search/query bar. In the following screenshot, the filter criterion is agent.name:metricbeat_inst1. Any attribute that uniquely identifies a system/host can be used; for example, you can filter based on host.hostname, as follows:

Since the diskio and load metricsets were disabled in the system module configuration, we will see empty visualizations for the Disk IO and System Load visualizations, as shown in the following screenshot:

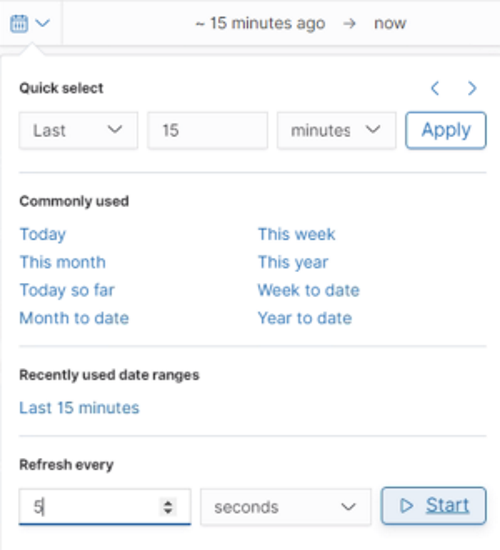
To see the dashboard refresh in real time, in the top right corner select the time and enter the appropriate refresh interval. Then, click the Start button as shown in the following screenshot: