
In this chapter, we will look at how we can use the Neo4j graph database for another very specific use case: impact analysis. All the discussions so far have led us to this discussion, where we really want to zoom in how one would practically use a database such as Neo4j for a very specific use case.
In this chapter, we are going to learn how to perform the following steps:
- Dissect and understand impact analysis systems. We will split the broader topic into two subtopics: impact analysis and impact simulation.
- Apply impact analysis to a Business Process Management use case by using a detailed demonstration dataset.
- Apply impact simulation to a cost calculation use case, using another detailed demonstration dataset.
Let's get started straightaway.
In this chapter, we will spend time with specific types of systems that will allow corporations to perform some of the most complicated operations. In some cases, their information technology infrastructure will be set up to do this, and in others this will not be the case. Analyzing and understanding their businesses in the context of its environment and the impact that the environment has on the business can be tremendously complex. Doing this, in fact, means that companies need to do two very specific things:
- They need to understand how their business will react to specific impulses from the environment or other. Assuming that they have modeled their business as a set of interdependent processes, people, and resources, it is easy to see how graph databases could be very interesting tools to better understand what would happen to the rest of the network if a part of the network changes. We call this the core impact analysis use case.
- They need to be able to simulate different potential scenarios and choose the most optimal scenario to achieve their specific objectives. This, in some sense, becomes a variation of the previously mentioned scenario, but is different in the sense that it requires us to iterate on the previously mentioned scenario many times to determine what would be the optimal end state of the business to achieve the stated objectives. We will call this the impact simulation use case.
Let's now closely examine both of these use cases in some more detail and provide specific examples of both.
In the Business Process Management use case, we will be exploring how to use graph database technology to better understand the interdependencies of different business processes and some of their key resources. This is a use case that many large organizations call Business Process Management, and is sometimes related to or part of a Business Continuity Management discipline. The idea is plain and simple: if you are a large corporation, and something happens (a natural disaster, a large-scale power outage, a fire, a violent terrorist attack, or any other majorly disruptive event that could hit you as a corporation), then it is essentially your responsibility to prepare for this. The critical step in this preparation process is to understand what depends on what, which is where Neo4j as a graph database comes in to enable that kind of understanding.
The example we will use is that of a real-world use case, which combines a number of business concepts that are structured as a graph for better understanding. The concepts are as follows:
- Business process: These are the high-level business processes that one would typically consider at a top executive level.
- Process: These are composing sub-processes that together make up a business process.
- Return to Operation Objective: Both Business processes and their subprocesses will have a maximum timeframe within which they absolutely must return to operation, in case an exceptional event would cause them to suspend operations in the first place. This Return to Operation Objective (RTO) can be anything from a few minutes to a few days.
- Business Line: Processes will be used by one or more departments or business lines, which are organizational units that should enable the corporation to achieve their objectives.
- Building: Business lines are located at a specific site or building.
- Application: Processes can use specific Information Technology applications to facilitate their execution.
All of the mentioned concepts are connected to each other, as shown in the following figure:
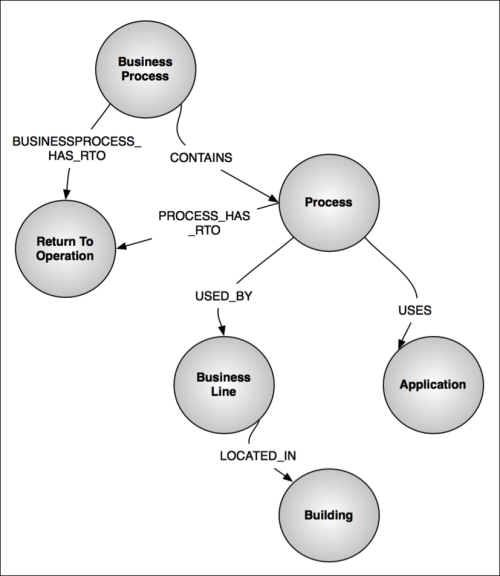
The Business Continuity Management model
We can then easily import a sample dataset into Neo4j. With a simple query, we can see how many relationships we have from a certain type to get some insight in the database:
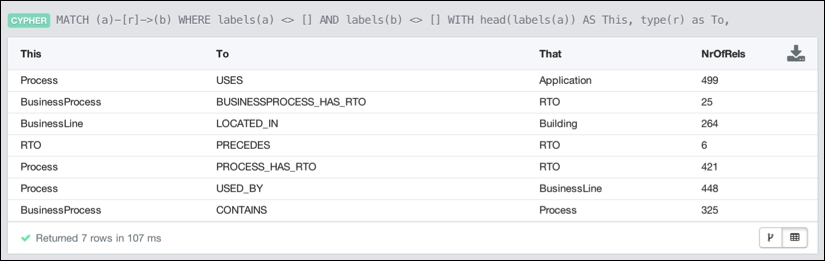
The BCM database content
The sample dataset in total has 817 nodes and (as you can see from the preceding screenshot) 1988 relationships. This is enough to ask some interesting questions that are appropriate for our use case.
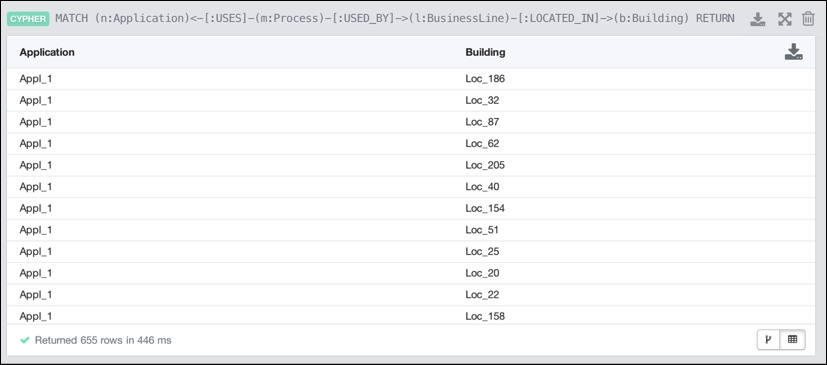
Let's say that we would like to use the graph model to determine which applications are used in specific locations/buildings of our corporation. Then, our Cypher query would look something like the following:
MATCH (app:Application)<-[:USES]-(proc:Process)-[:USED_BY]->(bl:BusinessLine)-[:LOCATED_IN]->(b:Building)RETURN DISTINCT app.name AS Application , b.name AS BuildingORDER BY app.name ASC;
Note that this is quite an expensive query to run, as it does not use any specific starting points in our graph traversals—it is a global query. However, the result comes back quickly for this dataset:
This newfound understanding of the business then allows us to better take action if something would happen to either the application or the building. Let's explore this a bit more.
This is a very local variety of the preceding query, and it answers the question very specifically for one. The application may be experiencing trouble at this particular moment. The query is similar to the following:
MATCH (app:Application {name:"Appl_9"})<-[:USES]-(proc:Process)-[:USED_BY]->(bl:BusinessLine)-[:LOCATED_IN]->(b:Building)RETURN DISTINCT app,proc,bl,b;As we have returned the nodes rather than the properties on these nodes, our Neo4j browser returns a nice graphical representation that immediately provides the required insight.
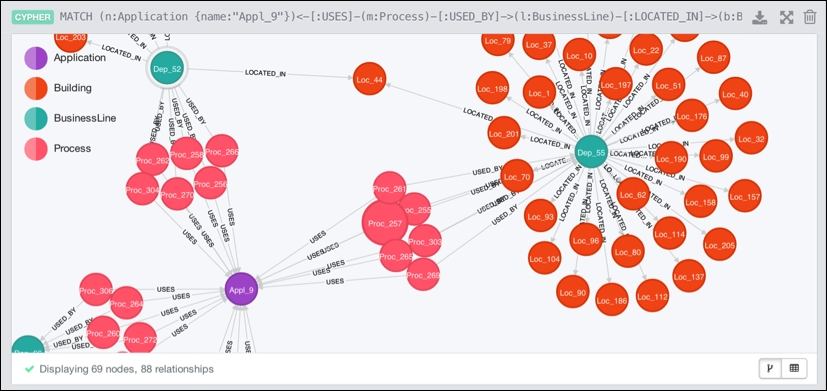
Which buildings are affected if something happens to Appl_9
Hopefully, this is a very good illustration of the use case already, but we can make it a bit more complex by including the RTO information. Let's examine one more query.
One thing you would have already noticed is that there is something peculiar about the RTO characteristic. Most people would assume that such a characteristic would become a property of the (business) processes, but in our model, we have created separate nodes to represent these characteristics and linked them together in a chain of RTO values:
- An RTO of 0-2 hours precedes one of 2-4 hours
- An RTO of 2-4 hours precedes one of 4-24 hours
- An RTO of 4-24 hours precedes one of 1-7 days
- An RTO of 1-7 days precedes one of 7-14 days
- And finally, an RTO of 7-14 days precedes on of more than 14 days
You can see this in the following browser graph. The advantage of doing this is that we can now very easily "slide" along the RTO-line and figure out "similar" or "close to" RTO targets very easily.
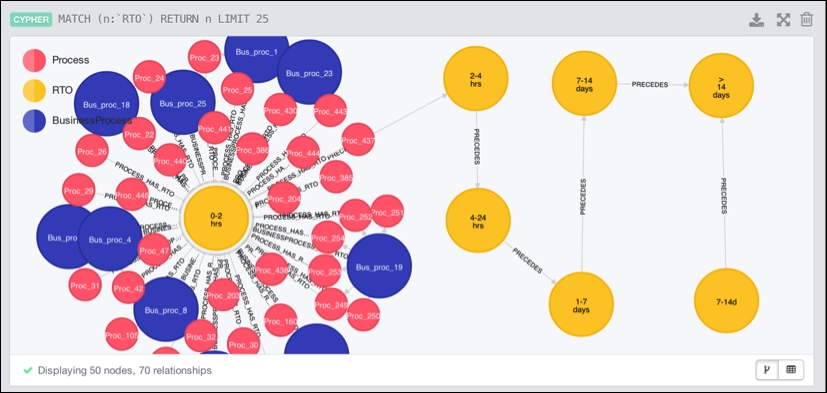
In-graph index of RTO times
So, then we can run the following query to answer the previous question:
MATCH (b:Building {name:"Loc_100"}), (rto:RTO {name:"0-2 hrs"})<-[:BUSINESSPROCESS_HAS_RTO]-(bp:BusinessProcess)WITH b,bpMATCH p = ShortestPath(b-[*..3]-bp)RETURN p;The query uses the Building and the RTO as starting points for the traversal, and then uses the ShortestPath algorithm to find out which business processes would be affected. The result is immediately clear and visible for any business user who wants to analyze the impact of this event on the business environment that the company is operating.
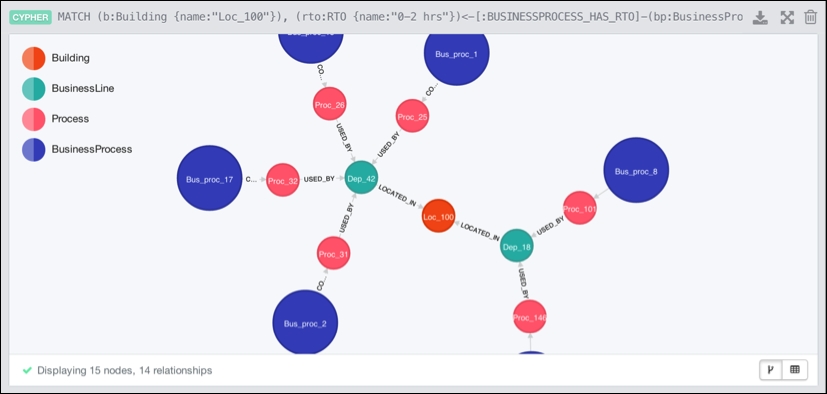
Business processes with RTO affected by incident at location
With these examples behind us, you have a good overview of how graph databases such as Neo4j can help with impact analysis systems . Now, we will explore another type of scenario that is related to this domain: impact simulation.