
Many developers that use Neo4j as their Graph Database Management System end up having some very specific needs to visualize the network and present that to their end users in an integrated way as part of their application. These Neo4j users, who are typically not afraid of getting their hands dirty with some code, will typically like to build that visualization using a library of tools that fit their purpose. There are several tools out there that could be used, so let's give you a little overview of the most popular ones.
D3, pronounced "dee three", is another way to refer to a library that is supposed to enable and provide data-driven documents. It is a JavaScript library for manipulating documents based on data. You can find the latest version on www.d3js.org. D3 helps you visualize data using HTML, SVG, and CSS. D3's emphasis on web standards gives you the full capabilities of modern browsers without tying yourself to a proprietary framework, combining powerful visualization components and a data-driven approach to the manipulation of the Document Object Model (DOM) that is the basis of HTML and XML documents.
As such, D3.js is not limited to the visualization of graphs—it aims to solve the heart of many data visualization problems: being able to manipulate a dataset interactively based on some kind of document. Once that is solved, the data can be manipulated independent of the format or representation, which offers great flexibility and has made the D3 libraries very popular with developers, and which is why many other libraries are built on top of it.
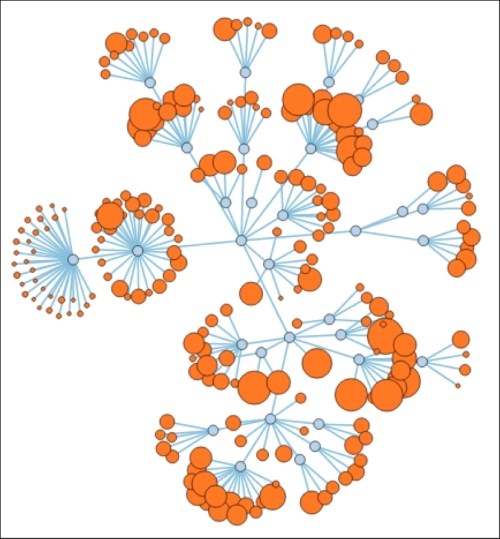
D3 visualization of a graph
Graphviz is an open source graph visualization software that you can download from www.graphviz.org. It is often quoted as being the granddaddy of visualization software, but is still very actively used and developed. It provides several main layout programs and also features web and interactive graphical interfaces, as well as helper tools, libraries, and language bindings. The core Graphviz team claims not to be able to put a lot of work into GUI editors, but there are quite a few external projects and even commercial tools that incorporate Graphviz.
The Graphviz layout programs take descriptions of graphs in a simple text language and create diagrams in useful formats, for example, images and SVG for web pages and PDF or Postscript for inclusion in other documents or display in an interactive graph browser.
Graphviz has many useful features for concrete diagrams, such as options for colors, fonts, tabular node layouts, line styles, hyperlinks, and custom shapes.
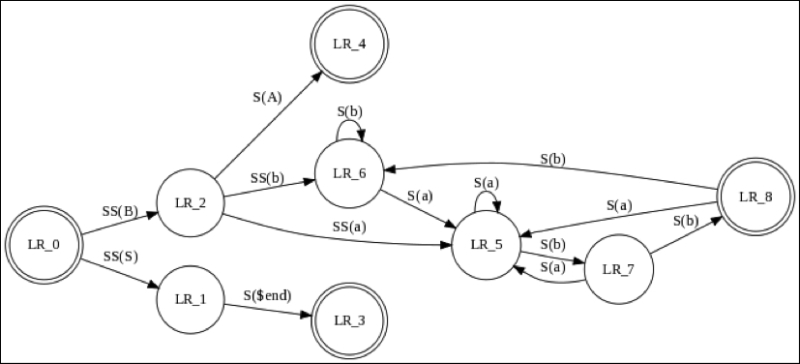
Graphviz visualisation of a graph
Sigma is a JavaScript library dedicated to graph drawing. You can find it on www.sigmajs.org. It makes it easy to publish networks on web pages and allows developers to integrate network exploration in rich web applications. Sigma provides a lot of built-in features that are optimized for modern browsers, such as Canvas and WebGL renderers or mouse and touch support. This is supposed to make network manipulation on web pages smooth and fast for the user.
Sigma provides a lot of different settings to make it easy to customize drawing and interaction with networks. And you can also directly add your own functions to your scripts to render nodes and edges the exact way you want. Sigma is a rendering engine, and it is up to you to add all the interactivity you want. The public API makes it possible to modify the data, move the camera, refresh the rendering, listen to events, and many other things. It's probably for some of these reasons that the visualization solution of Linkurio.us, which we will come back to later in this chapter, uses sigma.js under the hood.
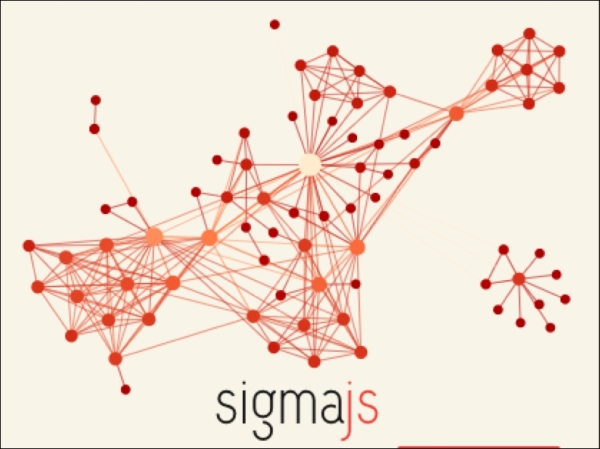
Sigma.js visualization of a graph
Vivagraph is a free and fast graph drawing library for JavaScript. It is designed to be extensible and to support different rendering engines and layout algorithms. You can download the most recent version from https://github.com/anvaka/VivaGraphJS and see some very nice demos of it at www.yasiv.com. At the moment, it supports rendering graphs using WebGL, SVG, or CSS formats. The author Andrei Kashcha is also working on a more modular and extensible library called Ngraph; you can find details of it on https://github.com/anvaka/ngraph.
Some of the vivagraph.js examples on Yasiv are a lot of fun to use, and powerfully illustrate that graphs can be used very well for things such as recommendations: it takes a split-second view of the Amazon recommendation graph to understand how one might use this. Have a look at the following screenshot:
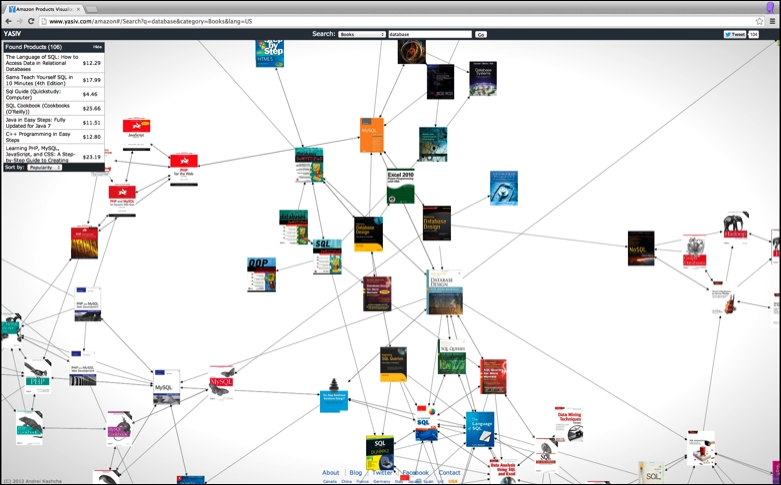
Vivagraph.js visualization of the Amazon recommendation graph
Those were probably some of the more popular open source visualization libraries out there.
Integrating libraries will always follow a similar pattern, as illustrated by the following figure:
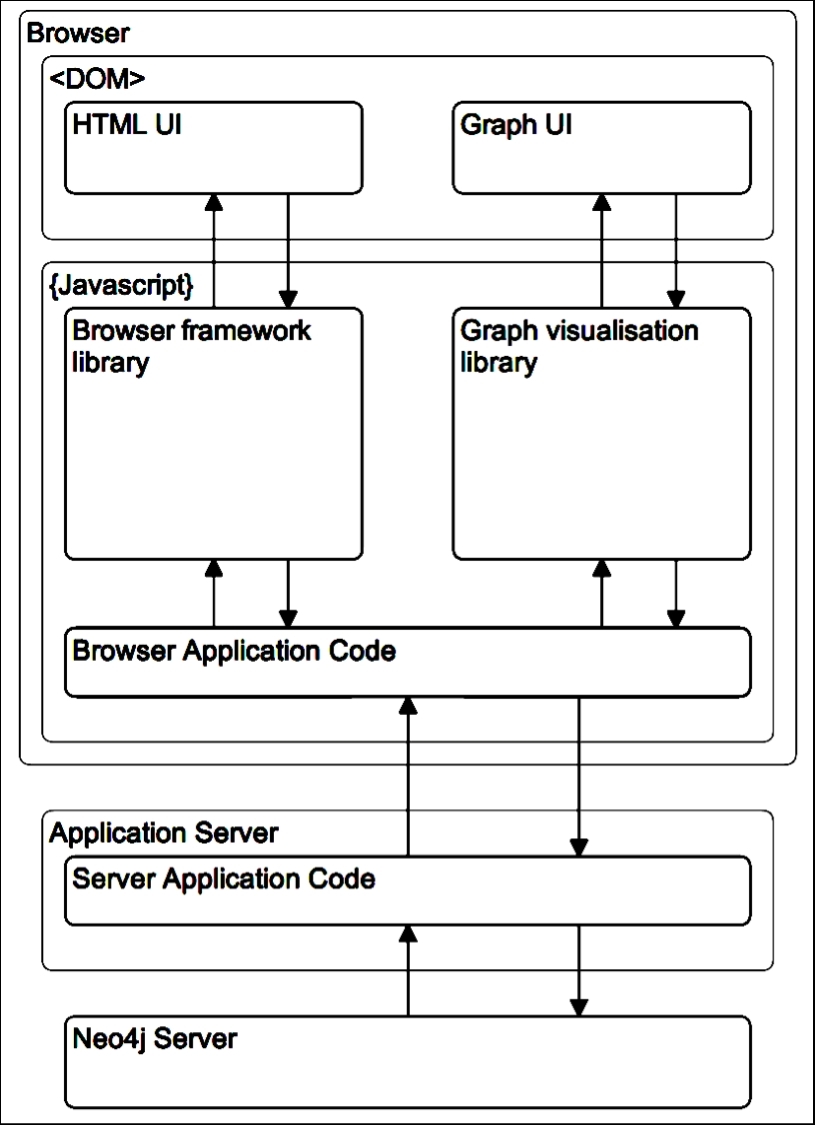
How to integrate graph visualizations in an application
The browser will contain two parts:
The application server will be on the other end of the Internet connection to provide the application interface to the user. This server will typically have some business logic hosted on it, but will most probably also have to integrate with a database management system like Neo4j.
The Neo4j server in the back will be serving up result sets based on queries generated by the aforementioned business logic.
This architecture allows us to understand how any of these libraries would need to be hooked into our application. With that, we will now turn our attention to some more packaged visualization solutions that can be used in combination with Neo4j.
We make a distinction between visualization libraries and visualization solutions for a very specific reason: they serve very different purposes.
Many members of the Neo4j user community have been developing their own application-specific visualization applications that are typically very customized. They aim to solve a very specific visualization problem, and use a library to do so, because it allows them to tweak the visualization to their liking at the expense of a bit more work.
There are, however, also those users of the Neo4j Graph Database Management System that require a more general, less optimized but more readily available visualization solution. For those users, visualization "solutions" are a better option, as they are typically readily available, off-the-shelf solutions that require little or no customization to start adding value. These are the solutions that we will be discussing in this section of our book. So, let's take a look.
Note that we will be discussing these solutions in alphabetical order; there is no preference or order displayed in these pages, as we firmly believe that most of these tools are very complementary to one another.
Gephi is an interactive visualization and exploration platform for all kinds of networks and complex systems, dynamic graphs, and hierarchical graphs. It is developed by the Gephi Consortium, a not-for-profit legal entity in France created to ensure future developments of Gephi. They aim to develop a number of tools in an open source ecosystem, focused on the visualization and analysis of large networks in real-time. Their tagline, Like Photoshop but for data, gives you a good feel of what they want to do: Gephi helps data analysts intuitively reveal patterns and trends, highlight outliers, and tell stories with their data.
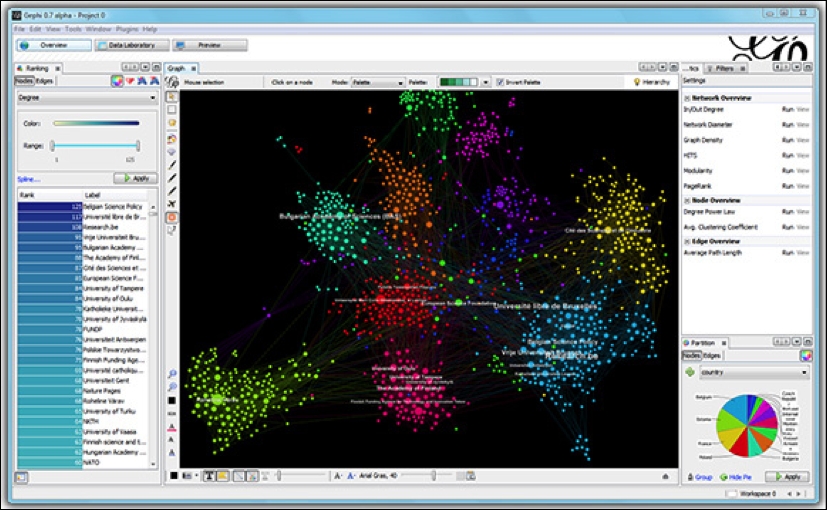
Gephi graph visualization and analysis
The toolset runs on Windows, Linux, and Mac OS X and has a very extensible architecture that, for example, allows you to import and export Neo4j databases.
What makes Gephi interesting from my perspective is its capability to do both graph visualization and, at least for small-to-medium sized graphs, graph analytics. It can be of great help in discovering new patterns in your data—even those patterns that you are currently not aware of.
UK-based startup Cambridge Intelligence (http://cambridge-intelligence.com/) has been building a very interesting toolkit for graph visualization called Keylines (http://keylines.com/) that has been gaining traction quite quickly in the law enforcement, fraud detection, counter terrorism, CRM, sales, and social network data sectors.
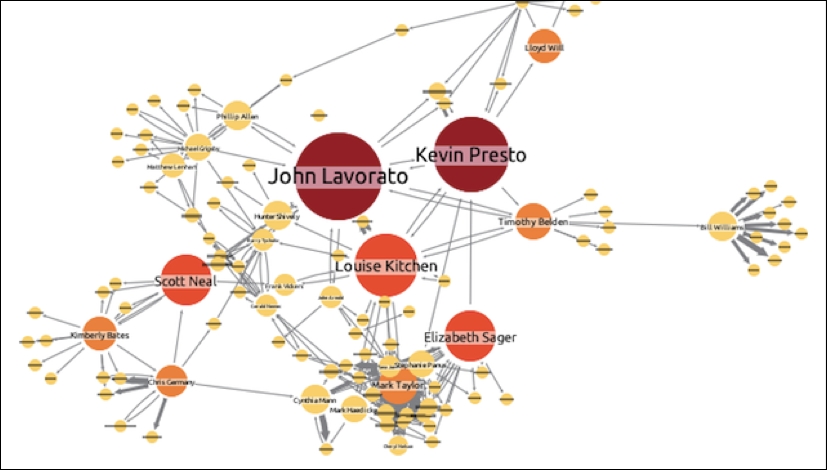
Keylines graph visualization
Keylines is interesting in many different ways from a technical perspective, mostly because it can be deployed on any browser or device without too much difference in architecture and support. It allows for both standard out-of-the-box deployment, as well as deep customization using the System Development Kit that is provided with their commercial licenses.
Linkurio.us (http://linkurio.us/) is probably one of the more interesting and newer additions to the graph visualization landscape. It was started in France by some of Gephi's original founders and contributors. They now offer a very well-rounded, moderately priced, easily accessible entry point for people that want an advanced graph visualization toolkit without having to jump through the hoops of building one.
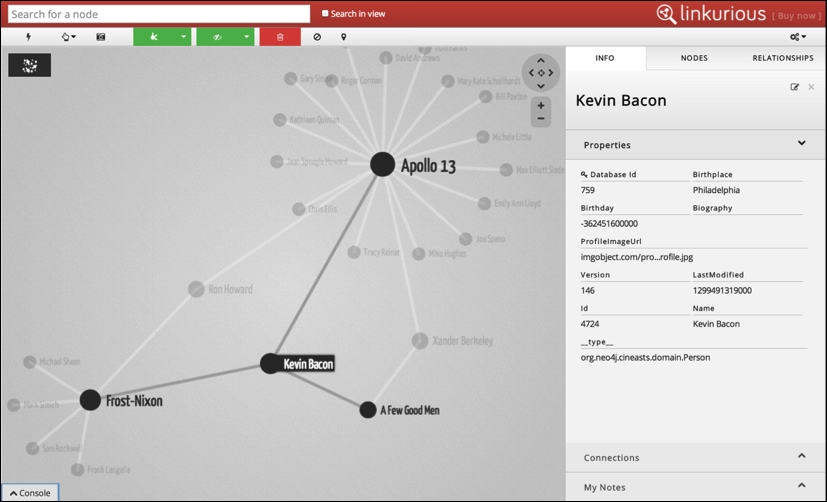
Linkurio.us graph visualization
Linkurio.us is a very nice alternative for graph visualizations, offering a packaged solution with lots of interesting features and a plug-and-play installation on top of an existing Neo4j database management system.
With the arrival of Neo4j 2.0 in late 2013, the team at Neo Technology provided an entirely new way of interacting with graph data, entirely based on an intuitive way to interact with the graph database using Cypher. This environment, called Neo4j Browser, is a bit of a hybrid between a data query tool and a development environment. It provides many of the tools that one would expect to use in an interactive exploration of graph data, allows for saving of queries and visual styling, and is gradually being expanded with more and more functionality.
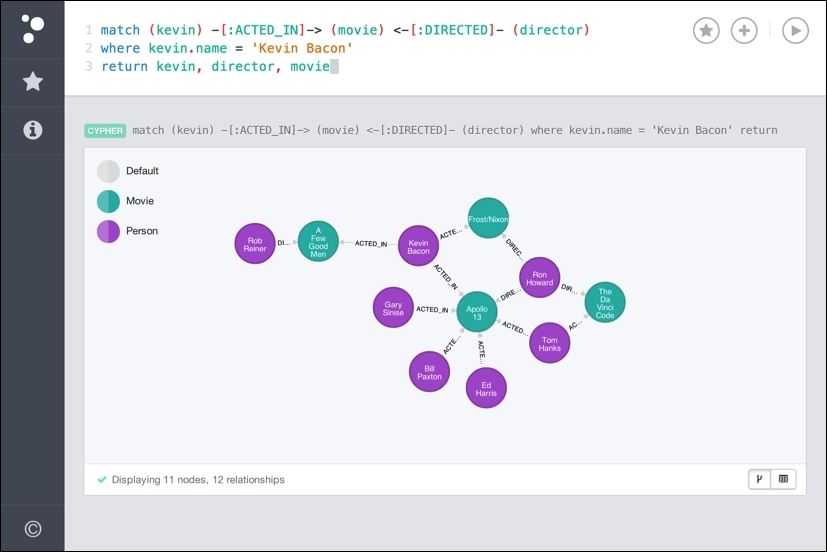
Neo4j Browser graph visualization and querying
Neo4j Browser is, at the time of this writing, still under constant development, with new features being constantly added. One of the interesting new developments now is that Neo Technology will actually allow for the extraction and embedding of browser visualization functionality into your own applications.
One of the lesser known alternatives for graph visualization, at least in Europe, is Tom Sawyer Software's Perspectives line of products. Look at https://www.tomsawyer.com for the company's website and https://www.tomsawyer.com/products/perspectives/index.php for more information on Perspectives.
This is an advanced graphics-based software for building enterprise-class data relationship visualization and analysis applications. It features a complete Software Development Kit (SDK) with a graphics-based design and preview environment that lets you build, test, and deploy graph visualizations more easily, based on a reference architecture.
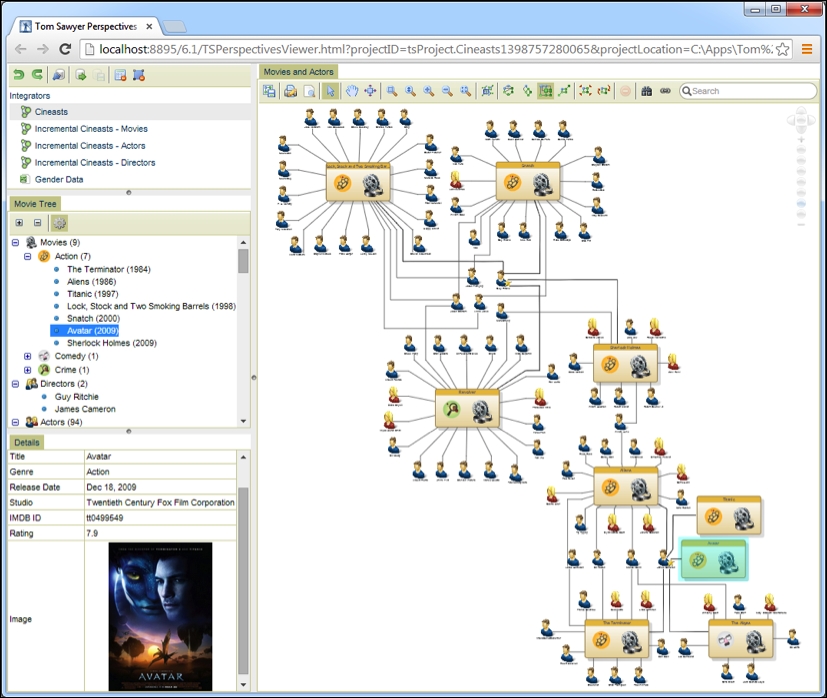
Tom Sawyer graph visualization
Tom Sawyer also offers standard data integration capabilities for Neo4j's Graph Database Management System.
With that, we are close to wrapping up the chapter on graph visualizations of this book. We do have a couple of closing remarks that we would like to add before we move on.