
The main reason to simulate a network is to try and gain some insight into exactly what a network design will yield without having to first create that simulation in the real world. Creating and running your simulation isn't enough to achieve this; you must also gather data from your simulations and create meaningful visualizations. These visualizations may show a breaking point in your design, a particular pattern, inefficiency, or anything else that suggests bad designing.
Gathering data from your network simulation is not a difficult task to do using OMNeT++. OMNeT++ is able to gather vector and scalar data and also create realistic packet capture files. To enable your simulation to gather data, you must include the following extra line in the simulation's configuration omnetpp.ini file:
record-eventlog = true
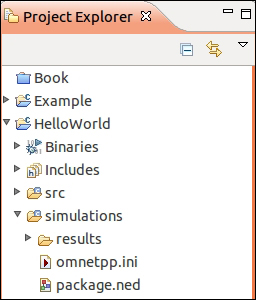
Now when you run your simulation, you'll see a folder titled Results appear in the same folder where the omnetpp.ini folder is as shown in the following screenshot:
This folder is created because the record-eventlog is set to true.
Inside this new folder, you'll see four new files and the names of these files will depend on the configuration you choose for your simulation. I chose a configuration called Scenario_One; therefore the four files are named as follows:
|
File Name |
Description |
|---|---|
|
Scenario_One-0.elog |
This file is the event log of the simulation. |
|
Scenario_One-0.sca |
This file stores scalar data that was recorded during the simulation. |
|
Scenario_one-0.vec |
This file stores vector data that was recorded during the simulation. |
|
Scenario_One-0.vci |
This is an index file for the vector file generated. This index file allows the vector file to be accessed much faster. |
Let's have a look at the event log file that was generated from running the Hello World example where Scenario_One was selected as the configuration. To open this file in Project Explorer, I double-clicked on the file. This is what the file looks like when opened inside OMNeT++:
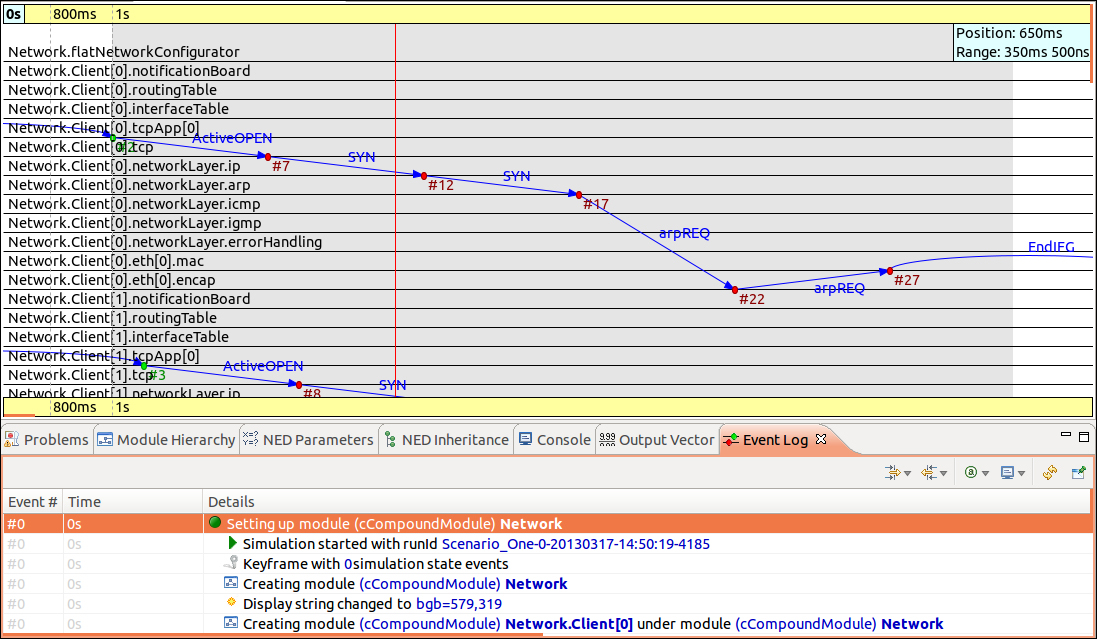
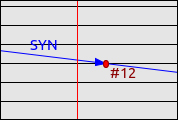
This file shows us a breakdown of every event that has occurred during the simulation. By clicking on one of the red circles in the upper part of the file, we can see a detailed list of what is happening in that particular event. I clicked on the event #12 (click the red circle) as shown in the following screenshot:
I was then taken to the event in the Event Log tab:
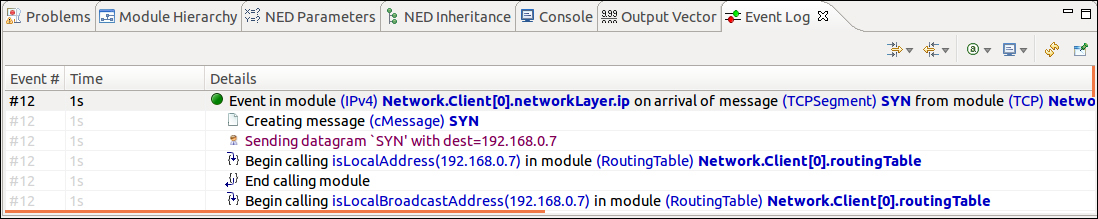
So from this detailed list, we can see that a message is sent as an SYN packet to the IP address 192.168.0.7.
You can also navigate to the event log by right-clicking inside the diagram view and then navigating to Go To | Go to Event. You will see the following dialog box:
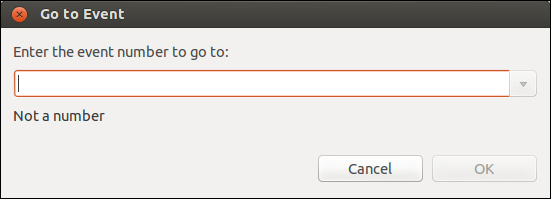
Now just type the event number you'd like to go to, then click on the OK button, and it will navigate to that event. Similarly, you can right-click inside the diagram view and navigate to Go To | Go to Simulation Time... if you wish to navigate to a particular time in the simulation instead of a particular event. If you know that your network starts behaving strangely at a certain time in the simulation, this feature is very useful in order to see exactly what is happening at that time and which events are occurring.
The other files generated are the scalar and vector data files, which allow us to create insightful data visualizations. When you double-click to open one of these files, you will see the following screenshot:
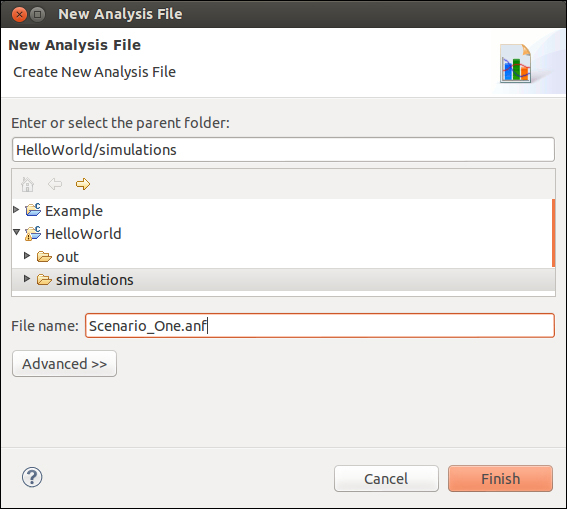
This dialog asks you to create an analysis file. To use the vector and scalar data files, you must first create an analysis file which will use all the available vector and scalar files.
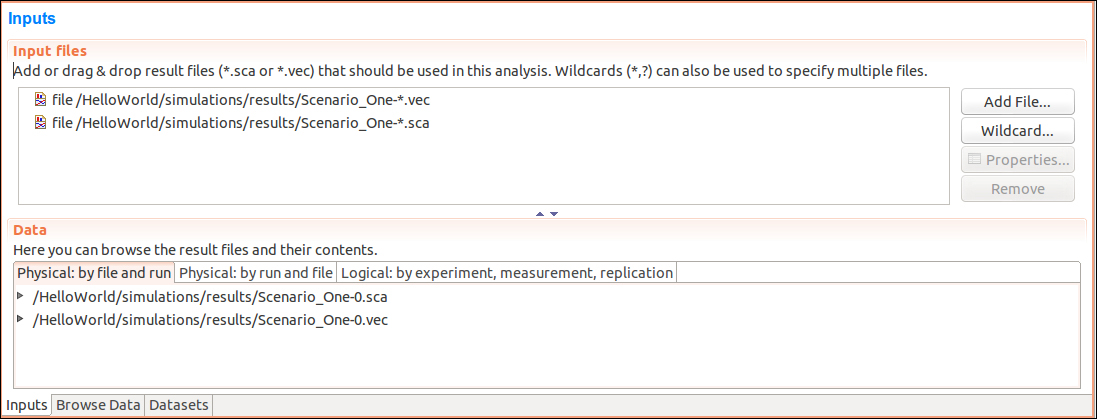
Click on the Finish button for OMNeT++ to create the analysis file for you. OMNeT++ will now open the analysis file and you will see the following screen:
Click on the Browse Data tab at the bottom and then click on the Histograms tab at the top. Now you will see a list of histograms displayed as follows:
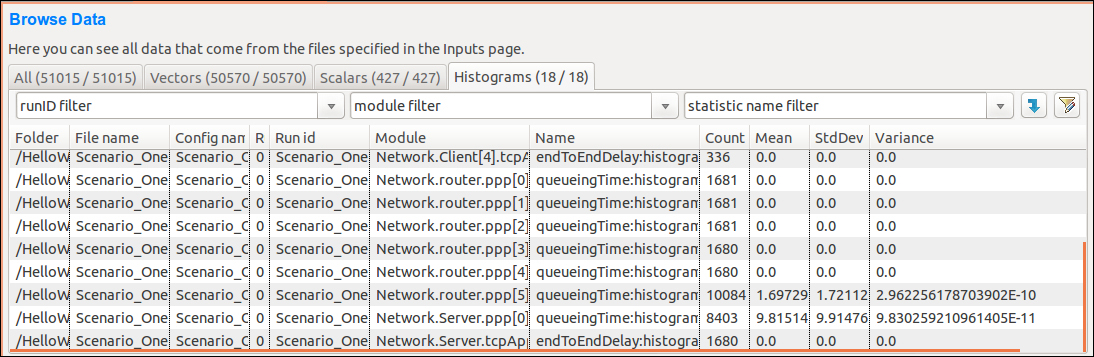
After clicking on queueingTime named dataset, I can right-click on it and then click on Plot which would show me the following screenshot:
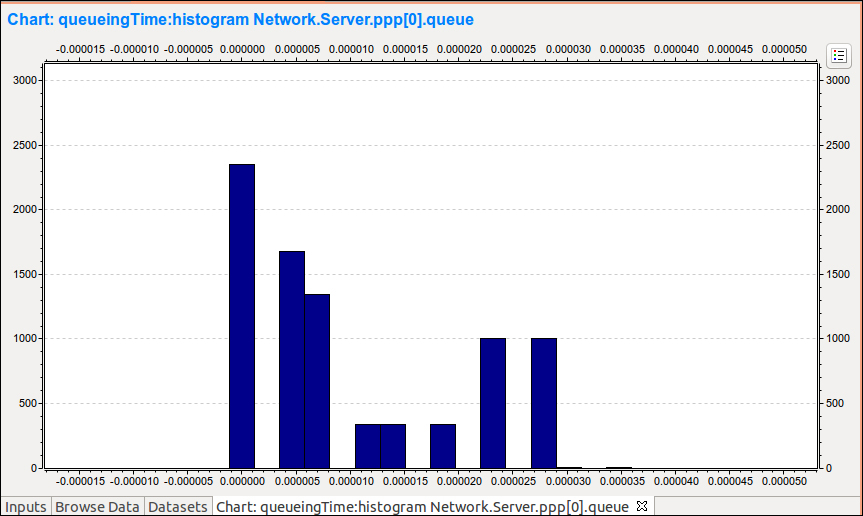
We can see how the amount in the Server queue changes over time.