
Let's use the event log to have a detailed look into the Tictoc example that we created earlier. First, modify the configuration file to contain the following new line:
record-eventlog = true
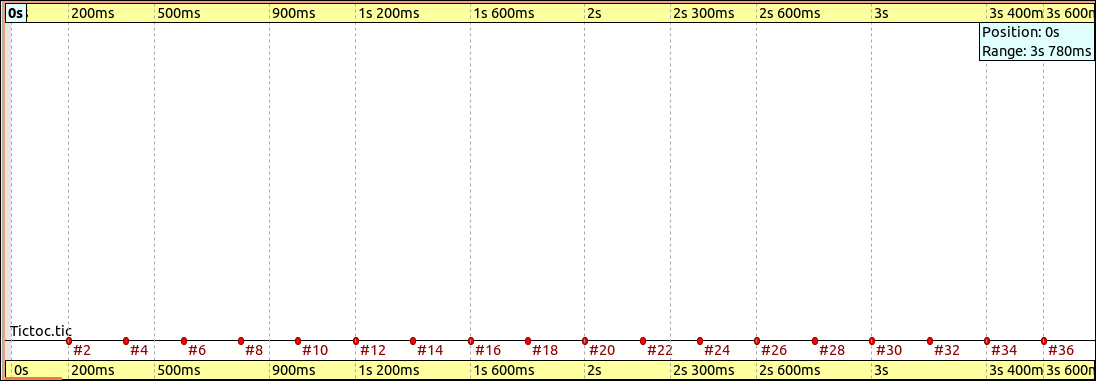
Run the simulation until at least 20-30 events have occurred. Now navigate to the Results folder and open the .elog file. You will see the following screenshot:
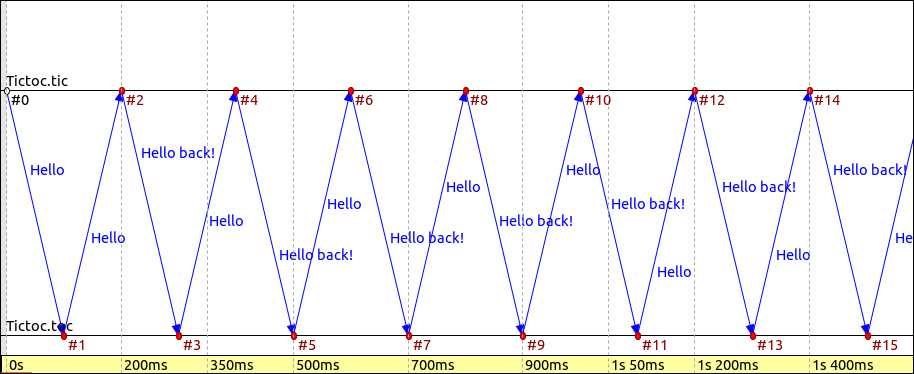
This is a very clear overview of the simulation that was run. You can see the time that has passed for each event that has occurred at the bottom in yellow. The blue lines show the messages going back and forth between the two lines named Tictoc.tic, and Tictoc.toc. We can see that Tictoc.toc always sends the message Hello and Tictoc.tic always sends the message Hello back!. When we click on an event, for example on #7, we see the following in the Event Log tab:
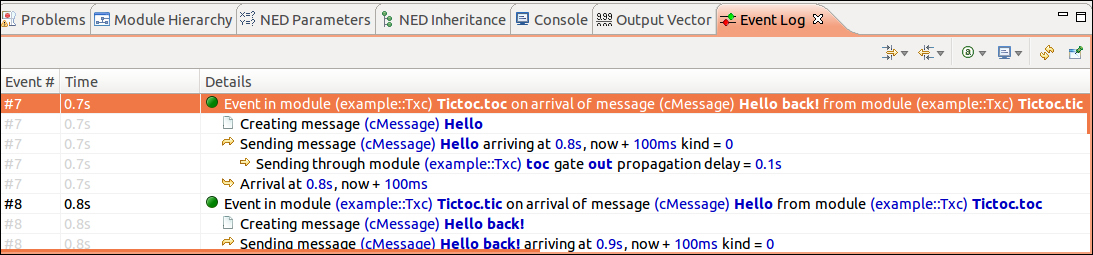
Inside the event #7, we can see a breakdown of what happens as follows:
- Tictoc.toc receives a message Hello back! from Tictoc.tic.
- Tictoc.toc creates a message Hello.
- Tictoc.toc sends the message from its
outgate with a delay of 0.1 seconds. - Tictoc.tic receives the message 0.1 seconds or 100 milliseconds after the message was sent.
This is a very pragmatic approach to analyzing your network simulation and it gives a breakdown of each event that occurs in great detail.
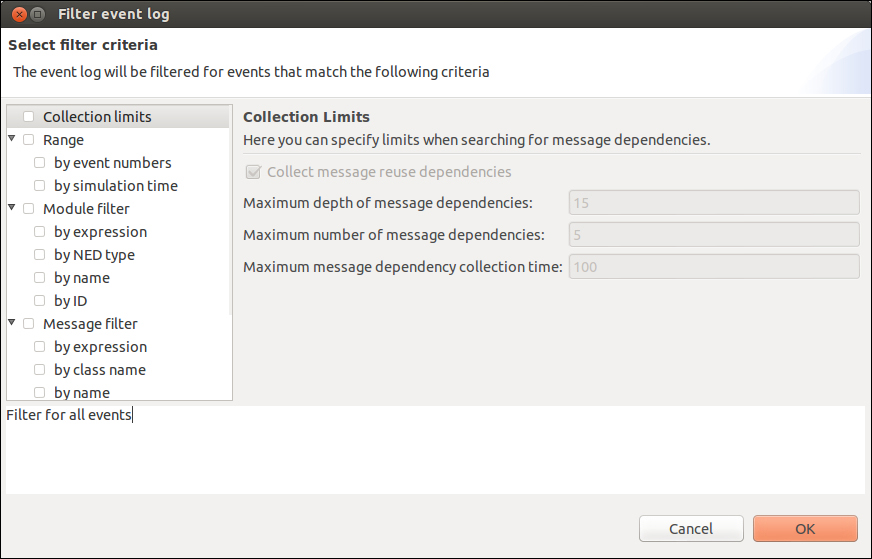
Let's now filter only the module tic in the following manner:
- Right-click on the diagram view and go to Filter | Filter event log. You will now see the following window:
- On the left of the window under Module filter, tick the by name checkbox. Now select which module you wish to filter as shown in the following screenshot:
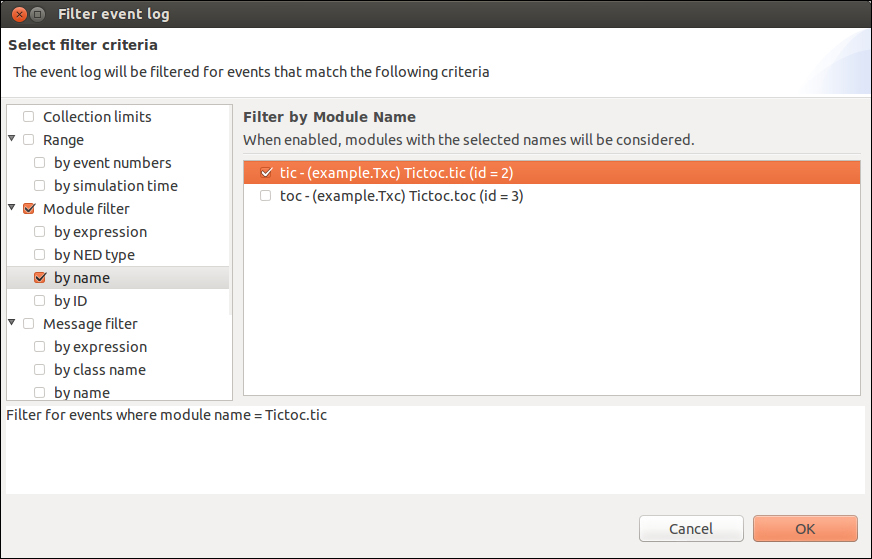
- Click on the OK button and now your event log will look like the following screenshot:
Only the Tictoc.tic events are now shown in the event log. This makes managing large amounts of data more easy as you can simply filter only what you want to see.
OMNeT++ lets you generate PCAP data. This file format (.pcap) is created by most packet capture tools such as Wireshark. The about page on the Wireshark website (found at www.wireshark.org) says the following:
"Wireshark is the world's foremost network protocol analyzer. It lets you capture and interactively browse the traffic running on a computer network. It is the de facto (and often de jure) standard across many industries and educational institutions."
When you use PCAP files to analyze your network, it will give you the same feel as analyzing a real-life network.
To allow your Hello World simulation to generate PCAP files, you must modify your configuration file by adding the following code:
**.numPcapRecorders = 1
**.Server.pcapRecorder[0].pcapFile = "results/server.pcap"
The second line of the preceding code refers to my node called Server. which means that I want to generate only PCAP files for this node. This will give a result similar to the result got by running Wireshark in real life on that server. After running the simulation, there will now be a file called server.pcap in your Results folder. I recommend you get Wireshark as the viewer for this output. Wireshark can be downloaded from the Wireshark website at www.wireshark.org.
On opening the server.pcap file in Wireshark, we see the following screenshot:
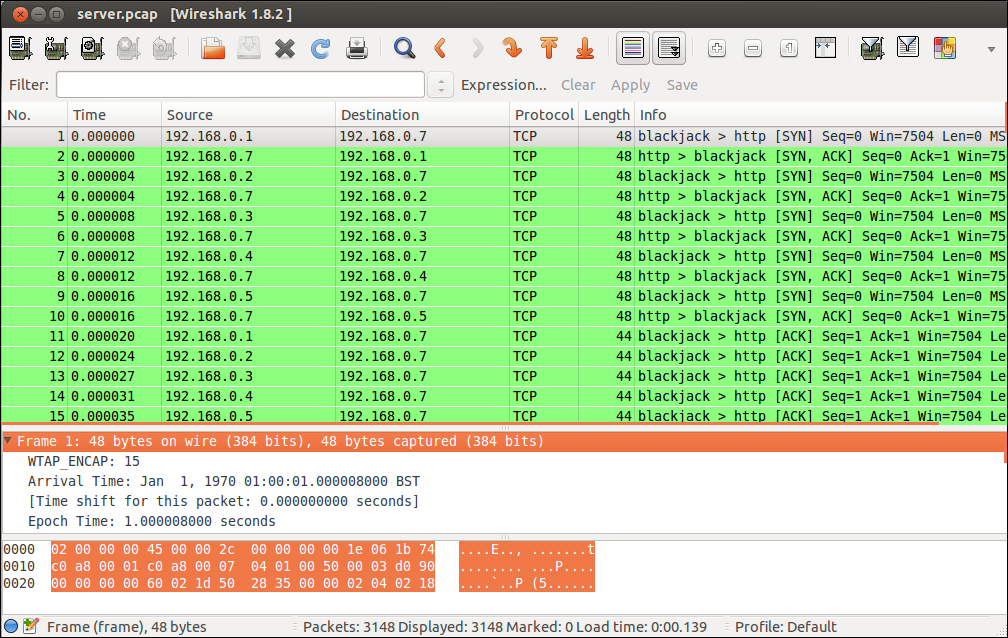
You may prefer to use Wireshark to analyze your network simulation as Wireshark is an industry standard for analyzing real networks.