
Logging is an effective means of assisting with debugging by providing visibility into variable values at various points throughout your code, and this applies whether you're working with client-side or server-side code.
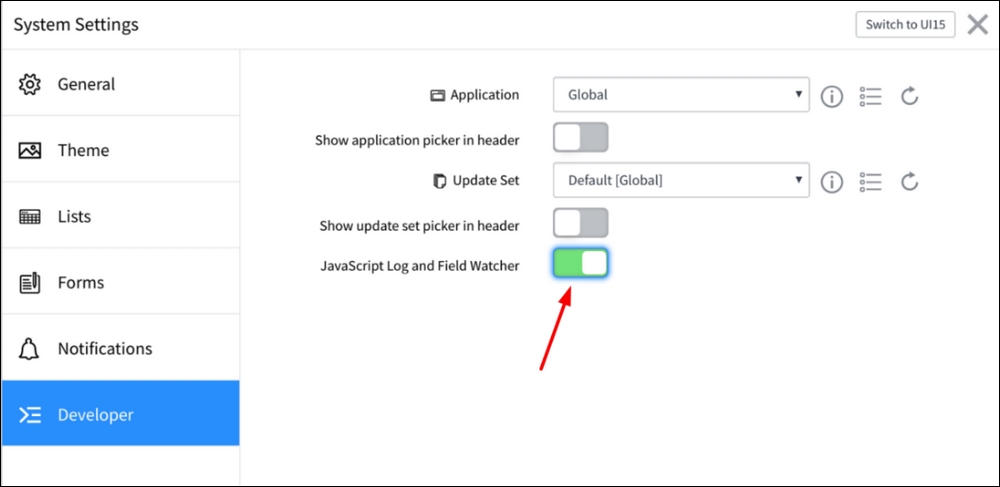
There are some troubleshooting tools that straddle the line between client-side and server-side; one of which is the JavaScript Log and Field Watcher. You can enable this tool by clicking on the System Settings sprocket at the top-right of the ServiceNow interface, going to the Developer tab, and then clicking the toggle:
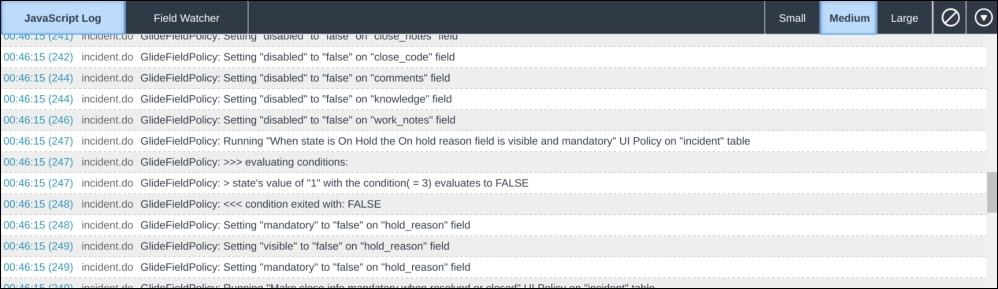
Once enabled, you may want to resize the JS Log and Field Watcher panel by clicking Medium or Large at the top-right of that panel.
When this is enabled, the JavaScript Log and Field Watcher will display at the bottom of the interface. Much of what you'll find in the JavaScript Log is what you would also find in your browser's console log, but the Field Watcher will display debugging information about a specific field you select. This can be extraordinarily useful for determining whether an ACL or business rule is impacting a given field.
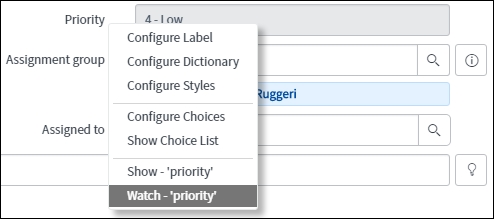
By right-clicking on a field and choosing Watch - 'fieldname', we tell the Field Watcher to pay specific attention to any operating performed on this field. As an example, let's watch the Priority field on the Incident form.
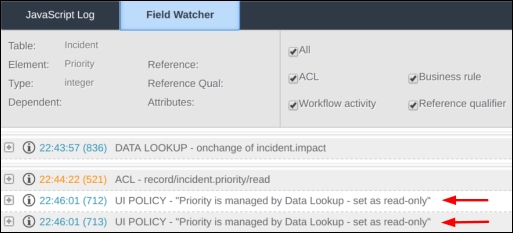
If we reload the form while watching the Priority field, we can then see some highly useful information in the Field Watcher tab, such as the name of the UI policy that's controlling whether the field is read only, as you can see in the following screenshot:
If you modify a field's value and save the form, you can even see things like the UI Policy that was triggered, the value in the watched field on submission, and so on.
While watching a field and viewing the actions performed upon it in the JavaScript Log and Field Watcher, it can be difficult to watch a field if you can't right-click it because it's hidden from the form. Instead, you can grab the field name (attainable from the table dictionary) and open up the background scripts module, from System Definition | Scripts - Background.
In a background script, you can write the following, replacing fieldName with the hidden field's name:
gs.getSession().setWatchField('fieldName'); Once that's done, simply reload the form with the field in question, and assuming the field is actually on the form and on the view you're loading, the Field Watcher will tell you what UI policies, client scripts, ACLs, or other functionality might be acting on the field.
Another way of debugging field visibility, as well as other field-level properties such as whether a field is mandatory or read-only, is to click on the System Diagnostics | Session Debug | Debug UI Policies. This will enable the glide.ui.ui_policy_debug session property. Once this is enabled, if you navigate back to the Incident form, and you'll see the results of any UI Policy Actions on the form, and when each UI Policy runs while it loads.
You can disable this debugging condition by either clicking the System Diagnostics | Session Debug | Disable UI Policies Debug, or to disable all debug conditions, System Diagnostics | Session Debug | Disable All