Chapter 10. Completing the Interaction Picture: Interaction Overview Diagrams
Ever been asked to “look at the bigger picture”? Whether you are working on a new idea or modeling in UML, sometimes it helps to take a step back from the details to get a better feel for what you are doing and the context within which you are doing it. This is the job of interaction overview diagrams; they exist to give you that big picture perspective on your system’s interactions.
Interaction overview diagrams provide a high-level view of how several interactions work together to implement a system concern, such as a use case. Sequence, communication, and timing diagrams focus on specific details concerning the messages that make up an interaction, but interaction overview diagrams tie together the different interactions into a single complete picture of the interactions that make up a particular system concern.
An interaction overview looks very much like an activity diagram (see Chapter 3) except that each of the actions are interactions within their own right. Think of each part of an interaction overview as a complete interaction in itself. If one interaction within the overview is most concerned with timing, then a timing diagram could be employed (see Chapter 9), while another interaction of the overview may need to focus on message ordering, and so a sequence diagram could be used (see Chapter 7). The interaction overview glues together separate interactions within your system in the notation that makes most sense to the particular interaction to show how they work together to implement a system concern.
The Parts of an Interaction Overview Diagram
The best way to understand a interaction overview diagram notation is to think of it as an activity diagram, except instead of an action, a complete interaction is described by using its own diagram, as shown in Figure 10-1.
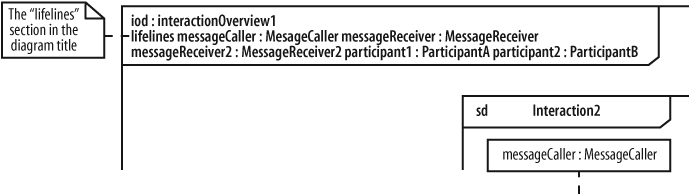
Any number of participants may be involved in the interactions that occur within the overview. To see which participants are involved across the entire overview, a lifelines subtitle is added to the diagram title, as shown in Figure 10-2.
Similar to an activity diagram, the interaction overview begins with an initial node and ends with a final node. Control flows between these two nodes and passes through each of the interactions in between. However, you are limited not to just a simple sequential flow between the interactions.
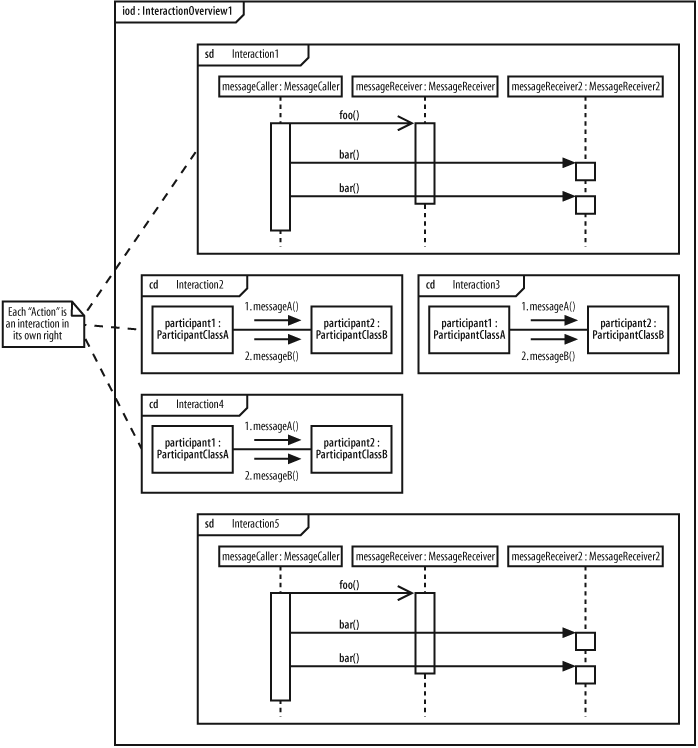
Just as control flow on an activity diagram can be subjected to decisions, parallel actions, and even loops, so can the control flow on an interaction diagram, as shown in Figure 10-3.
Modeling a Use Case Using an Interaction Overview
That’s all the new notation for interaction diagrams; now it’s time to look at a practical example. To set the stage, we are going to develop an interaction overview diagram from scratch for the Create a New Regular Blog use case reusing parts from the interaction diagrams created in the previous chapters.
The big difference between the example in this chapter and the modeling in previous chapters is that with an interaction overview, we can pick and choose from the different interaction diagram types. By using an interaction overview approach, each part of the interaction is modeled using the techniques that are most effective for that part.
Pulling Together the Interactions
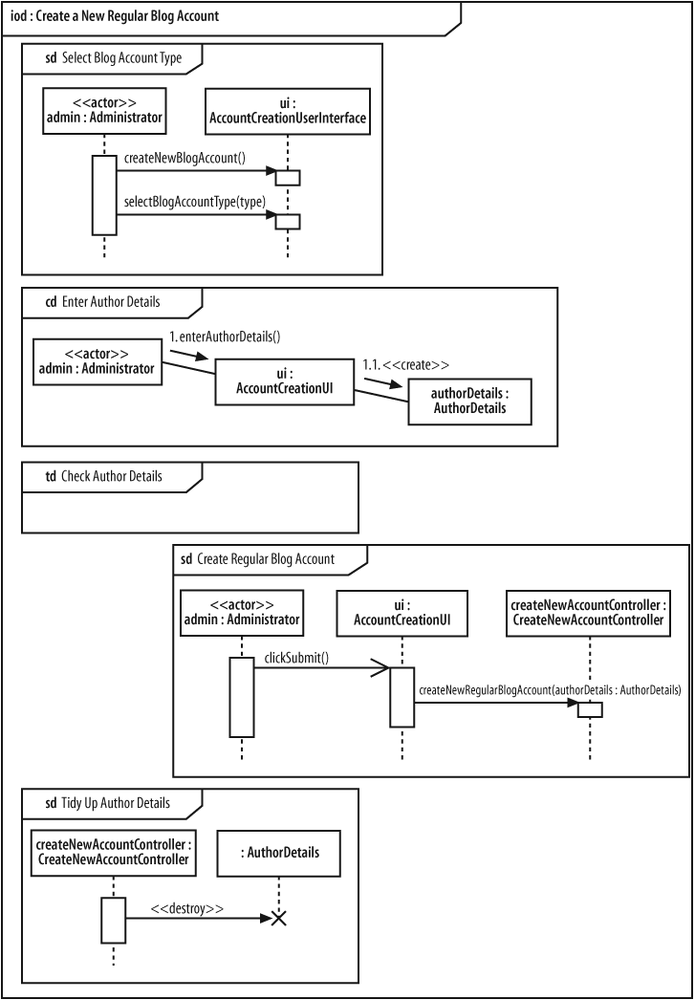
First, we need to decide how the interaction overview will be broken down into the most effective diagrams for each of the individual interactions, as shown in Figure 10-4.
When modeling the Select Blog Account Type, Create Regular Blog Account, and Tidy Up Author Details interactions, message order is more important than any other factor. The relevant steps can be reused from the sequence diagrams modeled in Chapter 7, as shown in Figure 10-5.
For variety’s sake, the Enter Author Details will be displayed as a communication diagram, as shown in Figure 10-6.
You could decide to represent the Enter Author Details interaction as a communication diagram simply because it is easier to understand, but there is so much similarity between sequence and communication diagrams that mixing the two on one interaction overview is not often seen; modelers tend to prefer one type of diagram or the other.
The Check Author Details interaction must enforce the timing constraint that its messages will all be executed within five seconds (see Chapter 9). The focus is on timing for this part of the overview and thanks to the fact that an interaction overview can contain any of the different types of interaction diagram, a timing diagram can be employed for the Check Author Details interaction, as shown in Figure 10-7.


Tip
An interaction overview diagram can offer an ideal place to use the alternative timing diagram notation, as shown in Figure 10-7. Since interaction overviews can get pretty big, the alternative notation often works best since it makes good use of the space available.

Now that all the interactions have been added to the interaction overview, all of the participants involved are known so we can add their names to the diagram’s title, as shown in Figure 10-8.

Gluing the Interactions Together
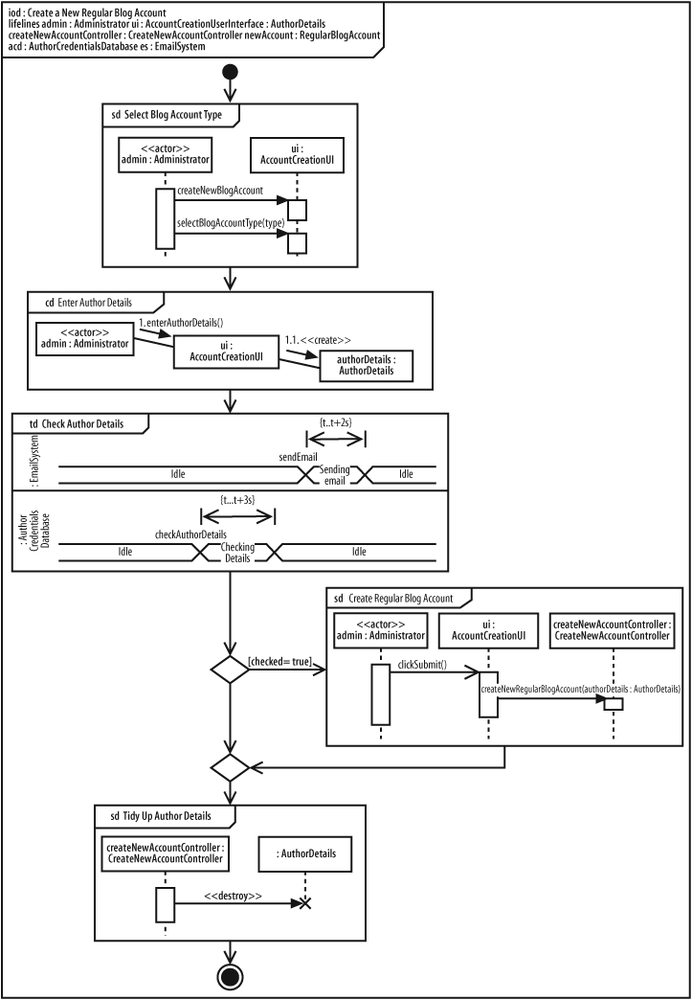
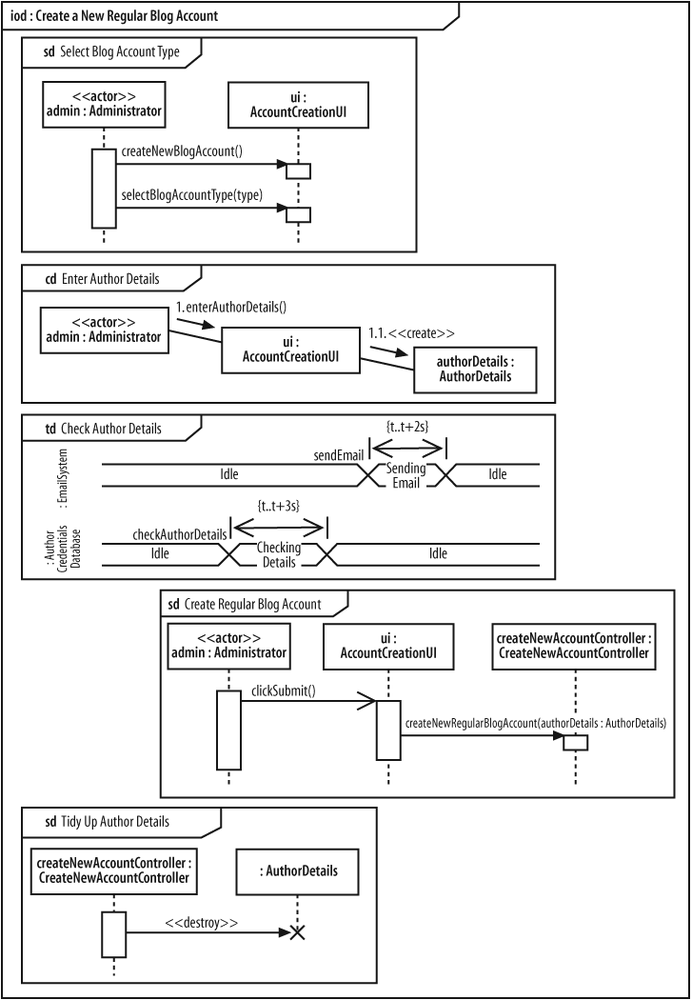
The final piece of the puzzle in the Create a New Regular Blog Account interaction overview is the actual flow of control between each of the separate interaction diagrams, as shown in Figure 10-9.
The control flow in Figure 10-9 shows that each of the separate interactions are executed in order. The one deviation from the normal path occurs at the Create Regular Blog Account interaction, shown as a sequence diagram, which is executed only if the author details checked out during the Check Author Details interaction.
What’s Next?
Interaction overview diagrams glue together combinations of sequence diagrams, communication diagrams, and timing diagrams, showing the higher-level picture. At this point, you’re done considering interaction diagrams, but you may want to back up and review any of the interaction diagram chapters if you weren’t clear when to use which diagram type. Sequence diagrams were covered in Chapter 7; communication diagrams were described in Chapter 8; timing diagrams were covered in Chapter 9.