
Chapter 14. Modeling an Object’s State: State Machine Diagrams
Activity diagrams and interaction diagrams are useful for describing behavior, but there’s still a missing piece. Sometimes the state of an object or system is an important factor in its behavior. For example, if the CMS required potential users to submit an application for an account, which could be approved or rejected, then the AccountApplication object may act differently depending on whether it is pending, accepted, or rejected.
In such situations, it’s helpful to model states of an object and the events causing state changes—this is what state machine diagrams do best. Continuing the above example, the AccountApplication object could have the states pending, accepted, and rejected as possible values of an attribute, and change states upon events such as approve or reject. A state machine diagram allows you to model this behavior.
State machine diagrams are heavily used in special niches of software and hardware systems, including the following:
Real-time/mission-critical systems, such as heart monitoring software
Dedicated devices whose behavior is defined in terms of state, such as ATMs
First-person shooter games, such as Doom or Half-Life
To reflect these common uses, this chapter will deviate from the CMS example used throughout the rest of this book.
Most of this chapter focuses on behavioral state machines , which can show states, transitions, and behavior (inside states and along transitions). There’s another type of state machine called a protocol state machine that doesn’t model behavior but is useful for modeling protocols such as network communication protocols. Protocol state machines are discussed briefly at the end of the chapter.
State machine diagrams are part of the logical model of your system, as shown in Figure 14-1.

State machine diagrams are often referred to informally as state diagrams. You may also have seen them referred to as a statechart diagrams in the past, since this diagram has undergone many name changes.
Essentials
Let’s look at the key elements of state diagrams using a simple example. Figure 14-2 shows a state diagram modeling a light. When you lift the light switch, the light turns on. When you lower the light switch, the light turns off.
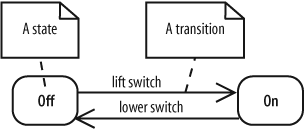
A state diagram consists of states, drawn as rounded rectangles, and transitions, drawn as arrows connecting the states. A transition represents a change of state, or how to get from one state to the next. A state is active when entered through a transition, and it becomes inactive when exited through a transition.
The event causing the state change, or trigger, is written along the transition arrow. The light in Figure 14-2 has two states: Off and On. It changes state when the lift switch or lower switch triggers
occur.
If you haven’t seen state diagrams before, it may help to view the states and transitions in table form, as shown in Table 14-1. In the left column are the states, and along the top row are triggers. The table is interpreted as follows: when the object is in a state and receives a trigger, the object moves to the resulting state specified in the cell. A dash (-) means that no transition happens or that the combination is impossible. Viewing states
and transitions in table form can be helpful when getting up-to-speed, but don’t depend on this too heavily; details of states and transitions can be more complex, and it will become easier to work with state diagrams.
|
State/Trigger |
Light switch lifted |
Light switch lowered |
|
Off |
On |
- |
|
On |
- |
Off |
State diagrams usually have an initial pseudostate and a final state, marking the start and end points of the state machine, respectively. An initial pseudostate is drawn with a filled circle, and a final state is drawn with two concentric circles with a filled inner circle, as shown in Figure 14-3.
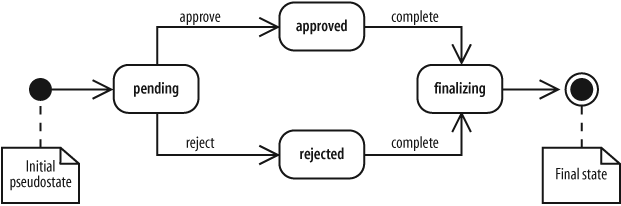
Pseudostates are special markers that direct the flow of traffic in a state diagram. As mentioned above, an initial pseudostate models the starting point of a state diagram. There are other pseudostates discussed later in "Advanced Pseudostates" that model complex transitions between states.
Now that you’ve seen the basic elements of state diagrams, let’s look in detail at these elements.
States
A state is a condition of being at a certain time. A state can be a passive quality, such as On and Off for the light object. A state can also be an active quality, or something that an object is doing. For example, a coffeemaker has the state Brewing during which it is brewing coffee. A state is drawn as a rounded rectangle with the name of the state in the center, as shown in Figure 14-4.

If the state is a “doing” state, you can write the behavior inside the state, as shown in Figure 14-5.
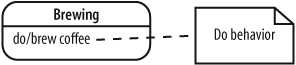
Do behavior, written as do/
behavior, is behavior that happens as long as the state is active. For example, the coffeemaker in Figure 14-5 does the behavior brew coffee while in the Brewing state. Similarly, a CD player could have the behavior do/read disc while in the Playing state. Do behavior either completes on its own or is forced to complete when a trigger causes the state to exit, as discussed in "Transitions.” Later in this chapter, you’ll see additional ways to show details of a state, including entry and exit behavior, reactions to events within a state, and states within states.
Transitions
A transition, shown with an arrow, represents a change of states from a source state to a target state . A transition description, written along the arrow, describes the circumstances causing the state change to occur.
The previous state diagrams in this chapter had fairly simple transition descriptions because they consisted only of triggers. For example, the light in Figure 14-2 changed state in response to the triggers lift switch and lower switch. But transition descriptions can be more complex. The full notation for transition descriptions is trigger[guard] / behavior, where each element is optional, as shown in Figure 14-6. This section defines each of these elements, and then in “Transition Variations” we’ll show how these elements interact to model different types of state changes.

A trigger is an event that may cause a transition. In a system that processes user input, a keystroke trigger may cause the system to change states from Gathering input to Processing input.
Tip
In addition to triggers , transitions can also be prompted by the completion of internal behavior, as discussed later in this chapter.
A guard is a Boolean condition that permits or blocks the transition. When a guard is present, the transition is taken if the guard evaluates to true, but the transition is blocked if the guard is false. Continuing the user input example, after a keystroke trigger occurs, a guard can be used to block a transition if the input is less than the required length. Guards are commonly used to model a transition being blocked or a choice between transitions, as discussed next in “Transition Variations.”
Transition behavior is an uninterruptible activity that executes while the transition takes place (if the transition is taken). For example, transition behavior could include submitting the user’s input for processing while changing states from Gathering input to Processing input.
Figure 14-6 shows all three elements of a transition—trigger, guard, and transition behavior. When a keystroke occurs and the input is the required length, the transition from Gathering input to Processing input is taken. While the transition occurs, the transition behavior submit input is invoked. Figure 14-6 also shows that a state can transition to itself; this is known as a self-transition
.
Transition Variations
Figure 14-7 shows a state diagram for a CD player. Its transition descriptions feature an assortment of triggers, guards, and transition behavior. Let’s break this diagram apart to see how combinations of guards and triggers can be used to model different types of state changes.

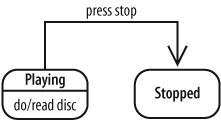
If a trigger is specified but no guard is, then the transition is taken when the trigger occurs. This is useful for modeling a state change in response to an event. In Figure 14-8, the CD player moves from the Playing state to Stopped when press stop occurs.
If a trigger and a guard are specified, then the transition is taken when the trigger occurs if the guard evaluates to true. Otherwise, the transition isn’t taken. Combining a trigger and a guard is useful for modeling that a transition can be blocked depending on a condition. You can also use guards to model a choice between transitions, as you’ll see later.
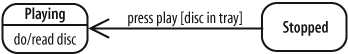
In Figure 14-9, the CD player moves from the Stopped state to Playing when press play occurs, but only if a disc is in the tray.
If neither a trigger nor a guard are specified, then the transition is taken immediately after the source state’s internal behavior (if any) is complete. This is useful for modeling a transition caused by completion of internal behavior. Figure 14-10 shows a triggerless, guardless transition leading from Playing to Stopped, which means that the CD player moves to the Stopped state as soon as it finishes reading the disc. (This transition is not seen in the full CD player state diagram in Figure 14-7, but is included to explain triggerless transitions, shown in Figure 14-11.)

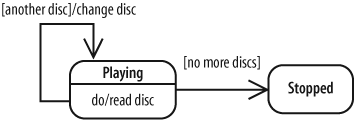
Figure 14-9 showed the use of guards to block a transition. You can also use guards to show a choice between transitions: the transition whose guard evaluates to true is taken. In Figure 14-11, after the CD player is done reading the disc, it will either move to the Stopped state if there are no more discs or transition back to the Playing state if there are more discs. Notice that if there are more discs, the transition includes transition behavior—changing the disc.
As a presentation option for choices, you can use a choice pseudostate, discussed later in "Advanced Pseudostates.”
States in Software
If you’re a software developer, you’re probably wondering when you’ll ever need to model the operation of a CD player or coffeemaker. In software, state diagrams model an object’s life cycle, or the states it goes through during its lifespan. Figure 14-12 shows the life cycle of
an AccountApplication object as it passes from pending to approved or rejected and then to finalizing.
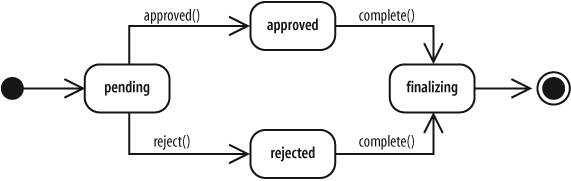
State diagrams are useful for modeling an object that behaves differently depending on its state. Considering an AccountApplication object, calling the complete( ) method when the object is in the pending state wouldn’t make sense if the finalizing state performs wrap-up behavior, such as creating the blog account if approved—it would first have to know whether the application was approved. State diagrams are an effective way to make this information explicit.
If an object has a simple life cycle, then it’s not worth modeling its life cycle with a state diagram. For example, a ContactInformation object that stores an Author’s contact information and doesn’t change states other than being created and destroyed probably doesn’t warrant a state diagram.
Tip
If you’re wondering what an object’s states would look like in code—the AccountApplication class could have a status attribute and the states shown in Figure 14-12 could be possible values of status. Transitions occur when methods on the AccountApplication object are invoked. See Chapter 4 for a review of how an object’s state is captured in its attributes.
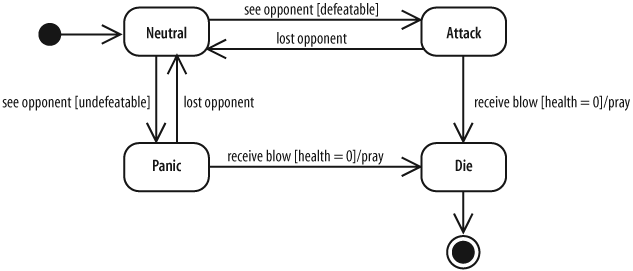
State diagram are also heavily used in certain software niches, such as first-person shooter (FPS) games. In FPS games, state machines are used to model game character states. For example, a game character, such as a troll, could have the states Neutral, Attack, Panic, and Die, as shown in Figure 14-13. When the troll is in the Attack state, he is performing behavior, such as unsheathing his sword or charging his opponent (that’s you). Triggers causing a state change include seeing an opponent or receiving a blow from the opponent.
Advanced State Behavior
You’ve seen the most common ways to model states. This section shows how to model additional details of a state, including entry behavior, exit behavior, and reactions to events while in a state.
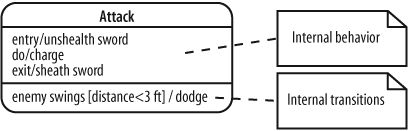
Figure 14-14 shows the detailed notation for a state: a large rounded rectangle with separate compartments for internal behavior and internal transitions.
Internal Behavior
Internal behavior is any behavior that happens while the object is in a state. You’ve already seen do behavior, which is behavior that is ongoing while the state is active. Internal behavior is a more general concept that also includes entry and exit behavior.
Internal behavior is written as label / behavior. The label indicates when the behavior executes—in other words, events or circumstances causing the behavior. There are three special labels: entry, exit, and do.
Entry behavior happens as soon as the state becomes active and is written as entry/
behavior. Exit behavior happens immediately before the state becomes inactive and is written as exit/
behavior.
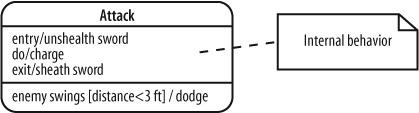
In Figure 14-15, unsheath sword is entry behavior and sheath sword is exit behavior. Unlike do behavior, entry and exit behaviors can’t be interrupted.
Internal Transitions
An internal transition is a transition that causes a reaction within a state, but doesn’t cause the object to change states. An internal transition is different from a self transition (see Figure 14-11) because self transitions cause entry and exit behavior to occur whereas internal transitions don’t.
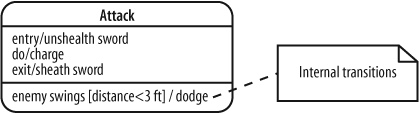
Internal transitions are written as trigger [guard] / behavior, and they are listed inside a state. In Figure 14-16, the Attack has an internal transition: when an opponent swings his weapon and is less than three feet away, the troll dodges.
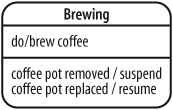
Use internal transitions to model reactions to events that don’t cause state changes. For example, you could use internal transitions to show that a pause-and-serve coffee-maker suspends dispensing the coffee when you remove the coffee pot but doesn’t leave the Brewing state, as shown in Figure 14-17.
Composite States
A key difference between UML state diagrams and other non-UML state diagrams you may be familiar with is that UML allows concurrent states, or being in multiple states at the same time. Composite states are what makes this possible.
Suppose the troll in the Neutral state is doing two things at the same time: Searching and Pacing. You can model two simultaneous states by using a composite state, as shown in Figure 14-18.
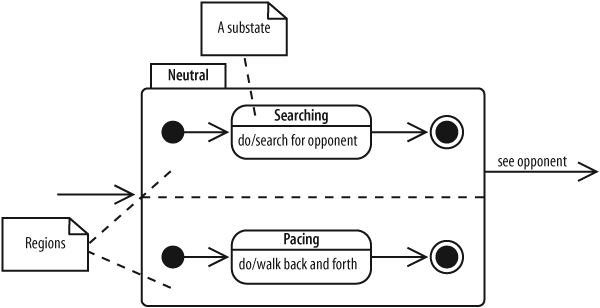
A composite state is a state that contains one or more state diagrams. Each diagram belongs to a region, and regions are divided by a dotted line. A state in a region is referred to as a substate of the composite state.
Composite states work as follows: when the composite state becomes active, the initial pseudostate of each region becomes active, and the contained state diagrams begin executing. The contained state diagrams are interrupted if a trigger on the composite state occurs. In Figure 14-18, the substates will be halted when a trigger on the composite state—see opponent—occurs.
If substates have behavior that can run to completion, then the composite state is complete when every region’s state diagram is complete.
Advanced Pseudostates
You’ve already seen initial pseudostates, which mark the start of a state diagram. There are additional pseudostates that are useful for directing the flow of traffic between states.
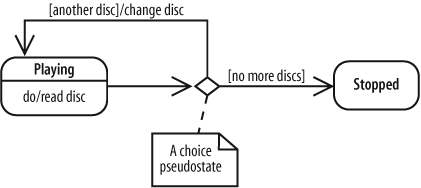
A choice pseudostate is used to emphasize that a Boolean condition determines which transition is followed. A choice has guards on each of its outgoing transitions, and the transition that is followed depends on the guard. In Figure 14-19, the CD player will go back to the Playing state if another disc is available or will go to the Stopped state if there are no more discs. Notice that this is an alternate, and cleaner, way to model the transition choice in Figure 14-11.
Tip
At least one of the guards following a choice must evaluate to true for your model to be well-formed. If more than one guard following a choice evaluates to true, then one of them is selected arbitrarily. If this situation doesn’t make sense for your model, then it’s a sign that you need to redefine your guards so that exactly one guard at a time evaluates to true.
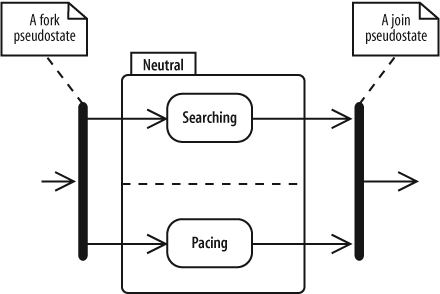
Fork and join pseudostates show branching into concurrent states and then rejoining. For example, in Figure 14-20, the fork breaks the incoming transition into two transitions, allowing Searching and Pacing to happen simultaneously. The join then merges its two incoming transitions into one outgoing transition.
Figure 14-20 is an alternate way to model Figure 14-18. In Figure 14-18, forking and joining are implied by showing the initial pseudostates and final states.
Signals
You can use special icons for transitions to draw attention to transitions and transition behavior. This is called a transition-oriented view.
In this view, a trigger is represented with a receive signal icon and transition behavior is represented with a send signal icon. Figure 14-21 shows how Figure 14-6 can be drawn in this alternate notation. It additionally uses the choice pseudostate introduced previously in "Advanced Pseudostates.”
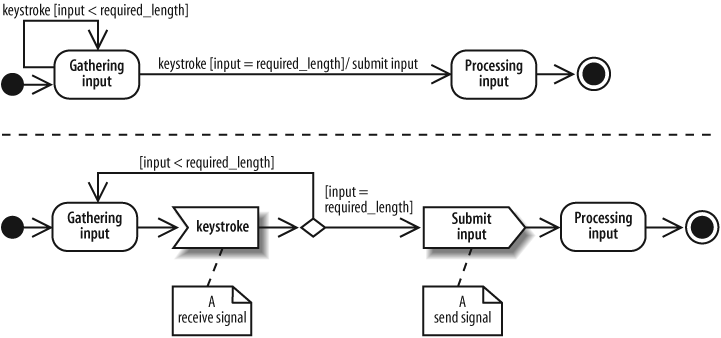
The main purpose of this notation is to visually emphasize sending and receiving signals. Although both diagrams say the same thing, the version with the signal icons focuses on the transitions and, in this case, makes the diagram more readable.
Protocol State Machines
Protocol state machines are a special kind of state machine focusing on how a protocol, such as a communication protocol (e.g., TCP), works. The main difference between protocol state machines
and behavioral state machines, which we’ve focused on previously, is that protocol state machines don’t show behavior along transitions or inside states. Instead, they focus on showing a legal sequence of events and resulting states. Protocol state machines are drawn in a tabbed rectangle with the name of the state machine in the tab followed by {protocol}, as shown in Figure 14-22.
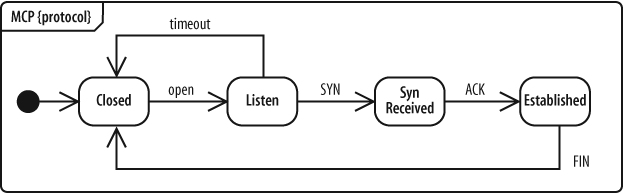
Because protocol state machines don’t show behavior, you can’t model what the system is doing in response—for example, if it’s sending acknowledgements back. But it can be useful for showing how to work with an object or system, such as specifying a communication protocol or an expected call sequence for an object’s operations.
What’s Next?
State diagrams show the states of an object and triggers causing a change of state. If you’re interested in modeling object state changes in the context of a workflow, see activity diagrams, covered in Chapter 3.
If you want to show timing associated with state changes, then it’s also worth checking out timing diagrams, covered in Chapter 9.