
3. Performance Tools
This chapter explains how to use the wealth of performance tools available for Linux. We also explain what the information from each tool means. Even if you are already using top or sar, you can probably learn some things from this chapter.
You should make a habit of using these tools if you are not already doing so. You need to know how to troubleshoot a performance problem, of course, but you should also regularly look for changes in the key metrics that can indicate a problem. You can use these tools to measure the performance impact of a new application. Just like looking at the temperature gauge in a car, you need to keep an eye on the performance metrics of your Linux systems. The tools we cover are:
• top
• sar
• vmstat
• iostat
• free
These tools can be run as a normal user. They all take advantage of the /proc filesystem to obtain their data. These performance tools are delivered with a few rpms. The procps rpm supplies top, free, and vmstat. The sysstat rpm provides sar and iostat.
The top command is a great interactive utility for monitoring performance. It provides a few summary lines of overall Linux performance, but reporting process information is where top shines. The process display can be customized extensively. You can add fields, sort the list of processes by different metrics, and even kill processes from top.
The sar utility offers the capability to monitor just about everything. It has over 15 separate reporting categories including CPU, disk, networking, process, swap, and more.
The vmstat command reports extensive information about memory and swap usage. It also reports CPU and a bit of I/O information. As you might guess, iostat reports storage input/output (I/O) statistics.
These commands cover a lot of the same ground. We discuss how to use the commands, and we explain the reports that each command generates. We don’t discuss all 15 sar syntaxes, but we cover the most common ones.
top
The top command is one of the most familiar performance tools. Most system administrators run top to see how their Linux and UNIX systems are performing. The top utility provides a great way to monitor the performance of processes and Linux as a whole. It is more accurate to call Linux processes tasks, but in this chapter we call them processes because that is what the tools call them.1 top can be run as a normal user as well as root. Figure 3-1 shows typical top output from an idle system.
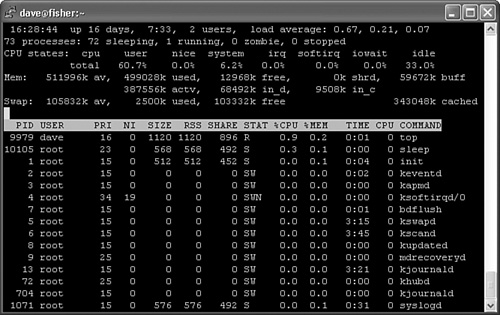
The top display has two parts. The first third or so shows information about Linux as a whole. The remaining lines are filled with individual process information. If the window is stretched, more processes are shown to fill the screen.
Much general Linux information can be obtained by using several other commands instead of top. It is nice to have it all on one screen from one command, though. The first line shows the load average for the last one, five, and fifteen minutes. Load average indicates how many processes are running on a CPU or waiting to run. The uptime command can be used to display load averages as well. Next comes process information, followed by CPU, memory, and swap. The memory and swap information is similar to the free command output. After we determine memory and CPU usage, the next question is, which processes are using it?
Most of the process information can be obtained from the ps command too, but top provides a nicer format that is easier to read. The most useful interactive top command is h for help, which lists top’s other interactive commands.
Adding and Removing Fields
Fields can be added or removed from the display. The process output can be sorted by CPU, memory, or other metric. This is a great way to see what process is hogging memory. The top syntax and interactive options differ among Linux distributions. The help command quickly lists what commands are available. Many interactive options are available. Spend some time trying them out.
Figure 3-2 shows a Red Hat Enterprise Linux ES release 3 help screen.

The f command adds or removes fields from the top output. Figure 3-3 is a Red Hat Enterprise Linux ES release 3 help screen showing what fields can be added.
Figure 3-3. top add/remove fields screen
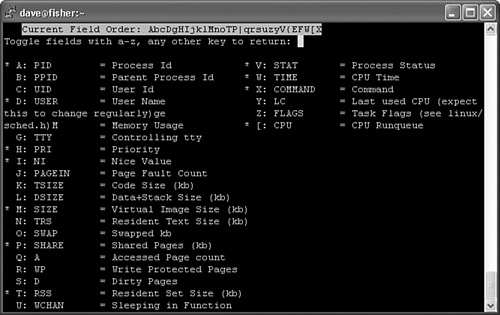
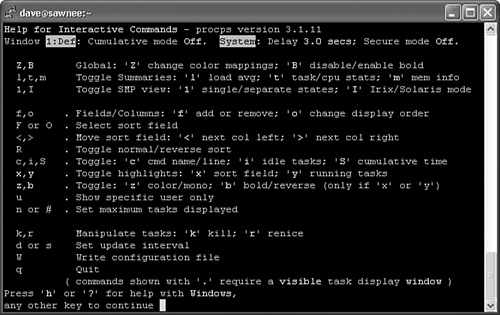
Figure 3-4 shows a SUSE Linux 9.0 top help screen. You can see that the commands they offer differ greatly.
Figure 3-4. SUSE top help screen
Output Explained
Let’s take a look at what the information from top means. We’ll use the following output from top as an example:
16:30:30 up 16 days, 7:35, 2 users, load average: 0.54, 0.30, 0.11
73 processes: 72 sleeping, 1 running, 0 zombie, 0 stopped
CPU states: cpu user nice system irq softirq iowait idle
total 13.3% 0.0% 20.9% 0.0% 0.0% 0.0% 65.7%
Mem: 511996k av, 498828k used, 13168k free, 0k shrd, 59712k buff
387576k actv, 68516k in_d, 9508k in_c
Swap: 105832k av, 2500k used, 103332k free 343056k cached
PID USER PRI NI SIZE RSS SHARE STAT %CPU %MEM TIME CPU COMMAND
10250 dave 20 0 1104 1104 888 R 3.8 0.2 0:00 0 top
10252 root 23 0 568 568 492 S 0.9 0.1 0:00 0 sleep
1 root 15 0 512 512 452 S 0.0 0.1 0:04 0 init
The first line from top displays the load average information:
16:30:30 up 16 days, 7:35, 2 users, load average: 0.54, 0.30, 0.11
This output is similar to the output from uptime. You can see how long Linux has been up, the time, and the number of users. The 1-, 5-, and 15-minute load averages are displayed as well. Next, the process summary is displayed:
73 processes: 72 sleeping, 1 running, 0 zombie, 0 stopped
We see 73 total processes. Of those, 72 are sleeping, and one is running. There are no zombies or stopped processes. A process becomes a zombie when it exits and its parent has not waited for it with the wait(2) or waitpid(2) functions. This often happens because the parent process exits before its children. Zombies don’t take up resources other than the entry in the process table. Stopped processes are processes that have been sent the STOP signal. See the signal(7) man page for more information.
Next up is the CPU information:
CPU states: cpu user nice system irq softirq iowait idle
total 13.3% 0.0% 20.9% 0.0% 0.0% 0.0% 65.7%
The CPU lines describe how the CPUs spend their time. The top command reports the percentage of CPU time spent in user or kernel mode, running niced processes, and in idleness. The iowait column shows the percentage of time that the processor was waiting for I/O to complete while no process was executing on the CPU. The irq and softirq columns indicate time spent serving hardware and software interrupts. Linux kernels earlier than 2.6 don’t report irq, softirq, and iowait.
The memory information is next:
Mem: 511996k av, 498828k used, 13168k free, 0k shrd, 59712k buff
387576k actv, 68516k in_d, 9508k in_c
The first three metrics give a summary of memory usage. They list total usable memory, used memory, and free memory. These are all you need to determine whether Linux is low on memory.
The next five metrics identify how the used memory is allocated. The shrd field shows shared memory usage and buff is memory used in buffers. Memory that has been allocated to the kernel or user processes can be in three different states: active, inactive dirty, and inactive clean. Active, actv in top, indicates that the memory has been used recently. Inactive dirty, in_d in top, indicates that the memory has not been used recently and may be reclaimed. In order for the memory to be reclaimed, its contents must be written to disk. This process is called “laundering” and can be called a fourth temporary state for memory. Once laundered, the inactive dirty memory becomes inactive clean, in_c in top. Available at the time of this writing is an excellent white paper by Norm Murray and Neil Horman titled “Understanding Virtual Memory in Red Hat Enterprise Linux 3” at http://people.redhat.com/nhorman/papers/rhel3_vm.pdf.
The swap information is next:
Swap: 105832k av, 2500k used, 103332k free 343056k cached
The av field is the total amount of swap that is available for use, followed by the amount used and amount free. Last is the amount of memory used for cache by the kernel.
The rest of the top display is process information:
PID USER PRI NI SIZE RSS SHARE STAT %CPU %MEM TIME CPU COMMAND
10250 dave 20 0 1104 1104 888 R 3.8 0.2 0:00 0 top
10252 root 23 0 568 568 492 S 0.9 0.1 0:00 0 sleep
1 root 15 0 512 512 452 S 0.0 0.1 0:04 0 init
top shows as many processes as can fit on the screen. The field descriptions are described well in the top(1) man page. Table 3-1 provides a summary of the fields.

Saving Customization
A very nice top feature is the capability to save the current configuration. Change the display as you please using the interactive commands and then press w to save the view. top writes a .toprc file in the user’s home directory that saves the configuration. The next time this user starts top, the same display options are used.
top also looks for a default configuration file, /etc/toprc. This file is a global configuration file and is read by top when any user runs the utility. This file can be used to cause top to run in secure mode and also to set the refresh delay. Secure mode prevents non-root users from killing or changing the nice value of processes. It also prevents non-root users from changing the refresh value of top. A sample /etc/toprc file for our Red Hat Enterprise Linux ES release 3 looks like the following:
$ cat /etc/toprc
s3
The s indicates secure mode, and the 3 specifies three-second refresh intervals. Other distributions may have different formats for /etc/toprc. The capability to kill processes is a pretty nice feature. If some user has a runaway process, the top command makes it easy to find and kill. Run top, show all the processes for a user with the u command, and then use k to kill it. top not only is a good performance monitoring tool, but it can also be used to improve performance by killing those offensive processes.
Batch Mode
top can also be run in batch mode. Try running the following command:
$ top –n 1 –b >/tmp/top.out
The -n 1 tells top to only show one iteration, and the -b option indicates that the output should be in text suitable for writing to a file or piping to another program such as less. Something like the following two-line script would make a nice cron job:
# cat /home/dave/top_metrics.sh
echo "**** " 'date' " ****" >> /var/log/top/top.'date +%d'.out
/usr/bin/top -n 1 -b >> /var/log/top/top.'date +%d'.out
We could add it to crontab and collect output every 15 minutes.
# crontab -l
*/15 * * * * /home/dave/top_metrics.sh
The batch output makes it easy to take a thorough look at what is running while enjoying a good cup of coffee. All the processes are listed, and the output isn’t refreshing every five seconds. If a .toprc configuration file exists in the user’s home directory, it is used to format the display. The following output came from the top batch mode running on a multi-CPU Linux server. Note that we don’t show all 258 processes from the top output.
10:17:21 up 125 days, 10:10, 4 users, load average: 3.60, 3.46, 3.73
258 processes: 252 sleeping, 6 running, 0 zombie, 0 stopped
CPU states: cpu user nice system irq softirq iowait idle
total 41.0% 0.0% 21.4% 0.4% 0.4% 0.0% 36.5%
cpu00 36.7% 0.0% 22.6% 1.8% 0.0% 0.0% 38.6%
cpu01 46.2% 0.0% 17.9% 0.0% 0.9% 0.0% 34.9%
cpu02 32.0% 0.0% 28.3% 0.0% 0.0% 0.0% 39.6%
cpu03 49.0% 0.0% 16.9% 0.0% 0.9% 0.0% 33.0%
Mem: 4357776k av, 4321156k used, 36620k free, 0k shrd, 43860k buff
3261592k actv, 625088k in_d, 80324k in_c
Swap: 1048536k av, 191848k used, 856688k free 3920940k cached
PID USER PRI NI SIZE RSS SHARE STAT %CPU %MEM TIME CPU COMMAND
17599 wwrmn 21 0 9160 6900 1740 R 12.2 0.1 0:01 1 logsw
1003 coedev 15 -10 71128 65M 66200 S < 8.0 1.5 414:42 2 vmware-vmx
17471 wwrmn 15 0 10116 7868 1740 S 6.8 0.1 0:12 2 logsw
17594 wwrmn 18 0 9616 7356 1740 R 4.4 0.1 0:01 0 logsw
6498 coedev 25 0 43108 36M 33840 R 4.0 0.8 9981m 1 vmware-vmx
17595 wwrmn 17 0 8892 6632 1740 S 3.0 0.1 0:01 3 logsw
17446 wwrmn 15 0 10196 7960 1740 S 2.8 0.1 0:13 3 logsw
17473 wwrmn 15 0 9196 6948 1740 S 2.8 0.1 0:02 1 logsw
17477 wwrmn 15 0 9700 7452 1740 S 2.3 0.1 0:04 2 logsw
958 coedev 15 -10 71128 65M 66200 S < 2.1 1.5 93:53 3 vmware-vmx
7828 coedev 15 -10 38144 33M 33524 S < 1.8 0.7 4056m 1 vmware-vmx
6505 coedev 25 0 0 0 0 RW 1.8 0.0 3933m 1 vmware-rtc
7821 coedev 15 -10 38144 33M 33524 S < 1.6 0.7 6766m 1 vmware-vmx
6478 coedev 15 -10 43108 36M 33840 S < 1.6 0.8 6224m 0 vmware-vmx
17449 wwrmn 15 0 9820 7572 1740 S 1.6 0.1 0:07 3 logsw
7783 coedev 15 0 47420 15M 1632 S 1.4 0.3 1232m 3 vmware
6497 coedev 15 -10 43108 36M 33840 S < 0.9 0.8 3905m 1 vmware-vmx
1002 coedev 15 -10 71128 65M 66200 S < 0.9 1.5 59:54 2 vmware-vmx
17600 jtk 20 0 1276 1276 884 R 0.9 0.0 0:00 2 top
7829 coedev 25 0 38144 33M 33524 R 0.7 0.7 6688m 0 vmware-vmx
1 root 15 0 256 228 200 S 0.0 0.0 2:25 0 init
By now you can see why top is such a popular performance tool. The interactive nature of top and the ability to easily customize the output makes it a great resource for identifying problems.
sar
sar is a great general performance monitoring tool. sar can output data for almost everything Linux does. The sar command is delivered in the sysstat rpm. We use sysstat version 5.0.5 in our examples. This is one of the more recent versions listed as stable. Look at the sysstat home page at http://perso.wanadoo.fr/sebastien.godard/ for release information and downloads.
sar can display performance data for CPU, run queue, disk I/O, paging (swap), memory, CPU interrupts, networking, and more. The most important sar feature is the capability to create a data file. Every Linux system should collect sar data from cron jobs. The sar data file provides a system administrator with historical performance information. This feature is very important, and it separates sar from the other performance tools. If a nightly batch job runs twice as long as normal, you won’t find out until the next morning (unless you get paged). You need the ability to look at performance data from 12 hours ago. The sar data collector provides this ability. Many reporting syntaxes exist, but let’s look at data collection first.
sar Data Collector
sar data collection is done with a binary executable and two scripts in /usr/lib/sa. The sar data collector is a binary executable located at /usr/lib/sa/sadc. The job of sadc is to write to the data collection file /var/log/sa/. Several options can be supplied to sadc. A common syntax is:
/usr/lib/sa/sadc interval iterations file name
interval is the number of seconds between sampling. iterations is the number of samples to take. file name specifies the output file. A simple sadc syntax is /usr/lib/ sa/sadc 360 5 /tmp/sadc.out. This command takes five samples at five-minute intervals and stores them in /tmp/sadc.out. We should collect the samples on a regular basis, so we need a script to be run by cron. We should put the samples in a place that makes sense, like we did with the top script from the previous section. Fortunately, the sysstat rpm provides the /usr/lib/sa/sa1 script to do all this.
The sa1(8) man page is much longer than the sa1 script itself. /usr/lib/sa/sa1 is a very simple script that runs sadc with the syntax sadc -F -L 1 1 /var/log/sa/sa## where ## is the day of the month. Older versions of sa1 use the output from date +.%Y_%m_%d as the file suffix. The -F option causes sadc to force creation of the output file if necessary. The -L locks the output file before writing to it to prevent corrupting the file when two sadc processes are running at the same time. Older versions of sadc didn’t have the -L option, so the sa1 script performed manual locking. The only options for the sa1 script are the interval between samples and the number of iterations to sample. A cron file (/etc/cron.d/sysstat) is supplied with sysstat. It differs between sysstat versions. The following are the entries for the version 5.0.5 of sysstat:
# cat /etc/cron.d/sysstat
# run system activity accounting tool every 10 minutes
*/10 * * * * root /usr/lib/sa/sa1 1 1
# generate a daily summary of process accounting at 23:53
53 23 * * * root /usr/lib/sa/sa2 -A
You can see that after the sysstat rpm is installed, sadc begins taking samples. The sysstat home page is http://perso.wanadoo.fr/sebastien.godard/.2 The documentation link offers the following crontab suggestions as of January 14, 2006:
# 8am-7pm activity reports every 10 minutes during weekdays.
0 8-18 * * 1-5 /usr/lib/sa/sa1 600 6 &
# 7pm-8am activity reports every an hour during weekdays.
0 19-7 * * 1-5 /usr/lib/sa/sa1 &
# Activity reports every an hour on Saturday and Sunday.
0 * * * 0,6 /usr/lib/sa/sa1 &
# Daily summary prepared at 19:05
5 19 * * * /usr/lib/sa/sa2 -A &
The crontab example in Sebastien Godard’s Web site suggests taking a sample every 10 minutes from 8 a.m. to 6 p.m. weekdays and every hour otherwise. (Note: The crontab comment says 7pm but 18:00 is 6pm.) If disk space in /var is sufficient, you may want to sample every 10 minutes every hour of the day. If the weekend backups are slower, then an hourly sadc sample may not be very helpful.
Now let’s look at the more popular reporting syntaxes.
CPU Statistics
The sar -u output shows CPU information. The -u option is the default for sar. The output shows CPU utilization as a percentage. Table 3-2 explains the output.

This should look familiar. It is the same CPU information as in top reports. The following shows the output format:
[root@fisher dave]# sar 5 10
Linux 2.4.21-27.EL (fisher) 04/30/2005
02:03:20 PM CPU %user %nice %system %iowait %idle
02:03:25 PM all 36.80 0.00 4.20 0.00 59.00
02:03:30 PM all 37.80 0.00 5.20 2.20 54.80
02:03:35 PM all 55.40 0.00 4.40 3.00 37.20
02:03:40 PM all 53.60 0.00 6.20 0.00 40.20
02:03:45 PM all 37.20 0.00 6.60 1.00 55.20
02:03:50 PM all 36.60 0.00 4.40 2.20 56.80
02:03:55 PM all 51.00 0.00 4.20 1.00 43.80
02:04:00 PM all 55.60 0.00 4.20 0.00 40.20
02:04:05 PM all 40.60 0.00 8.00 1.20 50.20
02:04:10 PM all 36.60 0.00 4.20 2.20 57.00
Average: all 44.12 0.00 5.16 1.28 49.44
The 5 10 causes sar to take 10 samples at 5-second intervals. The first column of any sar report is a timestamp.
We could have looked at the file created with sadc by using the -f option. This sar syntax shows the output from sar -f /var/log/sa/sa21:
[dave@fisher dave]$ sar -f /var/log/sa/sa21head -n 20
Linux 2.4.21-20.EL (fisher) 04/21/2005
12:00:00 AM CPU %user %nice %system %iowait %idle
12:10:00 AM all 0.23 0.00 0.23 0.02 99.52
12:20:00 AM all 0.22 0.00 0.20 0.01 99.57
12:30:01 AM all 0.21 0.00 0.19 0.01 99.59
12:40:00 AM all 0.23 0.00 0.22 0.02 99.54
12:50:01 AM all 0.19 0.00 0.28 0.01 99.52
01:00:00 AM all 0.22 0.00 0.18 0.01 99.59
01:10:00 AM all 0.40 0.00 0.25 0.02 99.34
01:20:00 AM all 0.20 0.00 0.25 0.01 99.53
01:30:00 AM all 0.20 0.00 0.23 0.01 99.56
01:40:00 AM all 0.22 0.00 0.21 0.02 99.56
01:50:00 AM all 0.22 0.00 0.20 0.02 99.56
02:00:00 AM all 0.22 0.00 0.19 0.01 99.58
02:10:00 AM all 0.23 0.00 0.24 0.02 99.50
02:20:01 AM all 0.22 0.00 0.25 0.01 99.52
02:30:00 AM all 0.19 0.00 0.22 0.01 99.57
02:40:00 AM all 0.22 0.00 0.22 0.01 99.55
02:50:00 AM all 0.21 0.00 0.21 0.01 99.56
The sar command can break down this information for each CPU in a multi-CPU Linux box too, as the following sar -u -P ALL 5 5 output demonstrates:
Linux 2.4.21-20.ELsmp (doughboy) 04/13/2005
10:17:56 AM CPU %user %nice %system %iowait %idle
10:18:01 AM all 26.41 0.00 23.46 0.00 50.13
10:18:01 AM 0 23.20 0.00 32.80 0.00 44.00
10:18:01 AM 1 26.60 0.00 20.80 0.00 52.60
10:18:01 AM 2 25.80 0.00 21.00 0.00 53.20
10:18:01 AM 3 30.06 0.00 19.24 0.00 50.70
10:18:01 AM CPU %user %nice %system %iowait %idle
10:18:06 AM all 17.70 0.00 24.15 0.00 58.15
10:18:06 AM 0 22.40 0.00 26.40 0.00 51.20
10:18:06 AM 1 15.20 0.00 24.60 0.00 60.20
10:18:06 AM 2 19.00 0.00 20.00 0.00 61.00
10:18:06 AM 3 14.20 0.00 25.60 0.00 60.20
10:18:06 AM CPU %user %nice %system %iowait %idle
10:18:11 AM all 13.69 0.00 23.74 0.05 62.52
10:18:11 AM 0 9.00 0.00 27.40 0.00 63.60
10:18:11 AM 1 19.40 0.00 20.40 0.20 60.00
10:18:11 AM 2 13.20 0.00 21.00 0.00 65.80
10:18:11 AM 3 13.17 0.00 26.15 0.00 60.68
10:18:11 AM CPU %user %nice %system %iowait %idle
10:18:16 AM all 16.40 0.00 23.00 0.00 60.60
10:18:16 AM 0 16.60 0.00 18.00 0.00 65.40
10:18:16 AM 1 15.00 0.00 23.00 0.00 62.00
10:18:16 AM 2 19.40 0.00 19.80 0.00 60.80
10:18:16 AM 3 14.60 0.00 31.20 0.00 54.20
10:18:16 AM CPU %user %nice %system %iowait %idle
10:18:21 AM all 32.60 0.00 22.10 0.00 45.30
10:18:21 AM 0 30.80 0.00 24.40 0.00 44.80
10:18:21 AM 1 34.80 0.00 24.00 0.00 41.20
10:18:21 AM 2 32.00 0.00 20.20 0.00 47.80
10:18:21 AM 3 32.80 0.00 19.80 0.00 47.40
Average: CPU %user %nice %system %iowait %idle
Average: all 21.36 0.00 23.29 0.01 55.34
Average: 0 20.40 0.00 25.80 0.00 53.80
Average: 1 22.20 0.00 22.56 0.04 55.20
Average: 2 21.88 0.00 20.40 0.00 57.72
Average: 3 20.96 0.00 24.40 0.00 54.64
Disk I/O Statistics
sar is a good tool for looking at disk I/O. The following shows a sample of sar disk I/O output.
[dave@fisher dave]$ sar -d 5 2
Linux 2.4.21-27.EL (fisher) 04/29/2005
04:22:03 PM DEV tps rd_sec/s wr_sec/s
04:22:08 PM dev3-0 1.40 0.00 784.00
04:22:08 PM dev3-1 0.00 0.00 0.00
04:22:08 PM dev3-2 1.40 0.00 784.00
04:22:08 PM dev3-3 0.00 0.00 0.00
04:22:08 PM dev3-64 0.00 0.00 0.00
04:22:08 PM dev3-65 0.00 0.00 0.00
04:22:08 PM DEV tps rd_sec/s wr_sec/s
04:22:13 PM dev3-0 34.60 0.00 4219.20
04:22:13 PM dev3-1 0.00 0.00 0.00
04:22:13 PM dev3-2 34.60 0.00 4219.20
04:22:13 PM dev3-3 0.00 0.00 0.00
04:22:13 PM dev3-64 0.00 0.00 0.00
04:22:13 PM dev3-65 0.00 0.00 0.00
Average: DEV tps rd_sec/s wr_sec/s
Average: dev3-0 18.00 0.00 2501.60
Average: dev3-1 0.00 0.00 0.00
Average: dev3-2 18.00 0.00 2501.60
Average: dev3-3 0.00 0.00 0.00
Average: dev3-64 0.00 0.00 0.00
Average: dev3-65 0.00 0.00 0.00
The -d shows disk I/O information. The 5 2 options are interval and iterations, just like the sar data collector. Table 3-3 lists the fields and descriptions.
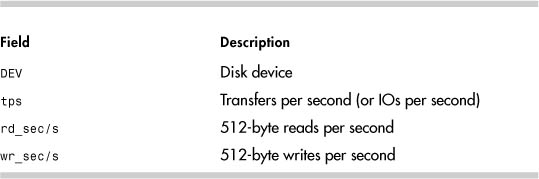
512 is just a unit of measure. It doesn’t imply that all disk I/O is in 512-byte chunks. The DEV column is the disk device in the format dev#-#, where the first # is a device major number, and the second # is a minor or sequential number. sar uses the minor number with kernels greater than 2.5. For example, we saw dev3-0 and dev3-1 in the sar -d output. These correspond to /dev/hda and /dev/hda1. Look at the following entries in /dev:
brw-rw---- 1 root disk 3, 0 Jun 24 2004 hda
brw-rw---- 1 root disk 3, 1 Jun 24 2004 hda1
/dev/hda has major number 3 and minor number 0. hda1 has a major number of 3 and a minor number of 1.
Networking Statistics
sar offers four different syntax options to display networking information. The -n option takes four different switches: DEV, EDEV, SOCK, and FULL. DEV displays networking interface information, EDEV shows statistics about network errors, SOCK shows socket information, and FULL shows all three switches. They can be used separately or together. Table 3-4 shows the fields reported with the -n DEV option.
Table 3-4. sar -n DEV Fields
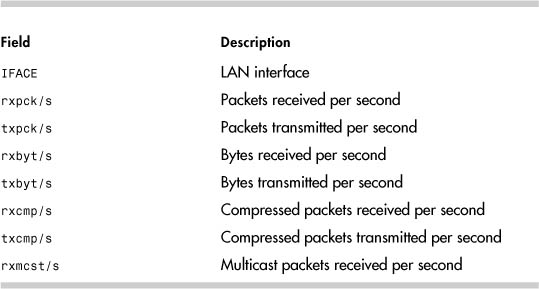
The following is the sar output using the -n DEV option:
# sar -n DEV 5 3
Linux 2.4.21-20.EL (fisher) 04/20/2005
03:39:18 AM IFACE rxpck/s txpck/s rxbyt/s txbyt/s rxcmp/s
txcmp/
s rxmcst/s
03:39:23 AM lo 0.00 0.00 0.00 0.00 0.00
0.0
0 0.00
03:39:23 AM eth0 36.80 0.00 8412.20 10.80 0.00
0.0
0 0.00
03:39:23 AM IFACE rxpck/s txpck/s rxbyt/s txbyt/s rxcmp/s
txcmp/
s rxmcst/s
03:39:28 AM lo 0.00 0.00 0.00 0.00 0.00
0.0
0 0.00
03:39:28 AM eth0 50.20 1.80 9798.20 526.60 0.00
0.0
0 0.00
03:39:28 AM IFACE rxpck/s txpck/s rxbyt/s txbyt/s rxcmp/s
txcmp/
s rxmcst/s
03:39:33 AM lo 0.00 0.00 0.00 0.00 0.00
0.0
0 0.00
03:39:33 AM eth0 38.20 1.80 8882.60 400.80 0.00
0.0
0 0.00
Average: IFACE rxpck/s txpck/s rxbyt/s txbyt/s rxcmp/s
txcmp/
s rxmcst/s
Average: lo 0.00 0.00 0.00 0.00 0.00
0.0
0 0.00
Average: eth0 41.73 1.20 9031.00 312.73 0.00
0.0
0 0.00
Information about networking errors can be displayed with sar -n EDEV. Table 3-5 lists the fields displayed.
# sar -n EDEV 5 3
Linux 2.4.21-20.EL (fisher) 04/17/2005
10:41:44 AM IFACE rxerr/s txerr/s coll/s rxdrop/s txdrop/s
txcarr/s rxfram/s rxfifo/s txfifo/s
10:41:49 AM lo 0.00 0.00 0.00 0.00 0.00
0.00 0.00 0.00 0.00
10:41:49 AM eth0 0.00 0.00 0.00 0.00 0.00
0.00 0.00 0.00 0.00
10:41:49 AM IFACE rxerr/s txerr/s coll/s rxdrop/s txdrop/s
txcarr/s rxfram/s rxfifo/s txfifo/s
10:41:54 AM lo 0.00 0.00 0.00 0.00 0.00
0.00 0.00 0.00 0.00
10:41:54 AM eth0 0.00 0.00 0.00 0.00 0.00
0.00 0.00 0.00 0.00
10:41:54 AM IFACE rxerr/s txerr/s coll/s rxdrop/s txdrop/s
txcarr/s rxfram/s rxfifo/s txfifo/s
10:41:59 AM lo 0.00 0.00 0.00 0.00 0.00
0.00 0.00 0.00 0.00
10:41:59 AM eth0 0.00 0.00 0.00 0.00 0.00
0.00 0.00 0.00 0.00
Average: IFACE rxerr/s txerr/s coll/s rxdrop/s txdrop/s
txcarr/s rxfram/s rxfifo/s txfifo/s
Average: lo 0.00 0.00 0.00 0.00 0.00
0.00 0.00 0.00 0.00
Average: eth0 0.00 0.00 0.00 0.00 0.00
0.00 0.00 0.00 0.00

The SOCK argument displays IPCS socket information. Table 3-6 lists the fields displayed and their meanings.
# sar -n SOCK 5 3
Linux 2.4.21-144-default (sawnee) 04/17/05
16:00:56 totsck tcpsck udpsck rawsck ip-frag
16:01:01 117 11 8 0 0
16:01:06 117 11 8 0 0
16:01:11 117 11 8 0 0
Average: 117 11 8 0 0

sar can generate many other reports. It is worth reading through the sar(1) man page to see whether there are any others you want to start using.
vmstat
The vmstat command is yet another way to show Linux performance metrics. vmstat reports a lot of information, and it can be difficult to understand what it is telling you.
The output is separated into six categories: process, memory, swap, I/O, system, and CPU. Like iostat, the first sample is an average since the last reboot. Here is a typical vmstat output:
# vmstat -m 5 3
procs memory swap io system cpu
r b swpd free buff cache si so bi bo in cs us sy wa id
3 0 185 23 136 3679 0 0 9 10 0 4 8 18 10 17
1 0 185 22 136 3676 0 0 285 76 2671 28571 18 19 0 63
1 0 185 22 136 3670 0 0 333 41 2876 24252 36 17 0 46
The -m option causes the memory fields to be shown in megabytes. vmstat takes the sample interval and count parameters as many of the other performance commands do.
The process (procs) information has two columns. The r column is the number of runable processes. The b column is the number of blocked processes.
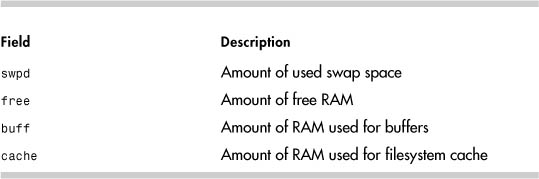
The memory section has four fields reporting how virtual memory is used. Table 3-7 lists them along with their meaning.
Table 3-7. vmstat memory Fields
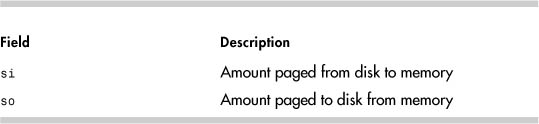
Next up are the swap metrics. Swap is an obsolete term but one that apparently won’t go away. A swap involves paging all the memory consumed by a process to or from disk at one time. What a performance hit this would be. What Linux does instead is page to and from disk as needed in small chunks. Thus, we should probably stop saying memory swapped to disk and start saying memory paged to disk. Either way, Table 3-8 explains the fields.
Table 3-8. vmstat swap Fields
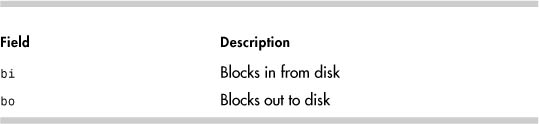
After swap are the two I/O fields. This section provides a short summary to help you determine whether Linux is busy doing a lot of disk I/O. vmstat only provides two fields showing the volume of data moving to and from disk (see Table 3-9).
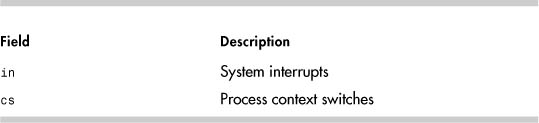
The system fields provide a summary of how busy the Linux kernel is performing process management. Interrupts and context switches are listed (see Table 3-10). A context switch is the moving of a process off of or onto a CPU.
Table 3-10. vmstat system Fields
Lastly, CPU state information is expressed as a percentage of total CPU time, as shown in Table 3-11.
Table 3-11. vmstat cpu Fields

iostat
The iostat command is another tool for looking at disk throughput. Just like sar, iostat can be given the interval and count arguments. The output for the first interval contains metrics for the entire time Linux has been running. This is probably the most unique feature of iostat compared to other performance commands. The following output, from a system that is mostly idle, is a good example. You can see that the hda device has read about 9158MB (18755572*512/1024/1024) since boot up. The Blk columns are 512-byte blocks.
# iostat 5 3
Linux 2.4.21-27.EL (fisher) 04/24/2005
avg-cpu: %user %nice %sys %iowait %idle
0.47 12.72 2.18 1.16 83.47
Device: tps Blk_read/s Blk_wrtn/s Blk_read Blk_wrtn
hda 6.61 93.98 238.64 18755572 47627302
hda1 0.00 0.06 0.00 11394 78
hda2 6.60 93.83 238.53 18726682 47604696
hda3 0.01 0.09 0.11 17176 22528
hdb 0.65 66.86 0.22 13344250 44336
hdb1 0.65 66.86 0.22 13344130 44336
avg-cpu: %user %nice %sys %iowait %idle
0.00 0.00 0.20 0.00 99.80
Device: tps Blk_read/s Blk_wrtn/s Blk_read Blk_wrtn
hda 0.40 0.00 20.80 0 104
hda1 0.00 0.00 0.00 0 0
hda2 0.40 0.00 20.80 0 104
hda3 0.00 0.00 0.00 0 0
hdb 0.00 0.00 0.00 0 0
hdb1 0.00 0.00 0.00 0 0
avg-cpu: %user %nice %sys %iowait %idle
0.00 0.00 0.00 0.00 100.00
Device: tps Blk_read/s Blk_wrtn/s Blk_read Blk_wrtn
hda 0.40 0.00 8.00 0 40
hda1 0.00 0.00 0.00 0 0
hda2 0.40 0.00 8.00 0 40
hda3 0.00 0.00 0.00 0 0
hdb 0.00 0.00 0.00 0 0
hdb1 0.00 0.00 0.00 0 0
With no options, iostat only shows one set of metrics that cover the entire time since boot up.
The CPU information contains basically the same fields as top. The iostat CPU output shows the percentage of time the CPU was executing in user mode, executing niced processes, executing in kernel (system) mode, idle with processes waiting for an I/O to complete, and idle with no processes waiting. The CPU line is a summary for all CPUs.
The disk information is similar to what sar -d provides. The output contains the number of transfers per second (tps), 512-byte block reads per second (Blk_read/s), 512-byte block writes per second (Blk_wrtn/s), and the total number of 512-byte blocks read (Blk_read) and written (Blk_wrtn).
iostat offers several switches to tailor output. Some of the most useful are:
-c Display only CPU line
-d Display disk lines
-k Display disk output in kilobytes
-t Include timestamp in output
-x Include extended disk metrics in output
These options can be combined. The output from iostat -tk 5 2 is:
# iostat -tk 5 2
Linux 2.4.21-27.EL (fisher) 04/24/2005
Time: 04:34:19 PM
avg-cpu: %user %nice %sys %iowait %idle
0.46 12.67 2.17 1.16 83.53
Device: tps kB_read/s kB_wrtn/s kB_read kB_wrtn
hda 6.59 46.81 118.90 9377806 23822991
hda1 0.00 0.03 0.00 5697 39
hda2 6.58 46.73 118.85 9363361 23811688
hda3 0.01 0.04 0.06 8588 11264
hdb 0.65 33.30 0.11 6672125 22168
hdb1 0.65 33.30 0.11 6672065 22168
Time: 04:34:24 PM
avg-cpu: %user %nice %sys %iowait %idle
0.00 0.00 0.20 0.00 99.80
Device: tps kB_read/s kB_wrtn/s kB_read kB_wrtn
hda 0.40 0.00 10.40 0 52
hda1 0.00 0.00 0.00 0 0
hda2 0.40 0.00 10.40 0 52
hda3 0.00 0.00 0.00 0 0
hdb 0.00 0.00 0.00 0 0
hdb1 0.00 0.00 0.00 0 0
free
The free command outputs memory and swap information, much as the top command does. With no options, free shows the information in kilobytes:
# free
total used free shared buffers cached
Mem: 511996 501616 10380 0 60224 359336
-/+ buffers/cache: 82056 429940
Swap: 105832 884 104948
The free command has a handful of options. We recommend -mt. The -m switch causes the output to be in megabytes, and the -t switch provides a total line:
# free -mt
total used free shared buffers cached
Mem: 499 489 10 0 58 350
-/+ buffers/cache: 80 419
Swap: 103 0 102
Total: 603 490 112
Summary
As this chapter shows, the performance tools available in Linux overlap a lot in the information they provide. Memory information can be displayed with top, vmstat, free, and sar, for example. A system administrator doesn’t need to be an expert in all the tools. However, it is important to know how to find and interpret all the performance information you need, no matter which tools you decide to use. Thus, we recommend spending a lot of time getting familiar with the tools and their output.
Endnotes
1 The terms processes and tasks are used interchangeably. See Chapter 8, “Linux Processes: Structures, Hangs, and Core Dumps,” for more information.
2 The cron lines are taken from http://perso.wanadoo.fr/sebastien.godard/use_en.html.