
Chapter 11. Lucene administration and performance tuning
- Tuning for performance
- Effectively using threads
- Managing disk, file descriptors, memory usage
- Backing up and restoring your index
- Checking an index for corruption and repairing it
- Understanding common errors
You’ve seen diverse examples of how to use Lucene for indexing and searching, including many advanced use cases. In this chapter we cover the practical, hands-on administrative aspects of Lucene. Some say administrative details are a mundane and necessary evil, but at least one of your beloved authors would beg to differ! A well-tuned Lucene application is like a well-maintained car: it will operate for years without problems, requiring only a small, informed investment on your part. You can take pride in that! This chapter gives you all the tools you need to keep your Lucene application in tip-top shape.
Lucene has great out-of-the-box performance, but for some demanding applications, this is still not good enough. Fear not! There are many fun ways to tune for performance. Adding threads to your application is often effective, but the added complexity can make it tricky. We’ll show you some simple drop-in classes that hide this complexity. Most likely you can tune Lucene to get the performance you need. We’ll explore using hands-on examples for measuring performance.
Beyond performance, people are often baffled by Lucene’s consumption of resources like disk space, file descriptors, and memory. Keeping tabs on this consumption over time as your index grows and application evolves is necessary to prevent sudden catastrophic problems. Fortunately, Lucene’s use of these resources is simple to predict once you understand how. Armed with this information, you can easily prevent many problems.
Of course, what good is great performance if you have no more search index? Despite all your preventive efforts, things will eventually go wrong (thank you, Murphy’s Law), and restoring from backup will be your only option. Lucene includes built-in support for making a hot backup of your index, even while you’re still adding documents to it. You have no excuse to delay—just a bit of planning ahead will save you a lot of trouble later.
So, roll up your sleeves: it’s time to get your hands dirty! Let’s jump right in with performance tuning.
11.1. Performance tuning
Many applications achieve awesome performance with Lucene, out of the box. But you may find that as your index grows larger, and as you add new features to your application, or even as your website gains popularity and must handle higher and higher traffic, performance could eventually become an issue. Fortunately, you can try a number of things to improve Lucene’s performance.
But first, be sure your application really does need faster performance from Lucene. Performance tuning can be a time-consuming and, frankly, rather addictive affair. It can also add complexity to your application, which may introduce bugs and make your application more costly to maintain. Ask yourself, honestly (use a mirror, if necessary): would your time be better spent improving the user interface or tuning relevance? You can always improve performance by simply rolling out more or faster hardware, so always consider that option first. Never sacrifice user experience in exchange for performance: keeping users happy, by providing the best experience humanly and “computerly” possible, should always be your top priority. These are the costs of performance tuning, so before you even start make sure you do need better performance. Still have your heart set on tuning performance? No problem: read on!
We’ll begin with some basic steps you should always try no matter which performance metric you’re optimizing for. Then, assuming you still require further tuning, we touch briefly on best practices for testing methodology. Without a solid and disciplined approach to testing, you have no way to measure your progress. Finally, we’ll visit each of the important performance metrics in search applications: index-to-search delay, indexing throughput, search latency, and search throughput. We’ll enumerate options to tune for each of these.
Which metric is important depends on your application and can vary with time. Often, indexing throughput is crucial while you’re first building your index but then once the initial index is complete, index-to-search latency and search latency become more important. Be sure you know which metric matters to you because tuning for one is frequently at the expense of another! Trade-offs abound.
Let’s begin with some simple steps to improve all metrics.
11.1.1. Simple performance-tuning steps
Before jumping into specific metrics, there are some simple steps that you should always follow regardless of what specific metric you need to tune:
- Use a solid-state disk (SSD), not magnetic platters, as your underlying storage device. Although solid-state disks are quite a bit more expensive per gigabyte, the stunning performance gains make the trade-off a no-brainer for most applications, and the price premium is quickly dropping with time.
- Upgrade to the latest release of Lucene. Lucene is always getting better: performance is improved, bugs are fixed, and new features are added. In version 2.3 in particular there were numerous optimizations to indexing, and version 2.9 has many optimizations for searching. The Lucene development community has a clear commitment to backward compatibility of the API: it’s strictly kept across minor releases (such as 3.1 to 3.2) but not necessarily across major releases (such as 3.x to 4.x). A new minor release should just be a drop-in, so go ahead and try it!
- Upgrade to the latest release of Java; then try tuning the JVM’s performance settings.
- Run your JVM with the -server switch; this generally configures the JVM for faster net throughput over time but at a possibly higher startup cost.
- Use a local file system for your index. Local file systems are generally quite a bit faster than remote ones. If you’re concerned about local hard drives crashing, use a RAID array with redundancy. In any event, be sure to make backups of your index (see section 11.4): someday, something will inevitably go horribly wrong.
- Run a Java profiler, or collect your own rough timing using System.nanoTime, to verify your performance problem is in fact Lucene and not elsewhere in your application stack. For many applications, loading the document from a database or file system, filtering the raw document into plain text, and tokenizing that text, is time consuming. During searching, rendering the results from Lucene might be time consuming. You might be surprised!
- Do not reopen IndexWriter or IndexReader/IndexSearcher any more frequently than required. Share a single instance for a long time and reopen only when necessary.
- Use multiple threads. Modern computers have amazing concurrency in CPU, I/O, and RAM, and that concurrency is only increasing with time. Section 11.2 covers the tricky details when using threads.
- Use faster hardware. Fast CPU and fast I/O system (for large indices) will always help.
- Put as much physical memory as you can in your computers, and configure Lucene to take advantage of all of it (see section 11.3.3). But be sure Lucene isn’t using so much memory that your computer is forced to constantly swap or the JVM is forced to constantly run garbage collection (GC).
- Budget enough memory, CPU, and file descriptors for your peak usage. This is typically when you’re opening a new searcher during peak traffic perhaps while indexing a batch of documents.
- Turn off any fields or features that your application isn’t using. Be ruthless!
- Group multiple text fields into a single text field. Then, you can search only that one field.
These best practices will take you a long ways toward better performance. It could be, after following these steps, you’re done: if so, congratulations! If not, don’t fear: there are still many options to try. We first need a consistent approach to testing performance.
11.1.2. Testing approach
You’ll need to set up a simple repeatable test that allows you to measure the specific metrics you want to improve. Without this you can’t know if you’re improving things. The test should accurately reflect your application. Try to use true documents from your original content, and actual searches from your search logs, if available. Next, establish a baseline of your metric. If you see high variance on each run, you may want to run the test three or more times and record the best result (which is typically less noisy).
Finally, take an open-minded iterative approach: performance tuning is empirical and often surprising. Let the computer tell you what works and what doesn’t. Make one change at a time, test it, and keep it only if the metric improved. Don’t fall in love with some neat tuning before it demonstrates its value! Some changes will unexpectedly degrade performance, so don’t keep those. Make a list of ideas to try, and sort them according to your best estimate of “bang for the buck”: those changes that are quick to test and could be the biggest win should be tested first. Once you’ve improved your metric enough, stop and move on to other important things. You can always come back to your list later and keep iterating.
If all else fails, take your challenge to the Lucene java users list ([email protected]). More than likely someone has already encountered and solved something similar to your problem and your question can lead to healthy discussion on how Lucene could be improved.
For our testing in this chapter we’ll use the framework in contrib/benchmark, described in more detail in appendix C. This is an excellent tool for creating and running repeatable performance tests. It already has support for multiple runs of each test, changing Lucene configuration parameters, measuring metrics, and printing summary reports of the full test run. There are a large set of built-in tasks and document sources to choose from. Extending the framework with your own task is straightforward. You simply write an algorithm (.alg) file, using a simple custom scripting language, to describe the test. Then run it like this:
cd contrib/benchmark
ant run-task -Dtask-alg=<file.alg> -Dtask.mem=XXXM
That code prints great details about the metrics for each step of your test. Algorithm files also make it simple for others to reproduce your test results: you just send it to them and they run it!
Apples and Oranges
When running indexing tests, there are a couple things you need to watch out for. First, because Lucene periodically merges segments, when you run two indexing tests with different settings it’s quite possible that each resulting index could end in a different merge state. Maybe the first index has only 3 segments in it, because it just completed a large merge, and the other index has 17 segments. It’s not fair to compare metrics from these two tests because in the first case Lucene did more work to make the index more compact. You’re comparing apples and oranges.
To work around this, you could set mergeFactor to an enormous number, to turn off merging entirely. This will make the tests at least comparable, but just remember that the resulting numbers aren’t accurate in an absolute sense, because in a real application you can’t turn off merging. This is only worthwhile if you aren’t trying to compare the cost of merging in the first place.
The second issue is to make sure your tests include the time it takes to call close on the IndexWriter. During close, IndexWriter flushes documents, may start new merges, and waits for any background merges to finish. Try to write your algorithm files so that the CloseIndex task is included in the report.
Let’s look at specific metrics that you may need to tune.
11.1.3. Tuning for index-to-search delay
Index-to-search delay is the elapsed time from when you add, update, or delete documents in the index, until users see those changes reflected in their searches. For many applications, this is an important metric. But because a reader always presents the index as of the “point in time” when it was opened, the only way to reduce index-to-search delay is to reopen your reader more frequently.
Fortunately, the new near-real-time search feature added in Lucene 2.9, described in sections 2.8 and 3.2.5, is effective at keeping this turnaround time to a minimum, in practice often in the tens of milliseconds. After making changes using IndexWriter, you open a new reader by calling IndexWriter.getReader() or by using the previously obtained IndexReader’s reopen method. But reopening the reader too frequently will slow down your indexing throughput as IndexWriter must flush its buffer to disk every time. Here are some tips for reducing the turnaround time:
- Call IndexWriter.setMergedSegmentWarmer to have IndexWriter warm up newly merged segments before making them available for searching. While this warming is happening (it takes place in a background thread as long as you’re using the default ConcurrentMergeScheduler), new near-real-time readers can continue to be opened, using the segments from before the merge. This is especially important on completion of a large segment merge; it will reduce the subsequent latency on new searches against the near-real-time reader.
- Try switching IndexWriter to the BalancedMergePolicy, available in the miscellaneous contrib module (briefly covered in section 9.10). This MergePolicy was designed to minimize very large segment merges, which, because they are so CPU and I/O intensive, can have an adverse effect on search performance.
- Possibly set IndexWriter’s maxBufferedDocs to something small. That way, even when you aren’t reopening the near-real-time reader, small segments are still being flushed. Although this may reduce your net indexing rate, in practice it also keeps reopen time to a minimum.
- If you know you’re only adding documents, be sure to use addDocument, not updateDocument. There’s a cost when using updateDocument, even if the specified term doesn’t delete any documents: the IndexWriter must search for each deleted term while creating the new near-real-time reader.
On the bright side, many applications only require high indexing throughput while creating the initial index or doing bulk updates. During this time, the index-to-search latency doesn’t matter because no searching is happening. But then once the index is built and in use in the application, the rate of document turnover is often low, while index-to-search latency becomes important. Next we’ll see how to tune Lucene for high indexing throughput.
11.1.4. Tuning for indexing throughput
Indexing throughput measures how many documents per second you’re able to add to your index, which determines how much time it will take to build and update your index. In the benchmark framework there are several built-in content sources we could choose from, including the Reuters corpus (ReutersContentSource), Wikipedia articles (EnwikiContentSource), and a simple document source that recursively finds all *.txt files under a directory (DirContentSource). We’ll use Wikipedia as the document source for all our tests. This is obviously a large and diverse collection, so it makes for a good real-world test. For your own tests, create a document source subclassing ContentSource, and then use it for all your testing.
To minimize the cost of document construction, let’s first preprocess the Wikipedia XML content into a single large text file that contains one article per line. We’ll be following the steps shown in figure 11.1. There’s a built-in WriteLineDoc task for exactly this purpose. Download the latest Wikipedia export from http://wikipedia.org. Leave it compressed as a bzip2 (.bz2) file; the benchmark framework can decompress it on the fly.
Figure 11.1. Steps to test indexing throughput on Wikipedia articles

Next, save the following algorithm to createLineFile.alg:
content.source = org.apache.lucene.benchmark.byTask.feeds.EnwikiContentSource
docs.file = /x/lucene/enwiki-20090724-pages-articles.xml.bz2
line.file.out = wikipedia.lines.txt
content.source.forever = false

{WriteLineDoc() >: *
This algorithm uses the built-in EnwikiContentSource, which knows how to parse the XML format from Wikipedia, to produce one document at a time. Then, it runs the WriteLineDoc task over and over until there are no more documents, saving each document line by line to the file wikipedia.lines.txt.
Execute this by running ant run-task -Dtask.alg=createLineFile.alg in a shell. It will take some time to run. Sit back and enjoy the sound of hard drives seeking away doing all the hard work for you—that is, if you’re still not using a solid-state drive. It will print how many documents have been processed as it’s running, and at the end will produce a large file, wikipedia.lines.txt, with one document per line. Great! Wasn’t that easy?
Now that we’re done with the onetime setup, let’s run a real test, using the efficient LineDocSource as our content source. For the following tests, it’s best to store wikipedia. lines.txt on a separate drive from the contrib/benchmark/work/index directory where the index is created so the I/O for reading the articles doesn’t interfere with the I/O for writing the index. Go ahead and run the algorithm shown in listing 11.1.
Listing 11.1. Testing indexing throughput using Wikipedia documents
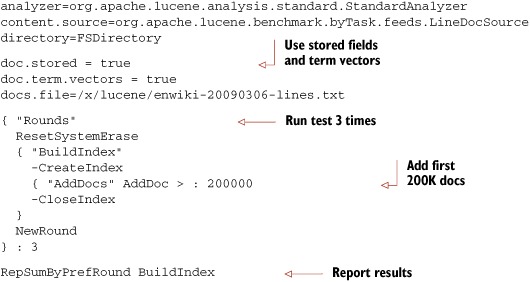
This algorithm builds an index with the first 200,000 Wikipedia articles, three times, using StandardAnalyzer. At the end it prints a one-line summary of each run. If you were building a real index for Wikipedia, you should use an analyzer base on the Wikipedia tokenizer under contrib/wikipedia. This tokenizer understands the custom elements of Wikipedia’s document format such as [[Category:...]]. Because we’re only measuring indexing throughput here, StandardAnalyzer is fine for our purposes. You should see something like this as your final report:
Operation round runCnt recsPerRun rec/s elapsedSec avgUsedMem avgTotalMem
BuildIndex    0      1     200000 550.7     363.19 33,967,816  39,915,520
BuildIndex -  1  -   1  -  200000 557.3  -  358.85 24,595,904  41,435,136
BuildIndex    2      1     200000 558.4     358.17 23,531,816  41,435,136
Discarding the slowest and fastest run, our baseline indexing throughput is 557.3 documents/second. Not too shabby! As of Lucene 2.3, the out-of-the-box default indexing throughput has improved substantially. Here are some specific things to try to further improve your application’s indexing throughput:
- Use many threads. This could be the single biggest impact change you can make, especially if your computer’s hardware has a lot of concurrency. See section 11.2.1 for a drop-in threaded replacement for IndexWriter.
- Set IndexWriter to flush by memory usage and not document count. This is the default as of version 2.3, but if your application still calls setMaxBufferedDocs, change it to setRAMBufferSizeMB instead. Test different RAM buffer sizes. Typically larger is better, to a point. Make sure you don’t go so high that the JVM is forced to GC too frequently, or the computer is forced to start swapping (see 11.3.3). Use the option ram.flush.mb in your algorithm to change the size of IndexWriter’s RAM buffer.
- Turn off compound file format (IndexWriter.setUseCompoundFile(false)). Creating a compound file takes some time during indexing. You’ll also see a small performance gain during searching. But note that this will require many more file descriptors to be opened by your readers (see 11.3.2), so you may have to decrease mergeFactor to avoid hitting file descriptor limits. Set compound=false in your algorithm to turn off compound file format.
- Reuse Document and Field instances. As of version 2.3, a Field instance allows you to change its value. If your documents are highly regular (most are), create a single Document instance and hold onto its Field instances. Change only the Field values, and then call addDocument with the same Document instance. The DocMaker is already doing this, but you can turn it off by adding doc.reuse.fields=false to your algorithm.
- Test different values of mergeFactor. Higher values mean less merging cost while indexing, but slower searching because the index will generally have more segments. Beware: if you make this too high, and if compound file format is turned off, you can hit file descriptor limits on your OS (see section 11.3.2). As of version 2.3, segment merging is done in the background during indexing, so this is an automatic way to take advantage of concurrency. You may see faster performance with a high mergeFactor. But if you optimize the index in the end, a low mergeFactor should be faster as the merges will tend to be done concurrently while you’re indexing. Test high and low values in your application and let the computer tell you which is best: you might be surprised!
- Use optimize sparingly; use the optimize(maxNumSegments) method instead. This method optimizes your index down to maxNumSegments (instead of always one segment), which can greatly reduce the cost of optimizing while still making your searches quite a bit faster. Optimizing takes a long time. If your searching performance is acceptable without optimizing, consider never optimizing.
- Index into separate indices, perhaps using different computers, and then merge them with IndexWriter.addIndexesNoOptimize. Don’t use the older addIndexes methods; they make extra, often unnecessary, calls to optimize.
- Test the speed of creating the documents and tokenizing them by using the ReadTokens task in your algorithm. This task steps through each field of the document and tokenizes it using the specified analyzer.
The document isn’t indexed. This is an excellent way to measure the document construction and tokenization cost alone. Run
this algorithm to tokenize the first 200K docs from Wikipedia using StandardAnalyzer:
analyzer=org.apache.lucene.analysis.standard.StandardAnalyzer
content.source=org.apache.lucene.benchmark.byTask.feeds.LineDocSource
docs.file=/x/lucene/enwiki-20090306-lines.txt
{ "Rounds"
ResetSystemErase
{ ReadTokens > : 200000
NewRound
} : 3
RepSumByPrefRound ReadTokens which produces output like this:
Operation round run recsPerRun rec/s elapsedSec avgUsedMem avgTotalMem
ReadTokens_N 0 1 161783312 1,239,927.9 130.48 2,774,040 2,924,544
ReadTokens_N 1 - 1 161783312 1,259,857.2 - 128.41 2,774,112 - 2,924,544
ReadTokens_N 2 1 161783312 1,253,862.0 129.03 2,774,184 2,924,544 - Discarding the fastest and slowest runs, we see that simply retrieving and tokenizing the documents takes 129.03 seconds, which is about 27 percent of the total indexing time from our baseline. This number is very low, because we’re using LineDocSource as our content source. In a real application, creating, filtering, and tokenizing the document would be much more costly. Try it with your own ContentSource!
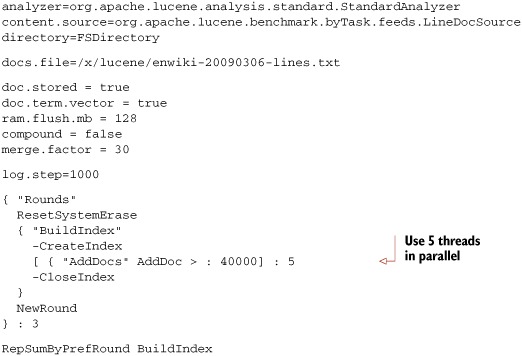
Let’s combine the previous suggestions. We’ll index the same 200,000 documents from Wikipedia but change the settings to try to improve indexing throughput. We’ll turn off compound, increase mergeFactor to 30 and ram.flush.mb to 128, and use five threads to do the indexing. The resulting algorithm file is shown in listing 11.2.
Listing 11.2. Indexing with threads, compound, extra RAM, and larger mergeFactor
Running list 11.2 will produce output like this:
Operation round runCnt recsPerRun rec/s elapsedSec  avgUsedMem avgTotalMem
BuildIndex    0      1     200000 879.5     227.40 166,013,008 205,398,016
BuildIndex  - 1  -   1  -  200000 899.7  -  222.29 167,390,016 255,639,552
BuildIndex    2      1     200000 916.8     218.15 174,252,944 276,684,800
Wow, the performance is even better: 899.7 documents per second! In your testing you should test each of these changes, one at a time, and keep only those that help.
There you have it! As we’ve seen, Lucene’s out-of-the-box indexing throughput is excellent. But with some simple tuning ideas, you can make it even better. Let’s look at search performance next.
11.1.5. Tuning for search latency and throughput
Search latency measures how long users must wait to see the results of their search. A user should never wait more than one second for search results, and ideally much less. Go run some Google searches and see how long you have to wait. Search throughput measures how many searches per second your application can service. These metrics, search latency and throughput, are two sides of one coin: improvements to search latency will also improve your search throughput, on the same hardware. It is a zero sum game, assuming you’re running enough threads to fully saturate all resources available on the computer, which you definitely should!
The best way to measure your search latency and throughput is with a standalone load-testing tool, such as The Grinder or Apache JMeter. Such tools do a great job simulating multiple users and reporting latency and throughput results. They also test your application end to end, which is what a real user experiences when using your website. This is important, as it’s common to pick up unexpected latency in the process of submitting the search, the processing performed by your web and application servers, the rendering of results performed by your application, the final HTML rendering in the web browser, and so forth. Remember that there are many cumulative delays in a modern search application, so be sure to measure all steps before and after Lucene is invoked to confirm that it’s really Lucene that needs tuning.
Try to use real searches from real users when running search performance tests. If possible, cull search logs to get all searches, and run them in the same order and timing from the search logs. Use multiple threads to simulate multiple users, and verify you’re fully utilizing the computer’s concurrency. Include follow-on searches, like clicking through pages, in the test. The more “real world” your test is, the more accurate your test results are. For example, if you create your own small set of hand-crafted searches for testing, and run these over and over, you can easily see unexpectedly excellent performance because the OS has loaded all required bytes from disk into its I/O cache. To fix this, you may be tempted to flush the I/O cache before each test, which is possible. But then you’re going too far in the other direction, by penalizing your results too heavily, since in your real application the I/O cache would legitimately help your performance.
Here are some steps to improve search performance:
- Use a read-only IndexReader, by calling IndexReader.open(dir) or IndexReader.open(dir, true) (read-only is the default). Read-only IndexReaders have better concurrency because they can avoid synchronizing on certain internal data structures. This is now the default when you open an IndexReader.
- If you’re not on Windows, use NIOFSDirectory, which has better concurrency, instead of FSDirectory. If you’re running with a 64-bit JVM, try MMapDirectory as well.
- Make sure each step between the user and Lucene isn’t adding unnecessary latency. For example, make sure your request queue is first-in, first-out and that all threads pull from this queue, so searches are answered in the order they originally arrived. Verify that rendering the results returned by Lucene is fast.
- Be sure you’re using enough threads to fully utilize the computer’s hardware (see section 11.2.2 for details). Increase the thread count until throughput no longer improves, but don’t add so many threads that latency gets worse. There’s a sweet spot—find it!
- Warm up your searchers before using them on real searches. The first time a certain sort is used, it must populate the FieldCache. Prewarm the searching by issuing one search for each of the sort fields that may be used (see section 11.1.2).
- Use FieldCache instead of stored fields, if you can afford the RAM. FieldCache pulls all stored fields into RAM, whereas stored fields must go back to disk for every document. Populating a FieldCache is resource-consuming (CPU and I/O), but it’s done only once per field the first time it’s accessed. Once it’s populated, accessing it is very fast as long as the OS doesn’t swap out the JVM’s memory.
- Decrease mergeFactor so there are fewer segments in the index.
- Turn off compound file format.
- Limit your use of term vectors: retrieving them is quite slow. If you must, do so only for those hits that require it. Use TermVectorMapper (see section 5.9.3) to carefully select only the parts of the term vectors that you need.
- If you must load stored fields, use FieldSelector (see section 5.10) to restrict fields to exactly those that you need. Use lazy field loading for large fields so that the contents of the field are only loaded when requested.
- Run optimize or optimize(maxNumSegments) periodically on your index.
- Only request as many hits as you require.
- Only reopen the IndexReader when it’s necessary.
- Call query. rewrite().toString() and print the result. This is the actual query Lucene runs. You might be surprised to see how queries like FuzzyQuery and TermRangeQuery rewrite themselves!
- If you’re using FuzzyQuery (see section 3.4.8), set the minimum prefix length to a value greater than 0 (e.g., 3). Then you can increase the minimumSimilarity.
Note that quite a few of these options are in fact detrimental to indexing throughput: they’re automatically at odds with one another. You have to find the right balance for your application.
We’re done with performance tuning! You’ve seen how to measure performance, including the often conflicting metrics, and the many ways to tune Lucene’s performance for different metrics. Next we’ll see how to use threads to gain concurrency.
11.2. Threads and concurrency
Modern computers have highly concurrent hardware. Moore’s law lives on, but instead of giving us faster clock speeds, we get more CPU cores. It’s not just the CPU. Hard drives now provide native command queuing, which accepts many I/O requests at once and reorders them to make more efficient use of the disk heads. Even solid state disks do the same, and go further by using multiple channels to concurrently access the raw flash storage. The interface to RAM uses multiple channels. Then, there’s concurrency across these resources: when one thread is stuck waiting for an I/O request to complete, another thread can use the CPU, and you’ll gain concurrency.
Therefore, it’s critical to use threads for indexing and searching. Otherwise, you’re simply not fully utilizing the computer. It’s like buying a Corvette and driving it no faster than 20 mph! Likely, switching to using threads is the single change you can make that will increase performance the most. You’ll have to empirically test to find the right number of threads for your application and trade off search or indexing latency and throughput. Generally, at first, as you add more threads, you’ll see latency stay about the same but throughput will improve. Then when you hit the right number of threads, adding more won’t improve throughput and may hurt it somewhat due to context switching costs. But latency will increase.
Unfortunately, there’s the dark side to threads, which if you’ve explored them in the past you’ve no doubt discovered: they can add substantial complexity to your application. Suddenly you must take care to make the right methods synchronized (but not too many!), change your performance testing to use threads, manage thread pools, and spawn and join threads at the right times. You’ll spend lots of time reading the Javadocs in java.util.concurrent. Entirely new kinds of intermittent bugs become possible, such as deadlock if locks aren’t acquired in the same order by different threads or ConcurrentModificationException and other problems if you’re missing synchronization. Testing is difficult because the threads are scheduled at different times by the JVM every time you run a test. Are they really worth all this hassle?
Yes, they are! Lucene has been carefully designed to work well with many threads. Lucene is thread-safe: sharing IndexSearcher, IndexReader, IndexWriter, and so forth across multiple threads is perfectly fine. Lucene is also thread-friendly: synchronized code is minimized so that multiple threads can make full use of the hardware’s concurrency. In fact, as of version 2.3, Lucene already makes use of concurrency right out of the box: ConcurrentMergeScheduler merges segments using multiple background threads so that adding and deleting documents in IndexWriter isn’t blocked by merging. You can choose a merge scheduler in your algorithm by setting the merge.scheduler property. For example, to test indexing with the SerialMergeScheduler (which matches how segment merges were done before version 2.3), add merge.scheduler = org.apache.lucene.index.SerialMergeScheduler to your algorithm.
In this section we’ll show you how to leverage threads during indexing and searching, and provide a couple of drop-in classes to make it simple to gain concurrency.
11.2.1. Using threads for indexing
Figure 11.2 shows the design of a simple utility class, ThreadedIndexWriter, that extends IndexWriter and uses java.util.concurrent to manage multiple threads, adding and updating documents. The class simplifies multithreaded indexing because all details of these threads are hidden from you. It’s also a drop-in for anywhere you’re currently using the IndexWriter class, though you may need to modify it if you need to use one of IndexWriter’s expert constructors. Note that the class doesn’t override IndexWriter’s commit or prepareCommit methods, which means you’ll have to close it in order to commit all changes to the index.
Figure 11.2. ThreadedIndexWriter manages multiple threads for you.

The full source code is shown in listing 11.3. Specify how many threads to use, as well as the size of the queue, when you instantiate the class. Test different values to find the sweet spot for your application, but a good rule of thumb for numThreads is one plus the number of CPU cores in your computer that you’d like to consume on indexing, and then 4*numThreads for maxQueueSize. As you use more threads for indexing, you’ll find that a larger RAM buffer size should help even more, so be sure to test different combinations of number of threads and RAM buffer size to reach your best performance. Check process monitor tools, like top or ps on Unix, Task Manager on Windows, or Activity Monitor on Mac OS X to verify that CPU utilization is near 100 percent.
Listing 11.3. Drop-in IndexWriter class to use multiple threads for indexing
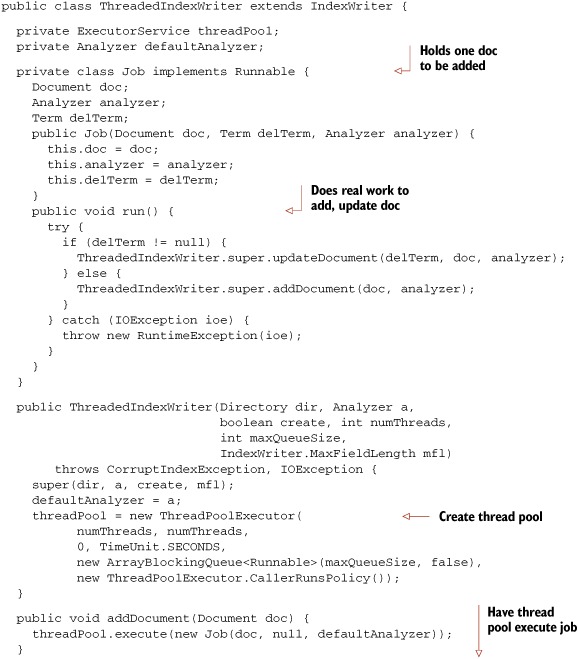
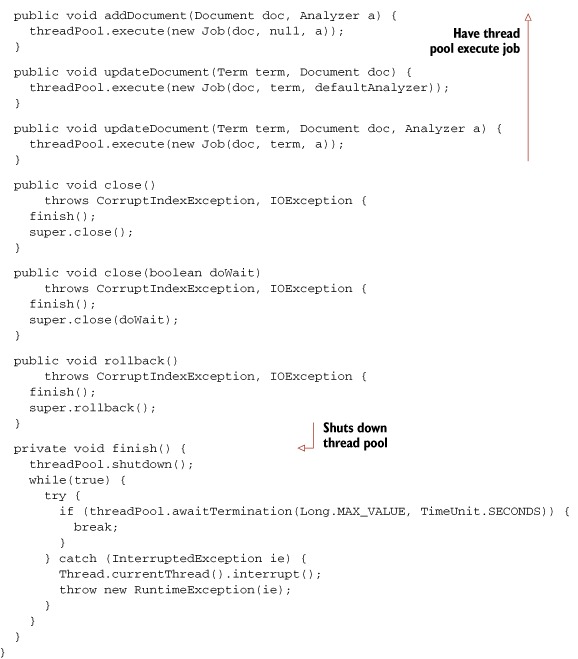
The class overrides the addDocument and updateDocument methods: when one of these is called, a Job instance is created and added to the work queue in the thread pool. If the queue in the thread pool isn’t full, control immediately returns back to the caller. Otherwise, the caller’s thread is used to immediately execute the job. In the background, a worker thread wakes up, takes jobs from the front of the work queue, and does the real work. When you use this class, you can’t reuse Document or Field instances, because you can’t control precisely when a Document is done being indexed. The class overrides close and rollback methods, to first shut down the thread pool to ensure all adds and updates in the queue have completed.
Let’s test ThreadedIndexWriter by using it in the benchmark framework, which makes it wonderfully trivial to extend with a new task. Make a CreateThreadedIndexTask.java, as shown in listing 11.4.
Listing 11.4. Adding a new custom task to contrib/benchmark
public class CreateThreadedIndexTask extends CreateIndexTask {

  public CreateThreadedIndexTask(PerfRunData runData) {
    super(runData);
  }

  public int doLogic() throws IOException {
    PerfRunData runData = getRunData();
    Config config = runData.getConfig();
    IndexWriter writer = new ThreadedIndexWriter(
                              runData.getDirectory(),
                              runData.getAnalyzer(),
                              true,
                              config.get("writer.num.threads", 4),
                              config.get("writer.max.thread.queue.size",
                                         20),
                              IndexWriter.MaxFieldLength.UNLIMITED);
    CreateIndexTask.setIndexWriterConfig(writer, config);
    runData.setIndexWriter(writer);
    return 1;
  }
}
Create an algorithm, derived from the baseline algorithm from section 11.2.3, with only these changes:
- Replace CreateIndex with CreateThreadedIndex.
- Add doc.reuse.fields = false, which tells DocMaker to not reuse fields.
- Optionally set writer.num.threads and writer.max.thread.queue.size to test different values.
Compile your CreateThreadedIndexTask.java, and run your algorithm like this so it knows where to find your new task:
ant run-task
  -Dtask.alg=indexWikiLine.alg
  -Dbenchmark.ext.classpath=/path/to/my/classes
You should see it finishes quite a bit faster than the original baseline. If your application already uses multiple threads while indexing, this class is unnecessary; this class is useful as a drop-in approach for taking advantage of threads in an application that doesn’t already use multiple threads during indexing. Now you can drop this class in wherever you now use IndexWriter and take advantage of concurrency. Let’s look next at using threads during searching.
11.2.2. Using threads for searching
Fortunately, a modern web or application server handles most of the threading issues for you: it maintains a first-in, first-out request queue, as well as a thread pool to service requests from the queue. This means much of the hard work is already done. All you have to do is create a query based on the details in the user’s request, invoke your IndexSearcher, and render the results. It’s so easy! If you aren’t running Lucene in a web application, the thread pool support in java.util.concurrent should help you.
Be sure you tune the size of the thread pool to make full use of the computer’s concurrency. Also, tune the maximum allowed size of the request queue for searching: when your website is suddenly popular and far too many searches per second are arriving, you want new requests to quickly receive an HTTP 500 Server Too Busy error, instead of waiting in the request queue forever. This also ensures that your application gracefully recovers once the traffic settles down again. Run a redline stress test to verify this.
There’s one tricky aspect that the application server won’t handle for you: reopening your searcher when your index has changed. Because an IndexReader only sees the index as of the point in time when it was opened, once there are changes to the index you must reopen your IndexReader to search them. Unfortunately, this can be a costly operation, consuming CPU and I/O resources. Yet, for some applications, minimizing index-to-search delay is worth that cost, which means you’ll have to reopen your searcher frequently.
Threads make reopening your searcher challenging, because you can’t close the old searcher until all searches are done with it, including iterating through the hits after IndexSearcher.search has returned. Beyond that, you may want to keep the old searcher around for long enough for all search sessions (the original search plus all follow-on actions like clicking through pages) to finish or expire. For example, consider a user who’s stepping through page after page of results, where each page is a new search on your server. If you suddenly swap in a new searcher in between pages, then the documents assigned to each page could shift, causing the user to see duplicate results across pages or to miss some results. This unexpected behavior can erode your user’s trust—pretty much the kiss of death for any search application. Prevent this by sending new pages for a previous search back to the original searcher when possible.
Listing 11.5 shows a useful utility class, SearcherManager, that hides the tricky details of reopening your searcher in the presence of multiple threads. It’s able to open readers either from a Directory instance, in cases where you don’t have direct access to the IndexWriter that’s making changes, or from an IndexWriter by obtaining a near-real-time reader (see section 3.2.5 for details on near-real-time search).
Listing 11.5. Safely reopening IndexSearcher in a multithreaded world
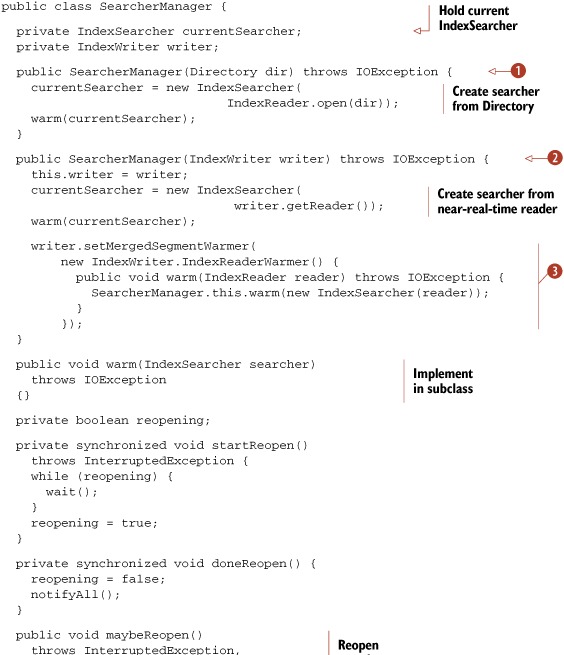
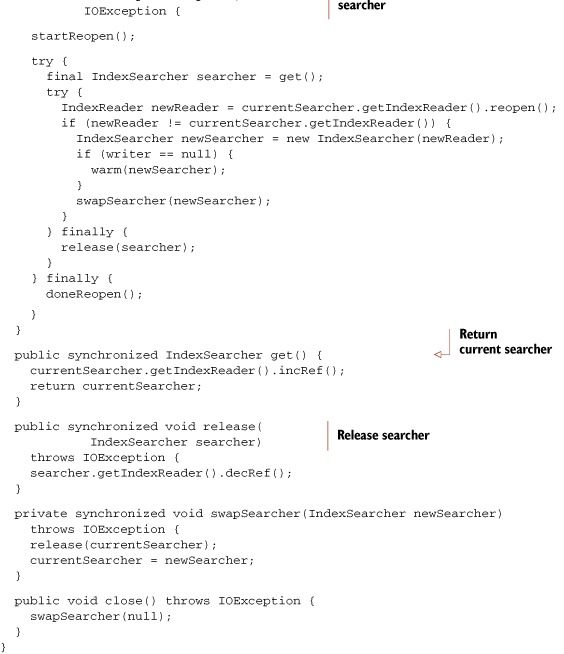
This class uses the IndexReader.reopen API to efficiently open a new IndexReader that may share some SegmentReaders internally with the previous one. Instantiate this class once in your application—for example, naming it searcherManager—and then use it for access to the IndexSearcher whenever you need to run a search. Note that the class never closes the IndexSearcher. This is fine because IndexSearcher.close() is a no-op if you’d provided an already opened IndexReader when creating the IndexSearcher, as we’ve done.
If you have direct access to the IndexWriter that’s making changes to the index, it’s best to use the constructor that accepts IndexWriter ![]() You’ll get faster reopen performance this way: SearcherManager uses IndexWriter’s near-real-time getReader API, and you don’t need to call IndexWriter.commit before reopening. SearcherManager also calls setMergedSegmentWarmer
You’ll get faster reopen performance this way: SearcherManager uses IndexWriter’s near-real-time getReader API, and you don’t need to call IndexWriter.commit before reopening. SearcherManager also calls setMergedSegmentWarmer ![]() to ensure that newly merged segments are passed to the warm method.
to ensure that newly merged segments are passed to the warm method.
Otherwise, use the constructor that takes a Directory instance ![]() , which will open the IndexSearcher directly. Whenever you need a searcher, do this:
, which will open the IndexSearcher directly. Whenever you need a searcher, do this:
IndexSearcher searcher = searcherManager.get()
try {
  // do searching & rendering here...
} finally {
  searcherManager.release(searcher);
}
Every call to get must be matched with a corresponding call to release, ideally using a try/finally clause.
Note that this class doesn’t do any reopening on its own. Instead, you must call maybeReopen every so often according to your application’s needs. For example, a good time to call this is after making changes with the IndexWriter. If you passed Directory into SearcherManager, be sure you first commit any changes from the IndexWriter before calling maybeReopen. You could also simply call maybeReopen during a search request, if upon testing you see the reopen time is fast enough. It’s also possible to call maybeReopen from a dedicated background thread. In any event, you should create a subclass that implements the warm method to run the targeted initial searches against the new searcher before it’s made available for general searching.
This concludes our coverage of using multiple threads with Lucene. Although adding threads to an application can sometimes bring unwanted complexity, the drop-in classes we provided should make it trivial to gain concurrency during indexing and searching. Let’s move on now to exploring how Lucene uses resources.
11.3. Managing resource consumption
Like all software, Lucene requires certain precious resources to get its job done. A computer has a limited supply of things like disk storage, file descriptors, and memory. Often Lucene must share these resources with other applications. Understanding how Lucene uses resources and what you can do to control this lets you keep your search application healthy. You might assume Lucene’s disk usage is proportional to the total size of all documents you’ve added, but you’ll be surprised to see that often this is far from the truth. Similarly, Lucene’s usage of simultaneous open file descriptors is unexpected: changes to a few Lucene configuration options can drastically change the number of required open files. Finally, to manage Lucene’s memory consumption, you’ll see why it’s not always best to give Lucene access to all memory on the computer.
Let’s start with everyone’s favorite topic: how much disk space does Lucene require? Next we’ll describe Lucene’s open file descriptor usage and, finally, memory usage.
11.3.1. Disk space
Lucene’s disk usage depends on many factors. An index with only a single pure indexed, typical text field will be about one third of the total size of the original text. At the other extreme, an index that has stored fields and term vectors with offsets and positions, with numerous deleted documents plus an open reader on the index, with an optimize running, can easily consume 10 times the total size of the original text! This wide range and seeming unpredictability makes it exciting to manage disk usage for a Lucene index.
Figure 11.3 shows the disk usage over time while indexing all documents from Wikipedia, finishing with an optimize call. The final disk usage was 14.2 GB, but the peak disk usage was 32.4 GB, which was reached while several large concurrent merges were running. You can immediately see how erratic it is. Rather than increasing gradually with time, as you add documents to the index, disk usage will suddenly ramp up during a merge and then quickly fall back again once the merge has finished, creating a sawtooth pattern. The size of this jump corresponds to how large the merge was (the net size of all segments being merged). Furthermore, with ConcurrentMergeScheduler, several large merges can be running at once and this will cause an even larger increase of temporary disk usage.
Figure 11.3. Disk usage while building an index of all Wikipedia documents, with optimize called in the end

How can you manage disk space when it has such wild swings? Fortunately, there’s a method to this madness. Once you understand what’s happening under the hood, you can predict and understand Lucene’s disk usage. Also, you should know that in the event that your disk fills up while Lucene is writing to its index, the index won’t become corrupt.
It’s important to differentiate transient disk usage while the index is being built (shown in figure 11.3) versus final disk usage, when the index is completely built and optimized. It’s easiest to start with the final size. Here’s a coarse formula to estimate the final size based on the size of all text from the documents:
1/3 x indexed + 1 x stored +2 x term vectors
For example, if your documents have a single field that’s indexed, with term vectors, and is stored, you should expect the index size to be around 3 1/3 times the total size of all text across all documents. Note that this formula is approximate. For example, documents with unusually diverse or unique terms, like a large spreadsheet that contains many unique product SKUs, will use more disk space.
You can reduce disk usage somewhat by turning off norms (section 2.5.3), turning off term frequency information for fields that don’t need it (section 2.4.1), turning off positions and offsets when indexing term vectors (section 2.4.3), and indexing and storing fewer fields per document.
The transient disk usage depends on many factors. As the index gets larger, the size of each sawtooth will get larger as bigger merges are being done. Large merges also take longer to complete and will therefore tie up transient disk space for more time. When you optimize the index down to one segment, the final merge is the largest merge possible and will require one times the final size of your index in temporary disk space. Here are other things that will affect transient disk usage:
- Open readers prevent deletion of the segment files they’re using. You should have only one open reader at a time, except when you are reopening it. Be sure to close the old reader!
- All segments that existed when the IndexWriter was first opened will remain in the directory, as well as those referenced by the current (in memory) commit point. If you commit frequently, less transient disk space will be used, but committing can be a costly operation, so this will impact your indexing throughput.
- If you frequently replace documents but don’t run optimize, the space used by old copies of the deleted documents won’t be reclaimed until those segments are merged.
- The more segments in your index, the more disk space will be used—more than if those segments were merged. This means a high mergeFactor will result in more disk space being used.
- Given the same net amount of text, many small documents will result in a larger index than fewer large documents.
- Don’t open a new reader while optimize, or any other merges, are running; doing so will result in the reader holding references to segments that would otherwise be deleted. Instead, open after you have closed or committed your IndexWriter.
- Do open a new reader after making changes with IndexWriter, and close the old one. If you don’t, the reader could be holding references to files that IndexWriter wants to delete, due to merging, which prevents the files from being deleted. Further, the existing reader will continue to work fine, but it won’t see the newly committed changes from the IndexWriter until it’s reopened.
- If you’re running a hot backup (see section 11.4), the files in the snapshot being copied will also consume disk space until the backup completes and you release the snapshot.
Note that on Unix you may think disk space has been freed because the writer has deleted the old segments files, but in fact the files still consume disk space as long as those files are held open by an IndexReader. When you list the directory, you won’t see the files, which is confusing—yet the files still consume bytes on disk. This is due to Unix’s “delete on last close” semantics. Windows doesn’t allow deletion of open files so you’ll still see the files when you look at the directory. Don’t be fooled!
So how can you make sense of all of this? A good rule of thumb is to measure the total size of your index. Let’s call that X. Then, make sure at all times you have two times free disk space on the file system where the index is stored at all times. Let’s consider file descriptor usage next.
11.3.2. File descriptors
Suppose you’re happily tuning your application to maximize indexing throughput. You turned off compound file format. You cranked up mergeFactor and got awesome speedups, so you want to push it even higher. Unfortunately, there’s a secret cost to these changes: you’re drastically increasing how many files Lucene must hold open at once. At first you’re ecstatic about your changes; everything seems fine. Then, as you add more documents, the index grows, Lucene will need more and more open files when one day—BOOM!—you hit the dreaded “Too many open files” IOException, and the OS stops you dead in your tracks. Faced with this silent and sudden risk, how can you possibly tune for the best indexing performance while staying under this limit?
Fortunately, there’s hope! With a few simple steps you can take control of the situation. Start by running the following test:
public class OpenFileLimitCheck {
  public static void main(String[] args) throws IOException {
    List<RandomAccessFile> files = new ArrayList<RandomAccessFile>();
    try {
      while(true) {
        files.add(new RandomAccessFile("tmp" + files.size(), "rw"));
      }
    } catch (IOException ioe) {
      System.out.println("IOException after  " + files.size() + " open
     files:");
      ioe.printStackTrace(System.out);
      int i = 0;
      for (RandomAccessFile raf : files) {
        raf.close();
        new File("tmp" + i++).delete();
      }
    }
  }
}
When you run the test, it will always fail and then tell you how many files it was able to open before the OS cut it off. There’s tremendous variation across OSs and JVMs. Running this under Mac OS X 10.6 and Java 1.5 shows that the limit is 98. Java 1.6 on Windows Server 2003 shows a limit of 9,994 open files. Java 1.5 on Debian Linux with Kernel 2.6.22 shows a limit of 1,018 open files. Java 1.6 on OpenSolaris allows 65,488 files.
Next, increase the limit to the maximum allowed by the OS. The exact command for doing so varies according to OS and shell (hello, Google, my old friend). Run the test again to make sure you’ve actually increased the limit.
Finally, monitor how many open files your JVM is actually using. There are OS level tools to do this. On Unix, use lsof. On Windows, use Task Manager. You’ll have to add File Handles as a column, using the View > Select Columns menu. The sysinternals tools from Microsoft also include useful utilities like Process Monitor to see which specific files are held open by which processes.
To get more specifics about which files Lucene is opening, and when, use the class in listing 11.6. This class is a drop-in replacement for FSDirectory that adds tracking of open files. It reports whenever a file is opened or closed, for reading or writing, and lets you retrieve the current total count of open files.
Listing 11.6. Drop-in replacement for FSDirectory to track open files


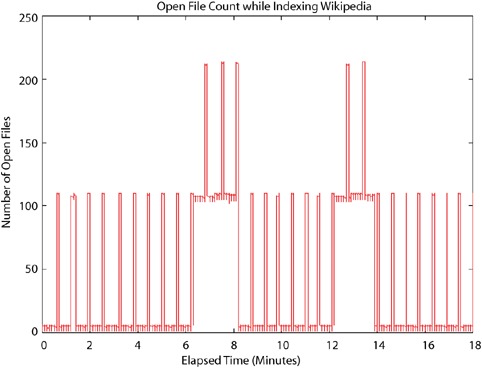
Figure 11.4 shows the open file count while building a Wikipedia index, with compound file format turned off and mergeFactor left at its default (10). You can see that it follows a peaky pattern, with low usage when flushing segments and rather high usage while merges are running (because the writer holds open files for all segments being merged plus the new segment being created). This means mergeFactor, which sets the number of segments to merge at a time, directly controls the open file count during indexing. When two merges are running at once, which happens for three small merges starting around 7 minutes and then again for two small merges starting around 13 minutes, you’ll see twice the file descriptor consumption.
Figure 11.4. File descriptor consumption while building an index of Wikipedia articles
Unlike indexing, where peak open file count is a simple multiple of mergeFactor, searching can require many more open files. For each segment in the index, the reader must hold open all files for that segment. If you’re not using compound file format, that’s seven files if no term vectors are indexed, or ten files if there are. For a quickly changing and growing index, this count can really add up. Figure 11.5 shows open file count for an IndexReader reading the same index from figure 11.4, while it’s being built, reopening the reader every 10 seconds. During reopen, if the index has changed substantially because a merge has completed, the open file count will at first peak very high, because during this time both the old and new readers are in fact open. Once the old reader is closed, the usage drops down, in proportion to how many segments are in the index. When you use the IndexReader.reopen method, this spike is quite a bit smaller than if you open a new reader, because the file descriptors for segments that haven’t changed are shared. As the index gets larger, the usage increases, though it’s not a straight line because sometimes the reader catches the index soon after a large merge has finished. Armed with your new knowledge about open file consumption, here are some simple tips to keep them under control while still enjoying your indexing performance gains:
- Increase the IndexWriter buffer (setRAMBufferSizeMB). The less often the writer flushes a segment, the fewer segments there will be in the index.
- Use IndexReader.reopen instead of opening a whole new reader. This is a big reduction on peak open file count.
- Reduce mergeFactor—but don’t reduce it so much that it substantially hurts indexing throughput.
- Consider reducing the maximum number of simultaneous merge threads. Do this by calling ConcurrentMergeScheduler.setMaxThreadCount.
- Optimize the index. A partial optimize, using the IndexWriter.optimize(int maxNumSegments) method, is a good compromise for minimizing the time it takes to optimize while still substantially reducing the number of segments in the index.
- Always budget for your peak usage. This is often when you’re opening and warming a new reader, before you’ve closed the old one.
- If you run indexing and searching from a single JVM, you must add up the peak open file count for both. The peak often occurs when several concurrent merges are running and you’re reopening your reader. If possible, close your writer before reopening your reader to prevent this “perfect storm” of open files.
- Double-check that all other code also running in the same JVM isn’t using too many open files—if it is, consider running a separate JVM for it.
- Double-check that you’re closing your old IndexReader instances. Do this if you find you’re still running out of file descriptors far earlier than you’d expect.
Figure 11.5. File descriptor usage by an IndexReader reopening every 30 seconds while Wikipedia articles are indexed

Striking the right balance between performance and the dreaded open file limit feels like quite an art. But now that you understand how Lucene uses open files, how to test and increase the limit on your OS, and how to measure exactly which files are held open by Lucene, you have all the tools you need to strike that perfect balance. It’s now more science than art! We’ll move next to another challenging resource: memory usage.
11.3.3. Memory
You’ve surely hit OutOfMemoryError in your Lucene application in the past? If you haven’t, you will, especially when many of the ways to tune Lucene for performance also increase its memory usage. So you thought: no problem, just increase the JVMs’ heap size and move on. Nothing to see here. You do that, and things seem fine, but little do you know you hurt the performance of your application because the computer has started swapping memory to disk. And perhaps a few weeks later you encounter the same error again. What’s going on? How can you control this devious error and still keep your performance gains?
Managing memory usage is especially exciting, because there are two different levels of memory. First, you must control how the JVM uses memory from the OS. Second, you must control how Lucene uses memory from the JVM. And the two must be properly tuned together. Once you understand these levels, you’ll have no trouble preventing memory errors and maximizing your performance at the same time.
You manage the JVM by telling it how large its heap should be. The option -Xms size sets the starting size of the heap and the option -Xmx size sets the maximum allowed size of the heap. In a production server environment, you should set both of these sizes to the same value, so the JVM doesn’t spend time growing and shrinking the heap. Also, if there will be problems reaching the max (e.g., the computer must swap excessively), you can see these problems quickly on starting the JVM instead of hours later (at 2 a.m.) when your application suddenly needs to use all the memory. The heap size should be large enough to give Lucene the RAM that it needs, but not so large that you force the computer to swap excessively. Generally you shouldn’t just give all RAM to the JVM: it’s beneficial to leave excess RAM free to allow the OS to use as its I/O cache.
How can you tell if the computer is excessively swapping? Here are some clues:
- Listen to your hard drives, if your computer is nearby: they’ll be noticeably grinding away, unless you’re using solid-state disks.
- On Unix, run vmstat 1 to print virtual memory statistics, once per second. Then look for the columns for pages swapped in (typically si) and pages swapped out (typically so). On Windows, use Task Manager, and add the column Page Faults Delta, using the View > Select Columns menu. Check for high numbers in these columns (say, greater than 20).
- Ordinary interactive processes, like a shell or command prompt, or a text editor, or Windows Explorer, are not responsive to your actions.
- Using top on Unix, check the Mem: line. Check if the free number and the buffers number are both near 0. On Windows, use Task Manager and switch to the Performance tab. Check if the Available and System Cache numbers, under Physical Memory, are both near 0. The numbers tell you how much RAM the computer is using for its I/O cache.
- CPU usage of your process is unexpectedly low.
Note that modern OSs happily swap out processes that seem idle in order to use the RAM for the I/O cache. If you feel the OS is being too aggressive, you can try to tune it. For example, on Linux there is a kernel parameter called swappiness; setting it to 0 forces the OS to never swap out RAM for I/O cache. Some versions of Windows have an option to adjust for best performance of programs or system cache. But realize that some amount of swapping is normal. Excessive swapping, especially while you’re indexing or searching, isn’t good.
To manage how Lucene, in turn, uses memory from the JVM, you first need to measure how much memory Lucene needs. There are various ways, but the simplest is to specify the -verbose:gc and -XX:+PrintGCDetails options when you run Java, and then look for the size of the total heap after collection. This is useful because it excludes the memory consumed by garbage objects that aren’t yet collected. If your Lucene application needs to use up nearly all of the memory allocated for the JVM’s maximum heap size, it may cause excessive GC, which will slow things down. If you use even more memory than that, you’ll eventually hit OutOfMemoryError.
During indexing, one big usage of RAM is the buffer used by IndexWriter, which you can control with setRAMBufferSizeMB. Don’t set this too low as it will slow down indexing throughput. While a segment merge is running, some additional RAM is required, in proportion to the size of the segments being merged.
Searching is more RAM intensive. Here are some tips to reduce RAM usage during searching:
- Optimize your index to purge deleted documents.
- Limit how many fields you directly load into the FieldCache, which is entirely memory resident and time consuming to load (as described in section 5.1). Try not to load the String or StringIndex FieldCache entries as these are far more memory consuming than the native types (int, float, etc.).
- Limit how many fields you sort by. The first time a search is sorted by a given field, its values are loaded into the FieldCache. Similarly, try not to sort on String fields.
- Turn off field norms. Norms encode index-time boosting, which combines field boost, doc boost, and length boost into a single byte per document. Even documents without this field consume 1 byte because the norms are stored as a single contiguous array. This quickly works out to a lot of RAM if you have many indexed fields. Often norms aren’t actually a big contributor to relevance scoring. For example, if your field values are all similar in length (e.g., a title field), and you aren’t using field or document boosting, then norms are not necessary. Section 2.5.3 describes how to disable norms during indexing.
- Use a single “catchall” text field, combing text from multiple sources (such as title, body, or keywords), instead of one field per source. This reduces memory requirements within Lucene and could also make searching faster.
- Make sure your analyzer is producing reasonable terms. Use Luke to look at the terms in your index and verify these are legitimate terms that users may search on. It’s easy to accidentally index binary documents, which can produce a great many bogus binary terms that would never be used for searching. These terms cause all sorts of problems once they get into your index, so it’s best to catch them early by skipping or properly filtering the binary content. If your index has an unusually large number of legitimate terms—for example, if you’re searching a large number of product SKUs—try specifying a custom termInfosIndexDivisor when opening your IndexReader to reduce how many index terms are loaded into RAM. But note that this may slow down searching. There are so many trade-offs!
- Double-check that you’re closing and releasing all previous IndexSearcher/IndexReader instances. Accidentally keeping a reference to past instances can quickly exhaust RAM and file descriptors and even disk usage.
- Use a Java memory profiler to see what’s using so much RAM.
Be sure to test your RAM requirements during searching while you are reopening a new reader because this will be your peak usage. If an IndexWriter shares the JVM, try to test while the IndexWriter is indexing and merging, to hit its peak usage.
Let’s go back and rerun our fastest Wikipedia indexing algorithm, intentionally using a heap size that’s too small to see what happens if you don’t tune memory usage appropriately. Last time we ran it with a 512MB heap size, and we achieved 899.7 doc/ sec throughput. This time let’s give it only a 145MB heap size (anything below this will likely hit OutOfMemoryError). Run the algorithm, adding -Dtask.mem=145M, and you should see something like this:
Operation round runCnt recsPerRun rec/s elapsedSec  avgUsedMem avgTotalMem
BuildIndex    0      1     200002 323.4     618.41 150,899,008 151,977,984
BuildIndex  - 1  -   1  -  200002 344.0  -  581.36 150,898,992 151,977,984
BuildIndex    2      1     200002 334.4     598.05 150,898,976 151,977,984
Whoa, that’s 334.4 documents per second, which is 2.7 times slower than before! That slowdown is due to excessive GC that the JVM must do to keep memory usage under 145MB. You can see the importance of giving Lucene enough RAM.
Like any software, Lucene requires resources to get its job done, but you’re now empowered to understand and control that usage. We’ll now switch to a crucial topic for any high-availability application: backing up your index.
11.4. Hot backups of the index
So, it’s 2 a.m., and you’re having a pleasant dream about all the users who love your Lucene search application when, suddenly, you wake up to the phone ringing. It’s an emergency call saying your search index is corrupted and the search application won’t start. No problem, you answer: restore from the last backup! You do back up your search index, right?
Things will inevitably go wrong: a power supply fails, a hard drive crashes, your RAM becomes random. These events can suddenly render your index completely unusable, almost certainly at the worst possible time. Your final line of protection against such failures is a periodic backup of the index along with accessible steps to restore it. In this section we’ll see a simple way to create and restore from backups.
11.4.1. Creating the backup
You can’t simply copy the files in an index while an IndexWriter is still open, because the resulting copy can easily be corrupted, as the index can change during the copy. So, the most straightforward way to back up an index is to close your writer and make a copy of all files in the index directory. This approach will work, but it has some serious problems. During the copy, which could take a long time for a large index, you can’t make any changes to the index. Many applications can’t accept such a long downtime in their indexing. Another problem is that when a reader is open on the index, you’ll copy more files than needed, if the reader is holding some files open that are no longer current. Finally, the I/O load of the copy can slow down searching. You might be tempted to throttle back the copy rate to compensate for this, but that will increase your indexing downtime. No wonder so many people just skip backups entirely, cross their fingers, and hope for the best!
As of Lucene 2.3, there’s now a simple answer: you can easily make a “hot backup” of the index, so that you create a consistent backup image, with just the files referenced by the most recent commit point, without closing your writer. No matter how long the copying takes, you can still make updates to the index. The approach is to use the SnapshotDeletionPolicy, which keeps a commit point alive for as long it takes to complete the backup. Your backup program can take as long as it needs to copy the files. You could throttle its I/O or set it to low process or I/O priority to make sure it doesn’t interfere with ongoing searching or indexing. You can spawn a subprocess to run rsync, tar, robocopy, or your favorite backup utility, giving it the list of files to copy. This can also be used to mirror a snapshot of the index to other computers.
The backup must be initiated by the JVM that has your writer, and you must create your writer using the SnapshotDeletionPolicy, like this:
IndexDeletionPolicy policy = new KeepOnlyLastCommitDeletionPolicy();
SnapshotDeletionPolicy snapshotter = new SnapshotDeletionPolicy(policy);
IndexWriter writer = new IndexWriter(dir, analyzer, snapshotter,
                                     IndexWriter.MaxFieldLength.UNLIMITED);
Note that you can pass any existing deletion policy into SnapshotDeletionPolicy (it doesn’t have to be KeepOnlyLastCommitDeletionPolicy). When you want to do a backup, just do this:
try {
  IndexCommit commit = snapshotter.snapshot();
  Collection<String> fileNames = commit.getFileNames();
  /*<iterate over & copy files from fileNames>*/
} finally {
  snapshotter.release();
}
Inside the try block, all files referenced by the commit point won’t be deleted by the writer, even if the writer is still making changes, optimizing, and so forth as long as the writer isn’t closed. It’s fine if this copy takes a long time because it’s still copying a single point-in-time snapshot of the index. While this snapshot is kept alive, the files that belong to it will hold space on disk. So while a backup is running, your index will use more disk space than it normally would (assuming the writer is continuing to commit changes to the index). Once you’re done, call release to allow the writer to delete these files the next time it flushes or is closed.
Note that Lucene’s index files are write-once. This means you can do an incremental backup by simply comparing filenames. You don’t have to look at the contents of each file, nor its last modified timestamp, because once a file is written and referenced from a snapshot, it won’t be changed. The only exception is the file segments.gen, which is overwritten on every commit, and so you should always copy this file. You shouldn’t copy the write lock file (write.lock). If you’re overwriting a previous backup, you should remove any files in that backup that aren’t listed in the current snapshot, because they are no longer referenced by the current index.
SnapshotDeletionPolicy has a couple of small limitations:
- It only keeps one snapshot alive at a time. You could fix this by making a similar deletion policy that keeps track of more than one snapshot at a time.
- The current snapshot isn’t persisted to disk. This means if you close your writer and open a new one, the snapshot will be deleted. So you can’t close your writer until the backup has completed. This is also easy to fix: you could store and load the current snapshot on disk, then protect it on opening a new writer. This would allow the backup to keep running even if the original writer is closed and new one opened.
Believe it or not, that’s all there is to it! Now let’s move on to restoring your index.
11.4.2. Restoring the index
In addition to doing periodic backups, you should have a list simple of steps on hand to quickly restore the index from backup and restart your application. You should periodically test both backup and restore. Two o’clock in the morning is the worst time to find out you had a tiny bug in your backup process!
Here are the steps to follow when restoring an index:
1. Close any existing readers and writers on the index directory, so the file copies will succeed. In Windows, if there are still processes using those files, you won’t be able to overwrite them.
2. Remove all existing files from the index directory. If you see an “Access is denied” error, double-check step 1.
3. Copy all files from your backup into the index directory. Be certain this copy doesn’t encounter any errors, like a disk full, because that’s a sure way to corrupt your index.
4. Speaking of corruption, let’s talk next about common errors you may run into with Lucene.
11.5. Common errors
Lucene is wonderfully resilient to most common errors. If you fill up your disk, or see an OutOfMemoryException, you’ll lose only the documents buffered in memory at the time. Documents already committed to the index will be intact, and the index will be consistent. The same is true if the JVM crashes, or hits an unhandled exception, or is explicitly killed, or if the OS crashes or the electricity to the computer is suddenly lost.
If you see a LockObtainFailedException, that’s likely because there’s a leftover write.lock file in your index directory that wasn’t properly released before your application or JVM shut down or crashed. Consider switching to NativeFSLockFactory, which uses the OS provided locking (through the java.nio.* APIs) and will properly release the lock whenever the JVM exits normally or abnormally. You can safely remove the write.lock file, or use the IndexReader.unlock static method to do so. But first be certain there’s no writer writing to that directory!
If you see AlreadyClosedException, double-check your code: this means you’re closing the writer or reader but then continuing to use it.
11.5.1. Index corruption
So maybe you’ve seen an odd, unexpected exception in your logs, or maybe the computer is acting erratically, leading you to suspect a bad hard drive or RAM. Nervously, you bring your Lucene application back up, and all seems to be fine, so you just shrug and move on to the next crisis. But you can’t escape the sinking sensation and burning question deep in your mind: is it possible my index is now corrupted? A month or two later, more strange exceptions start appearing. Corruption is insidious: it may silently enter your index but take quite a long time to be discovered, perhaps when the corrupted segment is next merged, or when a certain search term happens to hit on a corrupted part of the index. How can you manage this risk?
Unfortunately, there are certain known situations that can lead to index corruption. If this happens to you, try to get to the root cause of the corruption. Look through your logs and explain all exceptions. Otherwise, it may simply reoccur. Here are some typical causes of index corruption:
- Hardware problems— Bad power supply, slowly failing hard drive, bad RAM, and so forth.
- Accidentally allowing two writers to write to the same index at the same time— Lucene’s locking normally prevents this. But if you use a different LockFactory inappropriately, or if you incorrectly removed a write.lock that in fact indicated that a writer was still open, that could lead to two writers open on the same index.
- Errors when copying— If you have a step in your indexing process where an index is copied from one place to another, an error in that copying can easily corrupt the target index.
- A previously undiscovered bug in Lucene— Take your case to the lists, or open an issue with as much detail as possible about what led to the corruption. The Lucene developers will jump on it!
Although you can’t eliminate these risks, you can be proactive in detecting index corruption. If you see a CorruptIndexException, you know your index is corrupted. But all sorts of other unexplained exceptions are also possible. To proactively test your index for corruption, here are two things to try:
- Run Lucene with assertions enabled (java -ea:org.apache.lucene, when launching Java at the command line). This causes Lucene to perform additional tests at many points during indexing and searching, which could catch corruption sooner than you would otherwise.
- Run the org.apache.lucene.index.CheckIndex tool, providing the path to your index directory as the only command-line argument. This tool runs a thorough check of every segment in the index, and reports detailed statistics, and any corruption, for each. It produces output like this:
Opening index @ /lucene/work/index Segments file=segments_2 numSegments=1version=FORMAT_SHARED_DOC_STORE [Lucene 2.3] 1 of 1: name=_8 docCount=36845 compound=false numFiles=11 size (MB)=103.619 docStoreOffset=0 docStoreSegment=_0 docStoreIsCompoundFile=false no deletions test: open reader.........OK test: fields, norms.......OK [4 fields] test: terms, freq, prox...OK [612173 terms; 20052335 terms/docs pairs; 42702159 tokens] test: stored fields.......OK [147380 total field count; avg 4 fields per doc] test: term vectors........OK [110509 total vector count; avg 2.999 term/freq vector fields per doc] No problems were detected with this index.
If you find your index is corrupted, first try to restore from backups. But what if all your backups are corrupted? This can easily happen because corruption may take a long time to detect. What can you do, besides rebuilding your full index from scratch? Fortunately, there’s one final resort: use the CheckIndex tool to repair it.
11.5.2. Repairing an index
When all else fails, your final resort is the CheckIndex tool. In addition to printing details of your index, this tool can repair your index if you add the -fix command-line option:
java org.apache.lucene.index.CheckIndex <pathToIndex> -fix
That will forcefully remove those segments that hit problems. Note that this completely removes all documents that were contained in the corrupted segments, so use this option with caution and make a backup copy of your index first. You should use this tool just to get your search operational again on an emergency basis. Once you are back up, you should rebuild your index to recover the lost documents.
11.6. Summary
We’ve covered many important hands-on topics in this chapter! Think of this chapter like your faithful Swiss army knife: you now have the necessary tools under your belt to deal with all the important, real-world aspects of Lucene administration.
Lucene has great out-of-the-box performance, and now you know how to further tune that performance for specific metrics important to your application, using the powerful and extensible contrib/benchmark framework to set up repeatable tests. Unfortunately, tuning for one metric often comes at the expense of others, so you should decide up front which metric is most important to you. Sometimes this decision is not easy!
You’ve seen how crucial it is to use threads during indexing and searching to take advantage of the concurrency in modern computers, and now you have a couple of drop-in classes that make this painless during indexing and searching. Taking a hot backup of an index is a surprisingly simple operation.
Lucene’s consumption of disk, file descriptors, and memory is no longer a mystery and is well within your control. Index corruption is not something to fear; you know what might cause it and you know how to detect and repair a corrupted index. The common errors that happen are easy to understand and fix.
This chapter wraps up our direct coverage of Lucene. You’ve learned a lot and you’re now ready to go forth and build! The next three chapters describe several interesting real-world applications using Lucene.