
Chapter 6: Estimating the respiratory rate from ECG and PPG using machine learning techniques
Wenhan Tan; Anup Das Electrical and Computer Engineering, Drexel University, Philadelphia, PA, United States
Abstract
Today’s methods for estimating respiratory rate (RR) from the electrocardiograph (ECG) and the photoplethysmogram (PPG) are not good at distinguishing between periods of low- and high-quality data or raw signals. The goal of this work is to present an alternative way of estimating respiratory rate from ECG and PPG by using machine learning to improve the accuracy of estimation. The datasets used in this work are extracted from a publicly available source, the BIDMC dataset. The proposed methods are based on respiratory signals extracted from raw signals and use support vector machine (SVM) and neural networks (NNs) to estimate respiratory rate. The performance using a window size (32 s) is compared with that of current methods. The proposed methods achieved comparable accuracy to current methods when the number of classes is low. Once the number of classes increases, the accuracy drops significantly. This work demonstrates that the use of machine learning has more potential than commonly thought, and it is necessary to apply it and carry out further studies and research on existing methods.
Keywords
Respiratory rate; Electrocardiograph; Photoplethysmogram; Support vector machine; Neural network; Signal processing
Acknowledgments
This work is supported by the National Science Foundation Award CCF-1937419 (RTML: Small: Design of System Software to Facilitate Real-Time Neuromorphic Computing). We would like to thank Dr. Andrew R. Cohen from the Electrical and Computer Engineering Department at Drexel University for his guidance in machine learning and pattern recognition.
1: Introduction
1.1: Motivation
Respiratory rate (RR) is a known factor in many conditions causing physiological deterioration in patients. Its measurement accuracy is of substantial importance for many medical uses, including mobile health, home monitoring applications, and hospitals. Most hospitals and personal clinics use pulse oximetry to continuously measure heart rate (HR) and peripheral blood oxygen saturation (SpO2), but the measurement of RR relies on the use of other equipment, for instance capnometry or measurement of gas flow. Therefore, it is necessary to improve RR estimation from the electrocardiogram (ECG), the photoplethysmogram (PPG) collected from pulse oximeters, and other signals that are related to RR.
Mobile healthcare, or smart devices that monitor patients, has received much attention recently. Most patients during the day will not tolerate wearing sensors constantly, since these devices are uncomfortable over a long duration. They would rather use pulse oximeters and other devices that are easily accessed and simple for patients to use. However, pulse oximeters provide no information about RR and it is significantly challenging to improve RR estimation methods, primarily because of movement artifacts.
Recent technologies are calling for inclusion of RR estimation from the PPG and the ECG. This is influenced by the large number of health trackers and other fitness devices. Their aim is to maintain and report the fitness status of the mostly healthy people who wear them. This is different from hospital and clinic needs, as a long-term and costly validation is required to be able to use any new technology in hospitals and clinics. The majority of current smart devices include a small version of accelerometers for tracking “fitness data” and the state-of-the-art generation includes sensors such as pulse oximeters (e.g., Apple Watch from Apple, Inc., United States) and bioimpedance sensors (e.g., UP3 from Jawbone, United States). If a better means of estimating RR existed, then it could be used on these devices, increasing the amount of physiological data they can provide.
1.2: Background
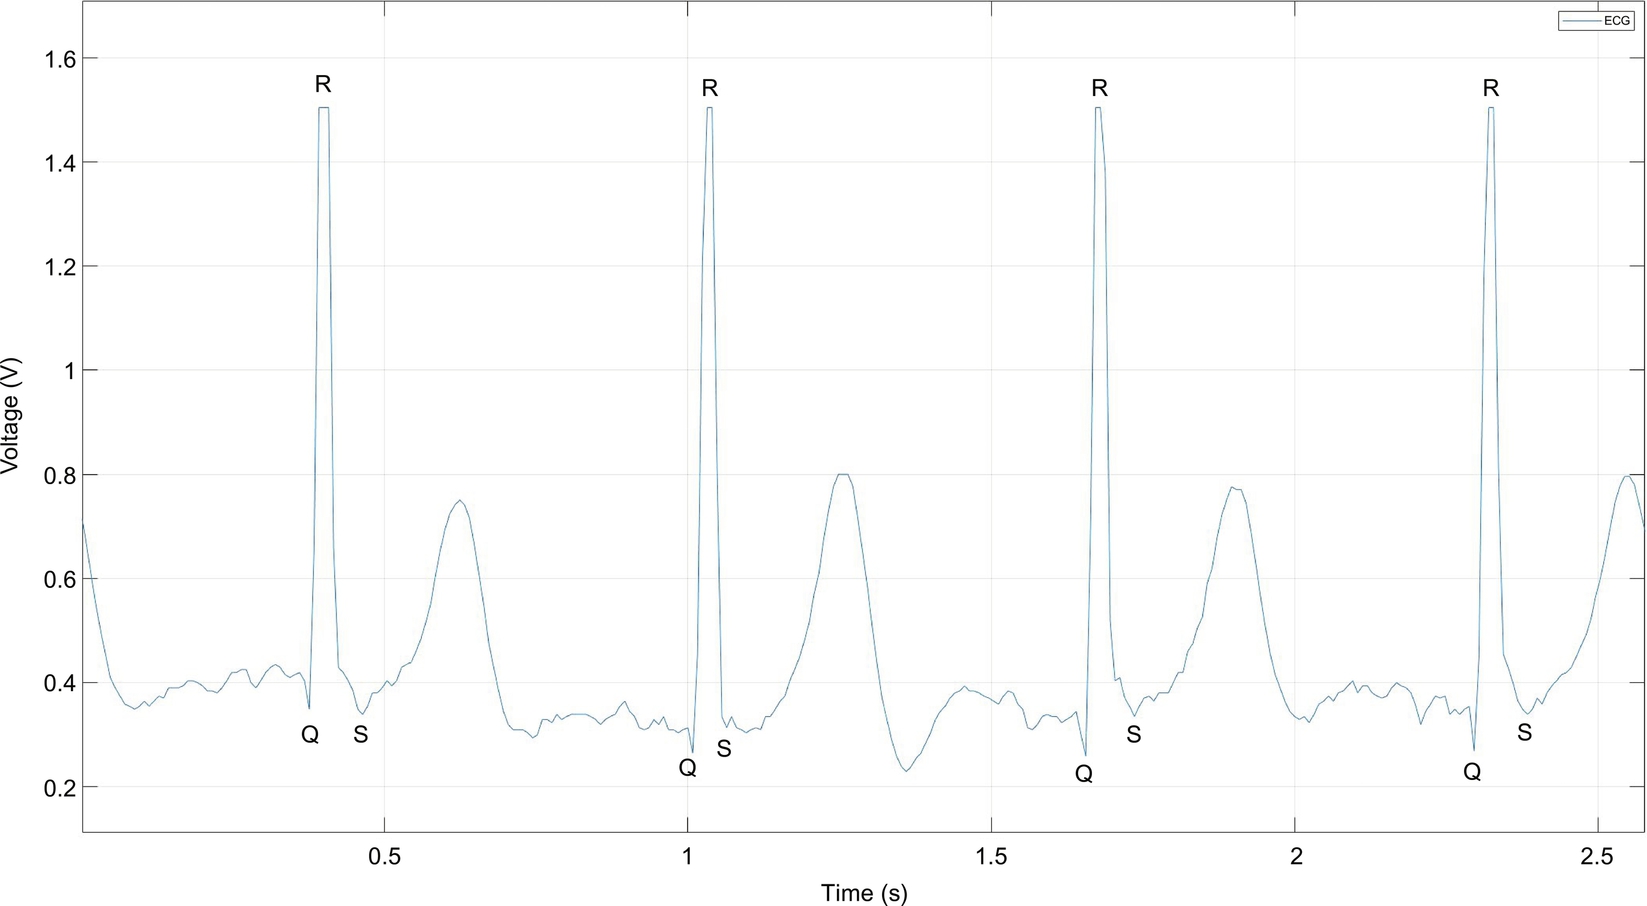
The ECG is a measure of the electrical activity of the heartbeat: each beat causes an electrical impulse to travel through the heart and body. The most prominent feature is known as the QRS complex, which represents the main pumping duration of the heart. The QRS complex is shown in Fig. 1.
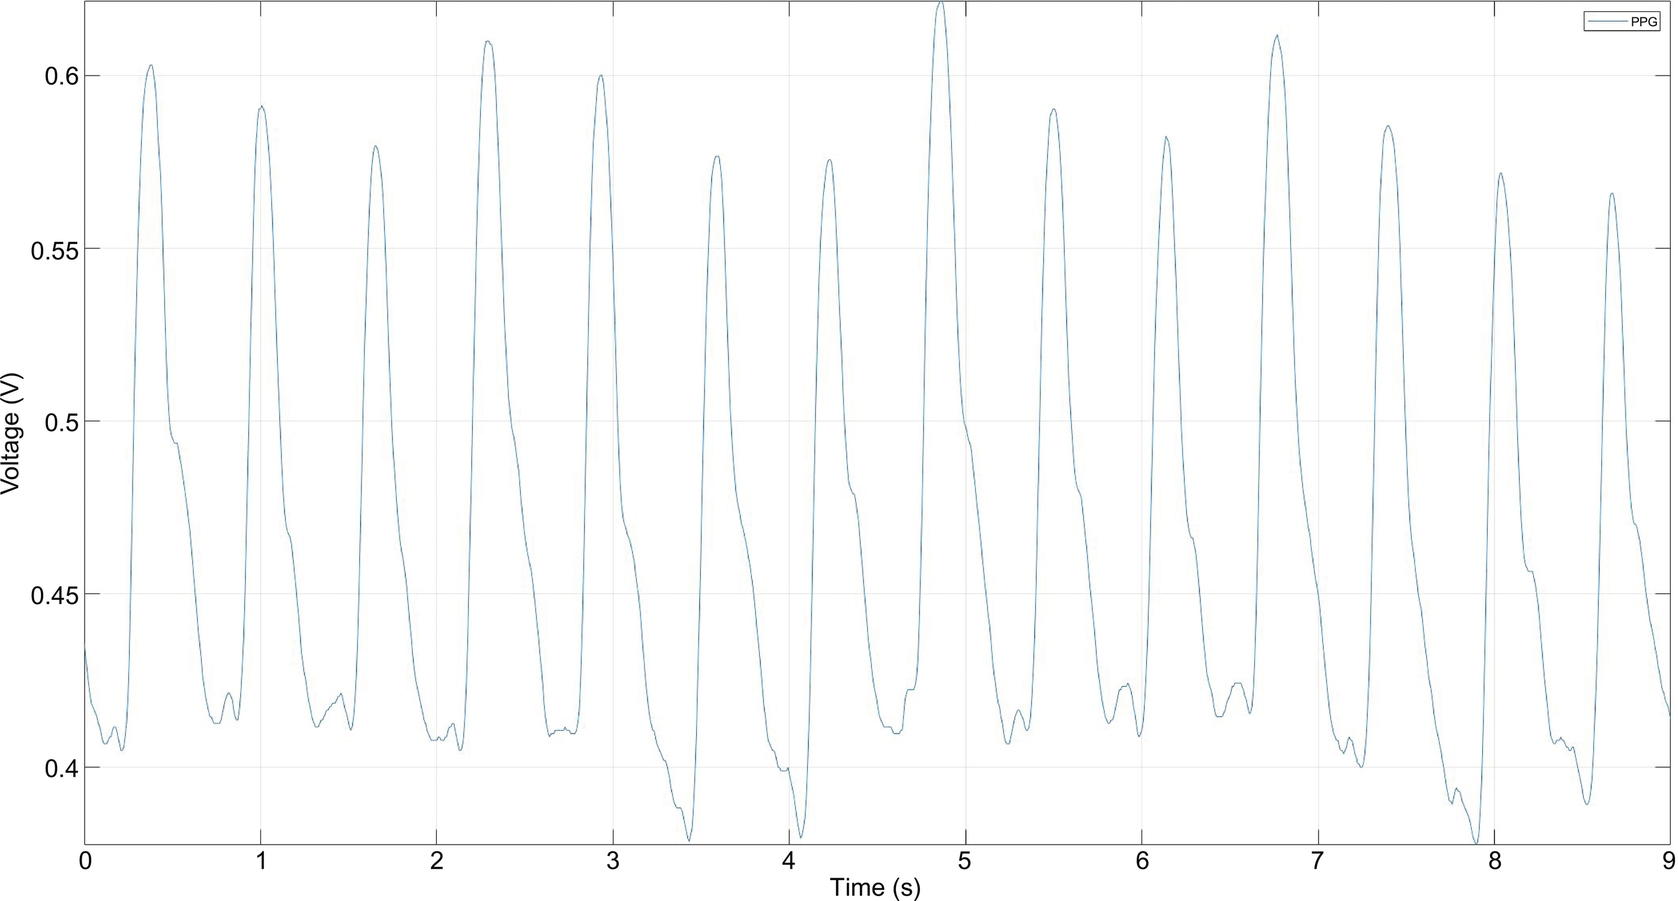
The PPG works a little bit differently from the ECG. It measures the change in light absorption under human skin. The change appears each time the heart beats. The amplitude of this signal is directly related to pulse pressure from blood pumping, as shown in Fig. 2.
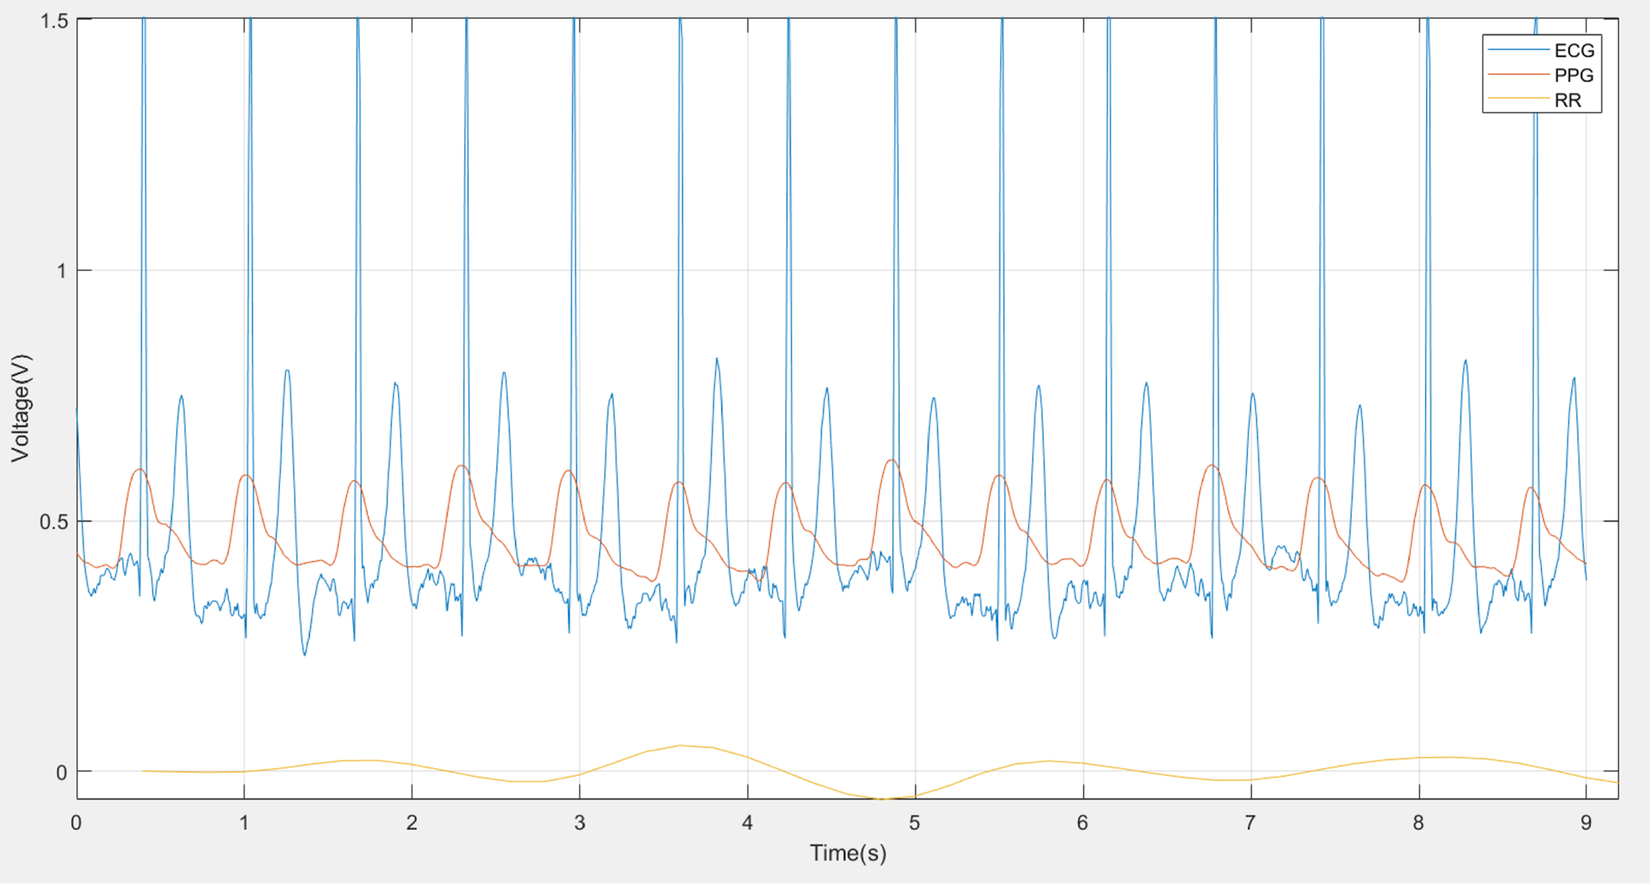
The ECG and the PPG are both related to heartbeat, as shown in Fig. 3, but the goal of this work is to estimate respiratory rate (RR) from these two signals. The ECG and the PPG have the same peak time showing each heartbeat. Fig. 3 depicts a MATLAB generated plot using the publicly available BIDMC dataset.
The goal of this work is to test whether machine learning-based RR estimation from the ECG and the PPG could be a part of the signal processing or eventually replace the signal processing in wearable devices. The proposed method will be evaluated on both the ECG and the PPG and eventually compared with existing methods that rely on signal processing entirely.
Contributions: The following are our key contributions:
- • data preprocessing including extracting respiratory rate signal by filtering;
- • classifying extracted respiratory rate signals by window size of 32 s using neural network and support vector machine;
- • exploring hyperparameters to improve model accuracy;
- • evaluating 53 subjects by comparing number of classes and model accuracy.
2: Related work
Current methods for estimating RR from the ECG and the PPG are often used on windows of time-series data. RR is produced from each window during estimation. There are usually three main steps of estimation, as illustrated in Fig. 4.

The first step is extracting the respiratory component from the raw signal. There are many ways to perform extraction and they often rely on the extraction of features from the raw signal, such as the pulse width, peak-trough detection in the time domain. Techniques such as digital filters, Fourier transforms, and joint time-frequency analysis have all been used.
The second step is to estimate respiratory rate from the extracted respiratory signal. This part of the entire RR estimation is all about signal processing. Over 100 algorithms have been proposed to estimate RR (Charlton et al., 2016) and they have been rarely compared systematically to decide which algorithm performs the best (Charlton et al., 2016). For example, the PPG signal has been analyzed using a short-time Fourier transform using a moving window of a certain time duration. The maximum frequency in the range of respiratory frequency is noted as RR (Pimentel et al., 2017).
A more recent algorithm was proposed in 2014 (Garde et al., 2014), which is based on the time-varying correntropy spectral density function (CSD) being applied on the PPG. CSD is a similarity measure of time-varying structure and the statistical characteristics of a signal. This algorithm first detects the heart rate by looking for the maximum frequency peak and then extracts the RR signal with a cutoff frequency of 0.1 Hz (Garde et al., 2014).
One of the most recently proposed algorithms describes a method that estimates RR from PPG data collected from pulse oximetry using three respiratory-induced variations (RIIV, RIAV, RIFV). RIIV is the respiratory-induced intensity variation, the time series of amplitudes of PPG peaks (Pimentel et al., 2017). RIAV is the respiratory-induced amplitude variation, the peaks of the PPG (Pimentel et al., 2017). RIFV is the respiratory-induced frequency variation, the change in the value of the instantaneous HR during the respiratory cycle (Pimentel et al., 2017).
The last step is the fusion of estimated RR. Its purpose is to combine different estimated RR results and generate a single output. The proposed “smart fusion” method analyzes the frequency from each of the respiratory-induced variations. Then the “smart fusion” method takes their mean and combines the results. Artifacts and low-quality estimations are discarded in the end. This has been demonstrated to be the most effective algorithm of fusing RR by Pimentel et al. (2017).
In Chon et al. (2009), an algorithm based on best time and frequency resolution uses variable-frequency complex demodulation (VFCDM) to increase the accuracy of respiratory rate estimation from PPG. Both CWT and AR methods have been shown to output good estimates of respiratory rate in the normal range (12–26 breaths/min). The VFCDM method was tested on 15 different subjects for breathing frequencies between 0.2 and 0.6 Hz (12–36 breaths/min) and compared with the continuous wavelet transform (CWT) and autoregressive (AR) methods. The VFCDM has significantly lower median error among them.
In Karlen et al. (2011), a way of extracting respiratory sinus arrhythmia (RSA) from the PPG-derived heart rate variability (HRV) was introduced. The method was tested on data from 299 children and 13 adults undergoing general anesthesia. The research compared the RSA from both ECG and PPG, with reference RR from a capnograph. The results show that RSA on PPG is possible and slightly better than that on ECG.
In Karlen et al. (2013), a new method of estimating respiratory rate from PPG in real time was introduced. The method contains three respiratory-induced variations (frequency, amplitude, and intensity) extracted from PPG and uses fast Fourier transforms. Then the proposed smart fusion is used to combine the three results using a transparent mean calculation. The algorithm was tested on data from 29 children and 13 adults. The results show that combining the three respiratory-induced variations improves estimation by lowering the mean square error. The algorithm is also applied in a mobile pulse oximeter to diagnose severe childhood pneumonia in remote areas.
In Pimentel et al., an algorithm using autoregressive models was proposed. It uses multiple autoregressive models of different orders for determining the dominant respiratory frequency in the three respiratory-induced variations (frequency, amplitude, and intensity) from PPG. The method was tested on two different datasets that contain 95 8-min PPG datasets from both children and adults. The results are then compared with existing methods using two window sizes (32 and 64 s). It achieves comparable accuracy to existing methods and provides RR estimates from a larger window size.
In Hernando et al. (2019), two PPG signals were compared, one from the finger and the other from the forehead. Both were recorded from 35 subjects during a controlled experiment that required a constant rate from 0.1 Hz to 0.6 Hz in 0.1-Hz steps. Four PPG-derived respiratory (PDR) signals were extracted from both PPG locations and were used to estimate respiratory rate. Different combinations of PDR signals have been analyzed. The results show that when (i) using finger PPG; (ii) respiratory rate is less than 0.4 Hz; and (iii) the RIIV signal is not considered, the accuracy is better: 85 success rates at 0.1 and 0.2 Hz, 90% at 0.3 Hz, and above 75% at 0.4 and 0.5 Hz.
Recently, machine-learning techniques have also been used for ECG RR detection and classification. In Das et al. (2018a), a novel method of heart-rate estimation from electrocardiogram (ECG) data was designed and implemented. The approach was to use a spiking neural network, specifically a liquid state machine, and an unsupervised readout based on fuzzy c-means consisting of spiking responses, selected by using particle swarm optimization. The results showed high accuracy and low energy consumption in heart-rate estimation for wearable devices. This work also contributes to neuromorphic algorithms and applications.
In Das et al. (2018b), a different machine-learning algorithm was proposed to classify cardiac arrhythmia. It is based on a representation using time-frequency joint distribution of ECG data from the MIT-BIH arrhythmia database. The proposed algorithm is a multilayer perceptron used on wearable health devices. The results show that the approach has an average accuracy of 95.7% and significant improvement with respect to existing ECG signal classification techniques.
In Messinger et al. (2019), an artificial neural network is introduced to predict the pediatric-automated asthma respiratory score (pARS). A manual pediatric asthma score (PAS) is used as clinical care standard data for comparison. Total PAS distribution is not a straight horizontal line. Most data fall between PAS values of 6 to 9. First, vital sign data including heart rate, respiratory rate, and pulse oximetry are merged with the manual pediatric asthma score for children of ages between 2 and 18. Children are selected if they are admitted to the pediatric intensive care unit (PICU) for status asthmaticus. The merged signals are split into train and test sets for the artificial neural network (ANN). The ANN is trying to predict a respiratory score that would further be compared to two other approaches via a 10-fold cross-validation method. The two approaches are a normal and a Poisson distribution used as a reference to compare with the purposed machine-learning regression results. The results show that pARS has the smallest mean absolute error (MAE) overall. The normal and Poisson yield a slightly higher MAE for extreme PAS values, including 5, 6, 7, and 13.
In Zeiberg et al. (2019), a developed machine-learning algorithm is introduced to predict acute respiratory distress syndrome (ARDS). The datasets used were extracted from electronic health record (EHR) data during data preprocessing. One extracted dataset from 2016 was used for training and the other dataset from 2017 was used for testing. The proposed training method uses fivefold cross validation and eventually generated 984 features with L2-logistic regression for testing. The results showed an overall AUC value of 0.81. With a threshold based on the 85th percentile of risk, the results showed a sensitivity of 56% and specificity of 86%, and a positive predictive value of 9%.
In Sauthier et al. (2020), a random forest machine-learning algorithm was introduced to predict prolonged acute hypoxemic respiratory failure in influenza-infected critically ill children. Most acute respiratory distress syndrome (ARDS) predictive models use logistic regression, but it is limited in exploiting nonlinear features. Random forest, on the other hand, does not easily overfit and has shown better results for some clinical cohorts. In the results, respiratory, FiO2, and pH are the most important features and the random forest algorithm generated an AUC value of 0.93.
In Bashar et al. (2019), a decision tree regression algorithm was introduced to extract heart rate from the PPG signal. The PPG signal was first collected from wearable devices and then split into noisy and nonnoisy data using the k-means clustering method, an unsupervised machine-learning algorithm. A decision tree algorithm was then implemented on the nonnoisy data to compute heart rate. The metric being used here was root mean square error and average error. The results showed that fewer model features produce the same absolute error rate as all model features do. This demonstrates the potential of calculating heart rate on wearable devices by applying unsupervised machine-learning algorithms.
Recently, in Mian Qaisar and Subasi (2020), a cloud-purposed ECG acquisition and machine-learning techniques were introduced to collect only significant data for cloud monitoring purposes. The motivation was that wearable devices are meant to be small and should not require massive computing processes, which also cost battery life. The database used was the MIT-BIH Arrhythmia and the acquisition frequency was 360 Hz. The collected ECG signal was first filtered using several embedded processing techniques, including event-driven analog-to-digital converters (EDADCs), adaptive rate resampling, etc. The resampled and filtered ECG signals were then used in cloud-based processing, including feature extraction and machine-learning detection of cardiac arrhythmia. The feature extraction method used was the autoregressive Burg method and the machine-learning algorithms used were SVM, k-NN, ANN, random forest, and rotation forest. All classification-based results showed an accuracy between 90% and 96% and an AUC value between 0.97 and 0.997. These results indicate the power and future of medical and health monitoring functions on wearable devices.
3: Methods
3.1: Data
All datasets used in this work are from a publicly available database called BIDMC PPG and the Respiration dataset downloaded from the PhysioNet website: https://physionet.org/content/bidmc/1.0.0/ (Pimentel et al., 2018). This dataset contains signals from the much larger MIMIC II matched waveform database, along with manual breath annotations made from two annotators, using the impedance respiratory signal (Goldberger et al., 2000). The data was collected from critically ill patients at the Beth Israel Deaconess Medical Center (Boston, MA, United States) during hospital care. There are a total of 53 recordings of 53 patients within the dataset and each one is 8 min in duration. Each recording includes the ECG and the PPG sampled at 125 Hz and other physiological parameters such as the heart rate (HR) and respiratory rate (RR) sampled at 1 Hz. They also contain fixed parameters, such as age and gender for each patient.
3.2: Steps
The proposed algorithms in this work replace the estimation of RR and fusion of RR with machine learning, as shown in Fig. 5. The reason for keeping extraction of the RR signal is to eliminate unnecessary noise and frequency components from the raw signal.

3.3: RR signal extraction
As described in Pimentel et al. (2017), the first fundamental stage of the RR algorithms is extraction, in which a time series dominated by respiratory modulation is extracted from the original signal (Pimentel et al., 2017). As illustrated in Fig. 3, the RR signal is extracted from the ECG (blue plot; dark gray in print versions) and the PPG (orange plot; medium gray in print versions) as well as RR (yellow plot; light gray in print versions) signals.
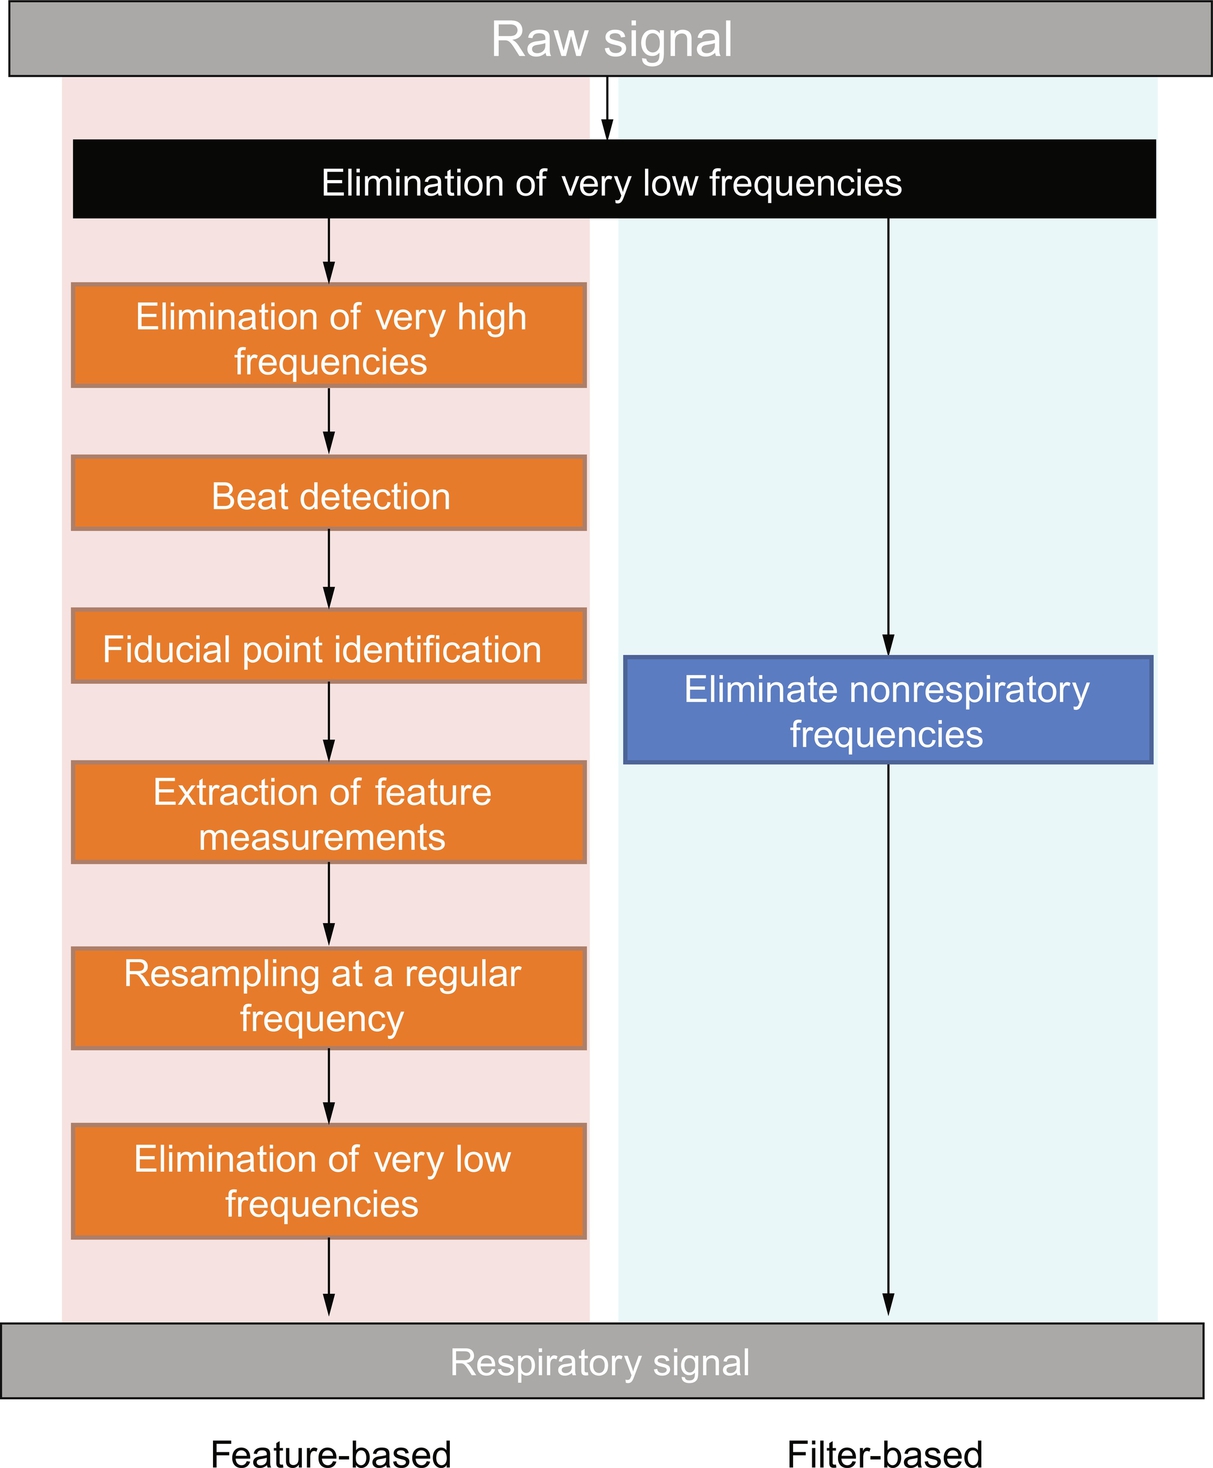
The algorithms of RR signal extraction, as mentioned previously, have more than 100 types. They have been split into one of two main methods: filter-based extraction and feature-based extraction, as shown in Fig. 6. The algorithm used in this work is feature-based extraction: extracting a component, such as pulse wave amplitude, from each cardiac cycle. Feature-based extraction has six components, as shown in Fig. 6: elimination of very high frequencies (EHF), beat detection with R-spike detection (RDt), fiducial point identification (FPt), extraction of feature measurements (FMe), resampling at a regular sampling frequency (RS), and elimination of very low frequencies (ELF).
3.4: Machine learning
A neural network (NN) and support vector machine (SVM) were used in the work. They were both tested on the ECG and the PPG.
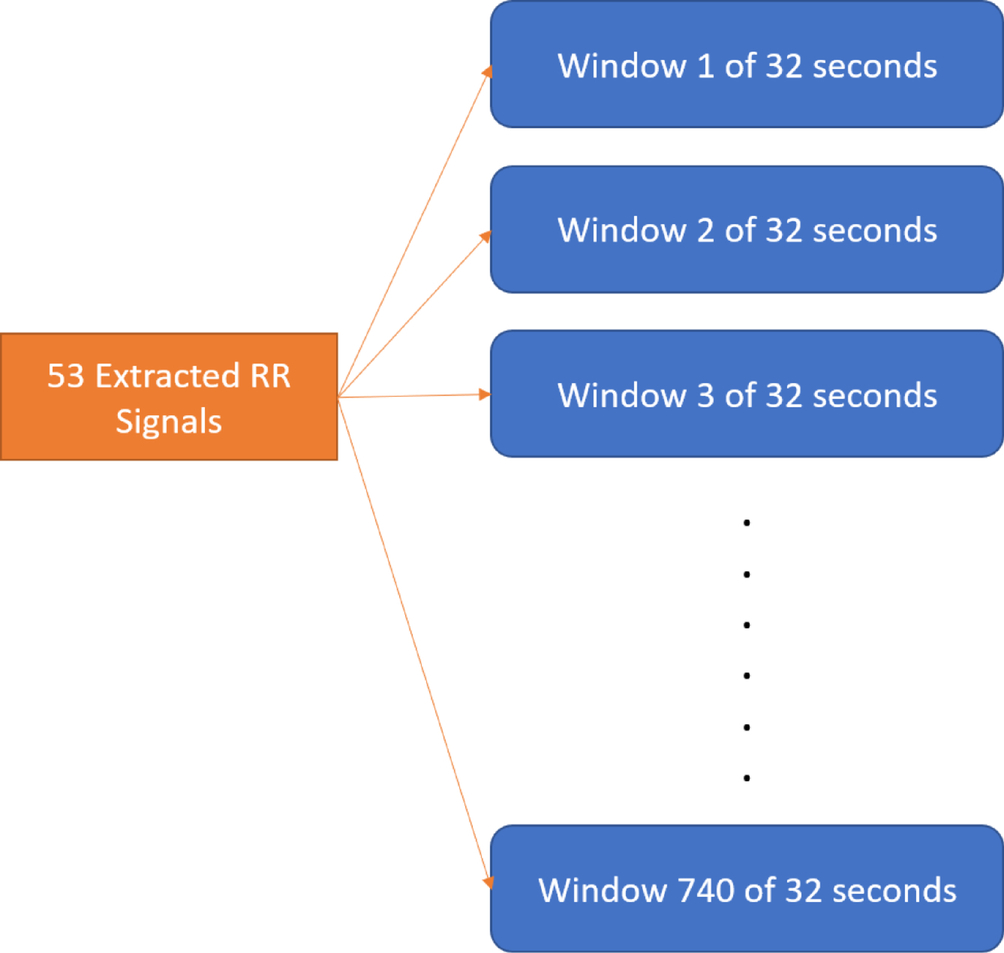
Features. The extracted RR signals are used to estimate RR with a moving window of 32 s. The signal data from each window of 32 s becomes the input data for future machine learning. Each recording is about 8 min long and produces around 14 windows. The total number of windows over 53 recordings are exactly 740, as shown in Fig. 7, and these windows become features of this work. The reason is that wearable devices are not as powerful as hospital and clinic applications, and it is necessary to reduce the amount of hardware power and energy by treating the entire collection of windows as features.
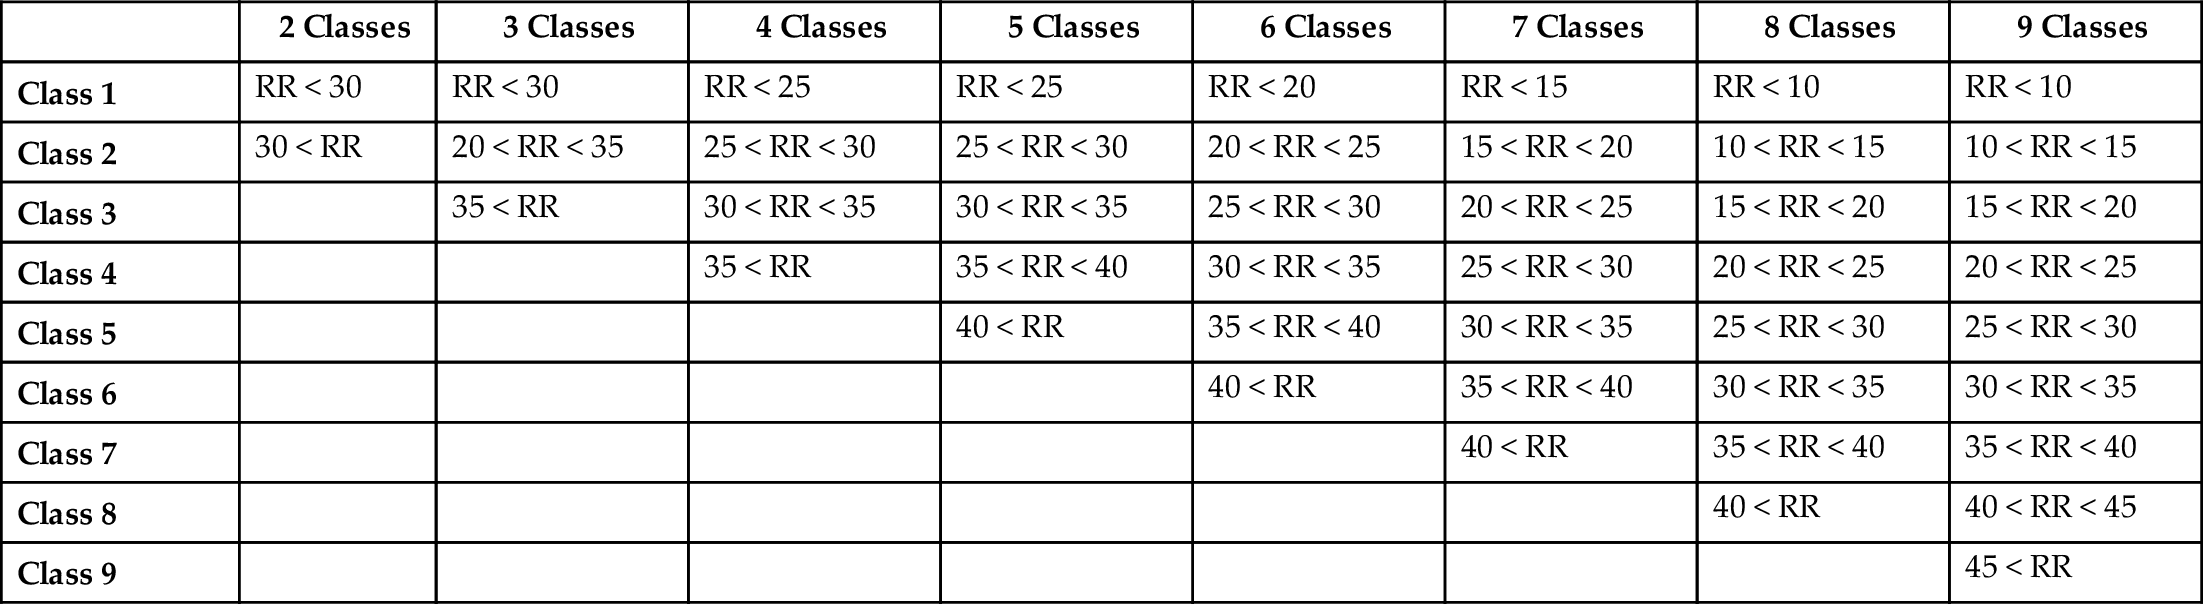
Classes. The RR results estimated from one of the traditional estimation algorithms are used to label the class of each window. The traditional estimation algorithm chosen for this work is a frequency-domain technique called autoregressive spectral analysis, using the median spectrum for orders 2–20 (ARM). Then it is fused using a modulation-fusion technique called Smart Fusion (SFU). Table 1 introduces different respiratory rates among different age ranges. However, 30 breaths per minute falls into the first three rows of Table 1, so the number of classes is not settled in this work, as shown in Table 2.
Table 1
| Age range | Normal respiratory rate |
|---|---|
| 0–12 months | 30–60 per minute |
| 1–3 years | 24–40 per minute |
| 4–5 years | 22–34 per minute |
| 6–12 years | 18–30 per minute |
| 13–18 + years | 12–16 per minute |
Table 2
| blank cell | 2 Classes | 3 Classes | 4 Classes | 5 Classes | 6 Classes | 7 Classes | 8 Classes | 9 Classes |
|---|---|---|---|---|---|---|---|---|
| Class 1 | RR < 30 | RR < 30 | RR < 25 | RR < 25 | RR < 20 | RR < 15 | RR < 10 | RR < 10 |
| Class 2 | 30 < RR | 20 < RR < 35 | 25 < RR < 30 | 25 < RR < 30 | 20 < RR < 25 | 15 < RR < 20 | 10 < RR < 15 | 10 < RR < 15 |
| Class 3 | 35 < RR | 30 < RR < 35 | 30 < RR < 35 | 25 < RR < 30 | 20 < RR < 25 | 15 < RR < 20 | 15 < RR < 20 | |
| Class 4 | 35 < RR | 35 < RR < 40 | 30 < RR < 35 | 25 < RR < 30 | 20 < RR < 25 | 20 < RR < 25 | ||
| Class 5 | 40 < RR | 35 < RR < 40 | 30 < RR < 35 | 25 < RR < 30 | 25 < RR < 30 | |||
| Class 6 | 40 < RR | 35 < RR < 40 | 30 < RR < 35 | 30 < RR < 35 | ||||
| Class 7 | 40 < RR | 35 < RR < 40 | 35 < RR < 40 | |||||
| Class 8 | 40 < RR | 40 < RR < 45 | ||||||
| Class 9 | 45 < RR |
4: Experimental results
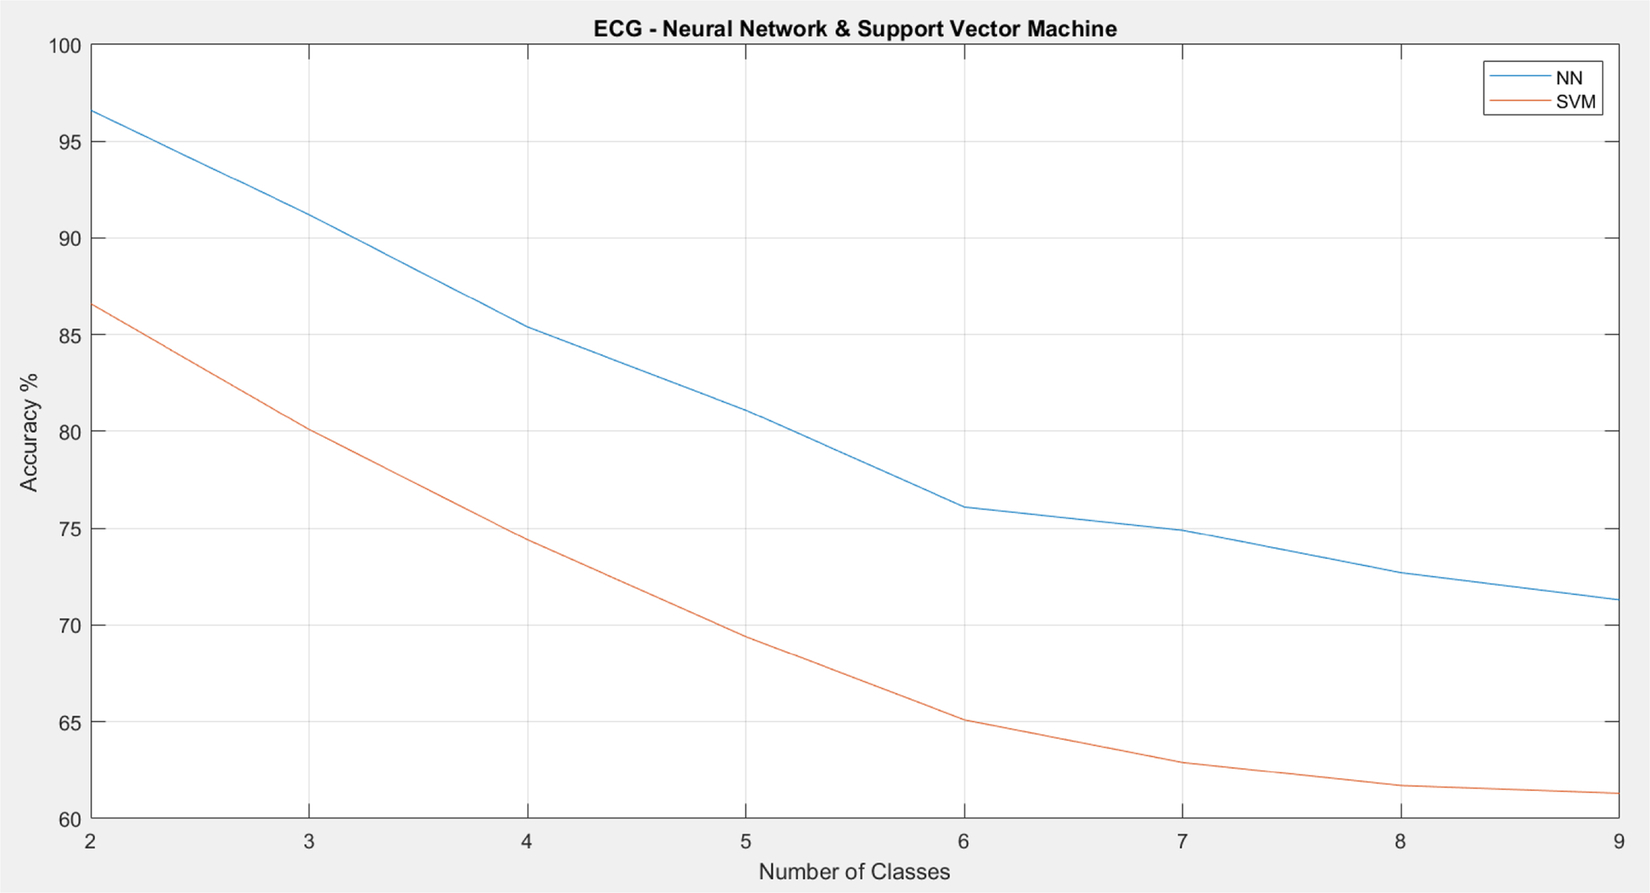
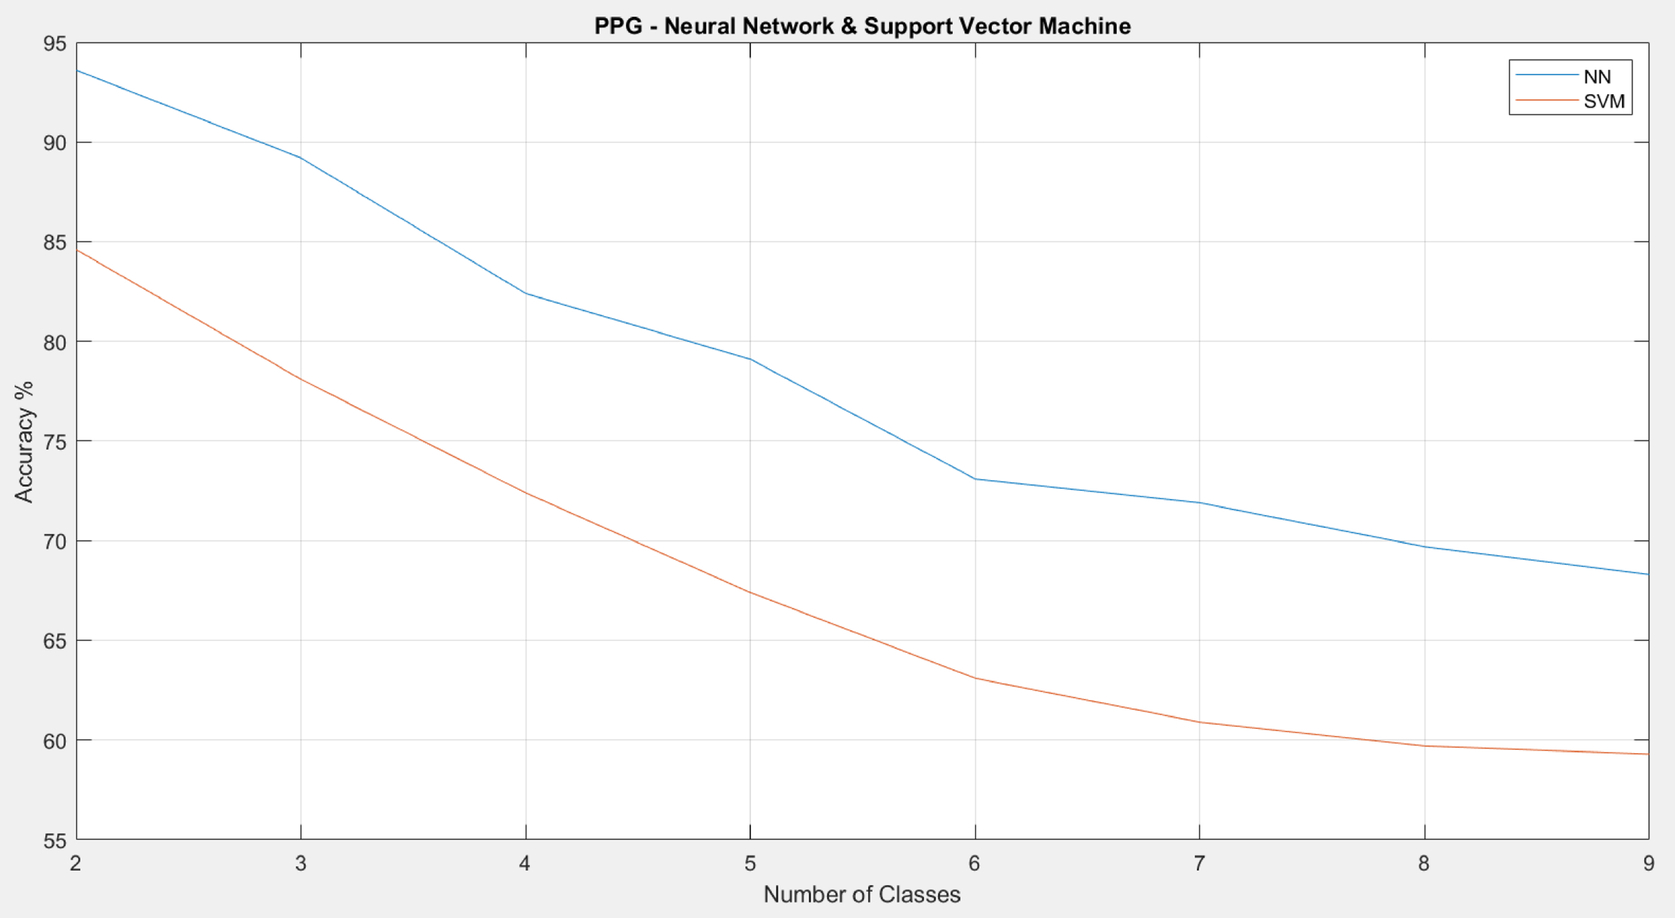
As shown in Figs. 8 and 9, the proposed RR estimation algorithm on ECG generally has a higher accuracy than that on PPG. The traditional results also demonstrate that estimation on ECG has a higher accuracy than that on PPG on average. For both types of signals, the accuracy drops significantly once the number of classes increases. For the neural network (NN), the accuracy is below 80% when there are more than five classes. For support vector machine (SVM), the accuracy is below 70% once there are more than four classes. In addition, NN outperforms SVM in general.
5: Discussion and conclusion
The goal of this work was to demonstrate the usefulness of machine learning in RR estimation and its potential for further study in wearable devices, and this goal has been achieved. The accuracy of RR estimation from ECG is above 80% when there are five classes. Five classes for RR estimation is probably enough to monitor a patient or healthy person’s “fitness” status. Estimation from the ECG has a higher accuracy than that from the PPG, so treating the ECG as input data is preferred. The accuracy of this work has room to increase, and there are many other features that can be generated, such as spectra from the short-time Fourier transform (STFT), as well as other signal feature generation algorithms. In addition, deep learning is an effective method of replacing traditional machine-learning algorithms and probably can provide better results. In the future, there is a need to explore other machine intelligence techniques, such as random forest and the echo state network, to improve the accuracy. However, most wearable devices are tiny and do not have the power or processing speed to generate features while trying to conserve their battery life. Thus finding the balance between the complexity of RR estimation algorithms and the amount of energy being distributed to this from wearable devices is important.