
It all starts with an email, as a consequence of abnormal behavior in the IT system. This time, it appears that an Elastic ML node has spotted a potential DNS exfiltration attack. The following screenshot shows that there were unusual activities against a given domain, originating from a server called server_101:

The alert shows a high anomaly score, 95, signifying a very unusual situation. Elastic Alerting can send emails like the preceding one based on conditions such as the anomaly score value. The creation of such an alert based upon the anomaly score is quite simple, and in Chapter 6, Alerting on ML Analysis, we will discuss Alerting in more depth. For now, you can see that the Alerting configuration can easily allow the user to create a threshold-based alert using that field:

This configured alert will run every minute and will check the last 5 seconds to see whether there are documents where the max() of the anomaly_score field, which is self-explanatory, is above 70.
The email contains a link to Kibana, which is contextualized to the period of time where the anomaly occurs. Clicking on the link will bring you directly to the Elastic ML Anomaly Explorer view:

In the context of our use case, the preceding Anomaly Explorer view shows some abnormal activities for some domains such as vodkaroom.ru, which besides the name, displays suspicious activities (see the red tile in its swim lane). In the table at the bottom, you can see that this domain has an anomaly with a score of 94. The job that detected this anomaly has been configured to inspect DNS data for evidence of exfiltration/tunneling, in which the high_info_content function is aimed at the sub_domain field. The configuration in the Advanced job wizard looks as follows:
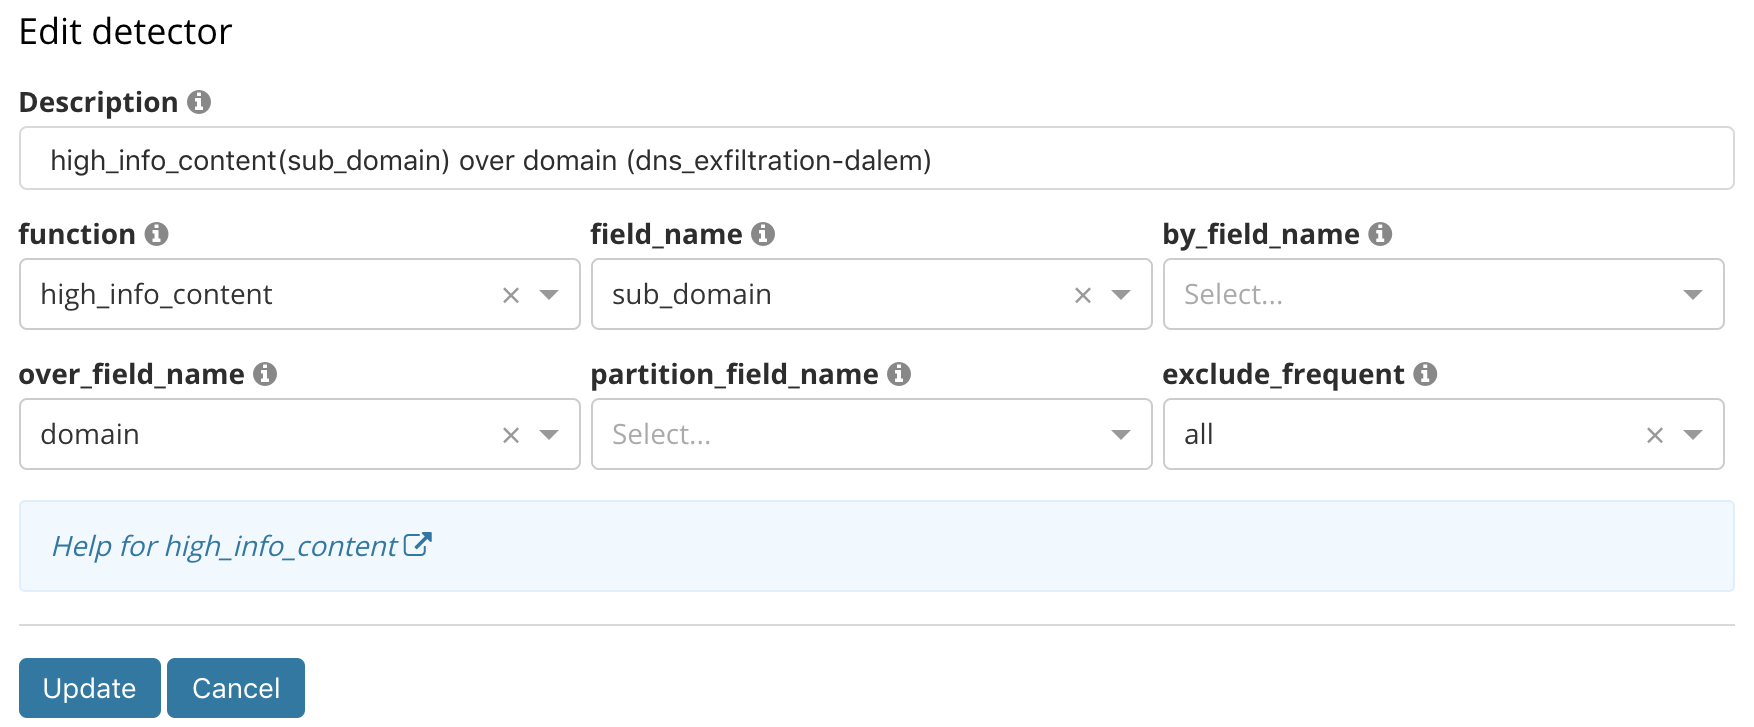
As stated earlier, the DNS tunneling technique encrypts data into that sub_domain field, thus giving the field a high amount of information content in the string itself. The ML job is configured as a population analysis where the population is defined by all high-level domains. Therefore, the job finds cases of high information content in the subdomain of the DNS requests across all domains, comparing each high-level domain against its peers, surfacing the most unusual domains.
From there, we know that an exfiltration happened, and we also know from which system it originated. If you look at the Influenced by column, you will notice that server_101 is spotted as a significant influencer of the anomaly.
In fact, looking at the Top Influencers list on the left-hand side of the Anomaly Explorer also corroborates that vodkaroom.ru and server_101 are the most unusual domain and hostname during this time period:
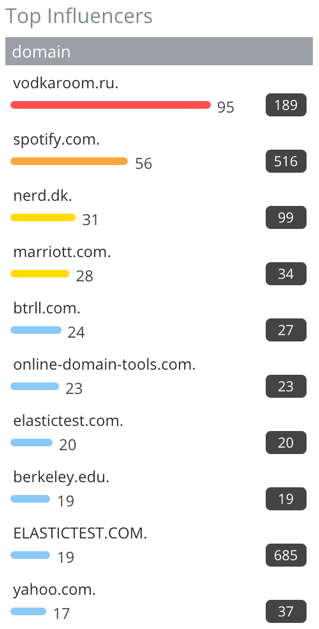
The following screenshot shows the Top Influencers server_101:

They are both the highest ranked influencers in the lists.
We need to investigate this machine and domain, and if we look at the detail of the anomaly, we can see that the amount of information in the sub_domain field is 100 times higher than usual:

Elastic ML allows for the creation of a dynamic link to any URL, such as a Kibana dashboard. This is described in the documentation, which can be found at https://www.elastic.co/guide/en/elastic-stack-overview/current/ml-configuring-url.html.
This has been implemented in this case; an Open link button exposes a list of user-defined custom links. In our case, we defined a link called Explore Server:

Our custom link, Explore Server, passes the name of the server (the appropriate beat.hostname) to a subsequent dashboard so that it can be filtered to only show the hostname that was an influencer on this anomaly (in our case, beat.hostname:server_101):

It filters the dashboard to the machine that is the source of the exfiltration. Because this dashboard also contains visualizations of other data types as well, we can also see that server_101 has a visually interesting pattern of SSH login attempts:
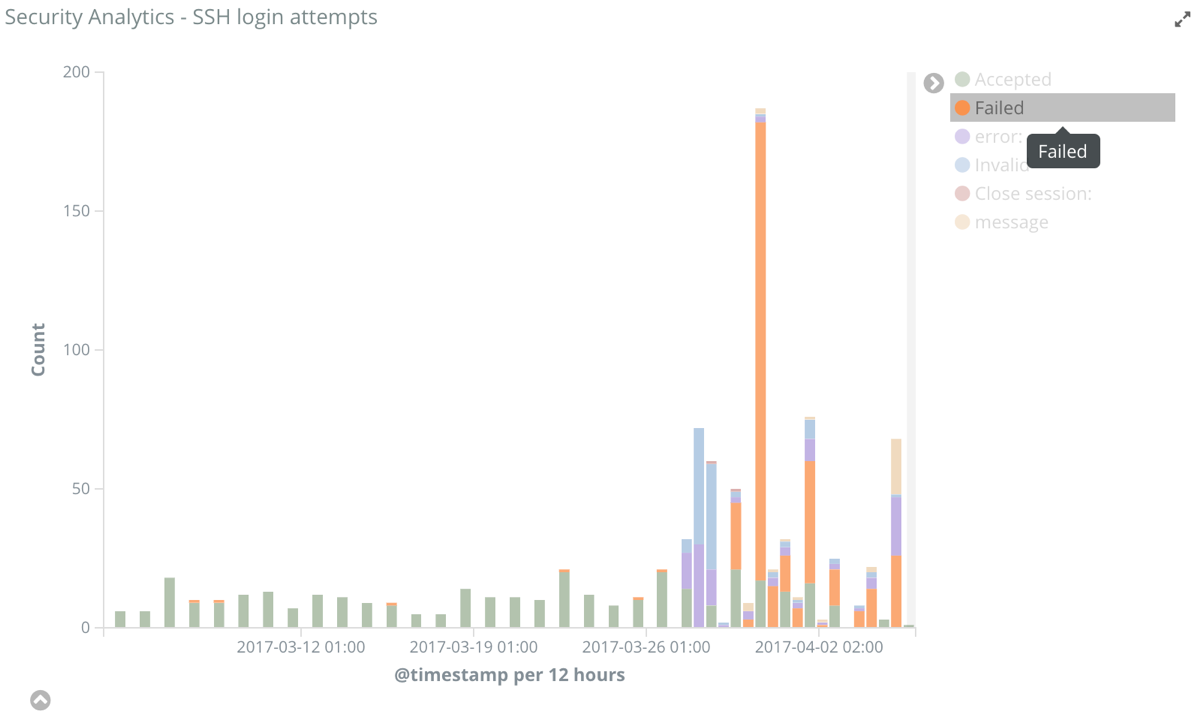
This visually interesting anomalous pattern can, of course, also be automated in its own ML job, which will monitor login attempts.
Another section of our custom dashboard shows a data table highlighting the details of those login attempts. Inspection of the data shows that a user finally manages to connect:

Since we have also made geolocation enrichment at the time of ingest, the authentication document contains information about the physical location of the user that is authenticating. This is very useful to understand the location of those login attempts, and if the location of the attempt is unusual as well:

In addition to enriching the data with geolocation, we can also track whether any machine in our environment had been in contact with a potential threat. As mentioned earlier, a threat database is cross-referenced during ingestion, and any interaction with an IP address on a known threat list will be tagged and visible in this visualization of our dashboard:

The preceding screenshot shows that our machine of interest (server_101) has touched two IPs on a threat list multiple times over time.
With a growing list of suspicious activities relating to this machine, we are led to create a job to detect a brute-force attack, specifically because a high amount of login attempts have been made on this machine:

Once the job has been created to automate this part of the investigation, you can display it alongside the other job to make a correlation with the previous one and confirm the attack scenario.
The following screenshot shows the anomaly timeline for the two jobs (the brute-force job being a simple high count over the system.auth.ssh.ip configuration):

What we see in the preceding screenshot is very interesting, both in terms of the scenario and also in terms of the attack itself. Clearly, we had a brute-force attack (orange square) that happened before the exfiltration, indicating that once the machine was accessed, some sensitive information was exfiltrated.
If we were to analyze this in greater detail, we will see the source IP of the brute-force attack in the influencers (24.151.103.17), the target machine (server_101), and the user ID used to authenticate (elastic_user_0), as shown in the following screenshot:

But what is even more interesting is the fact that the brute-force attack wasn't intense from the connection rate standpoint. We can theorize that the adversary did this on purpose to stay under the radar of a classic security solution that would use a static threshold.
Here, even if the rate is low, we still get an anomaly with an average score, but we are able to detect it anyway:

Moreover, since we have made a population analysis with ML, we are not analyzing the IP independently, but rather comparing the behavior of the different IPs against each other. So, even if an IP address appears in the data just for a short period of time—which wouldn't be enough to build a model out of it—if the behavior is significantly different from the normal IP profile, then it is spotted, as illustrated in the following screenshot:

Here, you can see that the IP produced a connection spike that couldn't have been captured if we had partitioned the analysis, since the lack of substantial history wouldn't have given ML a chance to build a proper model.
Looking at the details of the anomaly, our suspicions are confirmed about the brute-force attack. Again, this is an activity that's hundreds of times higher than the norm:

Now, knowing that we did have a brute-force attack, and the fact that we have geolocation data, it is interesting to enrich our investigation with other insights such as the login time and location.
Here, we created two more jobs to confirm what we think. elastic_user_0 has been used during the usual time of day and an unusual location, as shown in the following screenshot:

We can see that all of this unusual behavior has happened in relatively the same time frame as the brute-force attack. We can dig into the traffic by using a custom link to the Discover tab (via a custom link):

In the resulting Discover view, we can see a very interesting indication; the connection has been made from a laptop named mikep:

To confirm that the suspect behavior is coming from the mikep laptop, we can leverage yet another Kibana dashboard that describes the domain traffic, ports, and also the processes that have been executed. We can clearly see a high amount of outbound port usage from mikep:
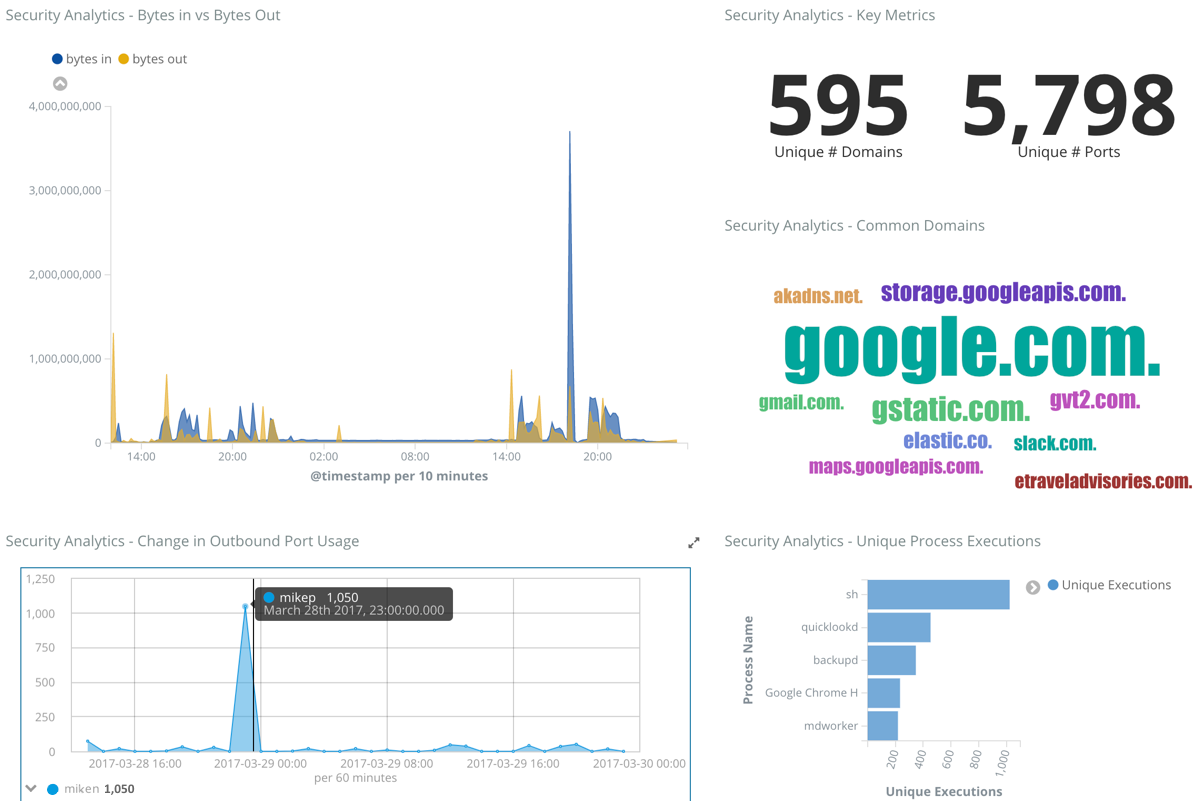
This is yet another step in the investigation that could be automated with ML, as scanning the ports was required for the adversary to understand how to intrude server_101 through a brute force authentication. This is illustrated with the anomaly timeline, which now includes the port scan jobs and shows two interesting aspects:

The first thing we notice is that we had a port scan not very long before the brute-force attack. If we click on one of the port scan anomalies, we can see that the port scan comes from the mikep laptop and targets server_101's IP address:

The second thing we can notice in the anomaly timeline is the fact that the port scan happened multiple times before the actual attack, so the adversary has been doing reconnaissance for a long time:

The other aspect we can notice in the previous Kibana dashboard is the processes that were executed on the mikep laptop, which might indicate that a piece of malware was responsible for the attack. The detection of unusual processes running on systems is also something we could automate with ML: we could build a job that looks for rare processes per machine (rare by process_sig, partition_field_name="beat.name"). If we created such a job, it would highlight that some intriguing processes have been executed on the machine:

Now that we have pretty much the whole kill chain, we could investigate to find similar behavior to that attack, or maybe look at another machine that could potentially be infected.
For this, we can use an existing dashboard that contains a data table of the top domain that has been reached. It doesn't come as a surprise that we can see vodkaroom.ru at the top:

The interesting bit here is the link that had been added as a column in the data table. This allows the user to jump into the Elastic Graph visualization, as shown in the following screenshot:

Elastic Graph allows you to reveal the connections between documents of the same index, which here is showing the connection between mikep and vodkaroom.ru. In addition, we can see that mikep is not the only laptop connected to that domain—asawari is another one—plus the fact that other domains are connected to them, which might be suspicious as well.
One of the default modes of Elastic Graph is to remove noisy or popular data and only establish connections between relevant data. The drawback in this use case, however, is that we actually want to reveal popular connections that would translate to highly interesting entities for our suspicious behavior.
Thus, the solution is to disable the Significant links option, as shown in the following screenshot:

If a domain node is selected and expanded (here, this is happening on the vodkaroom.ru node), we'll see the connection to server_101, since there are many documents that share those terms in the DNS traffic index:

As we can see, this diagram in Elastic Graph corroborates our suspicions about the relationship between server_101 and vodkaroom.ru. But are there any other interesting connections? Exploring further by clicking the link button in Elastic Graph yields yet more information:

The preceding screenshot shows that, in addition to the mikep and asawari systems communicating with vodkaroom.ru, those two systems have also communicated with victoryartbrew.com. Perhaps this is a coincidence, but it's also a potentially important clue as to how the original malware was first acquired. Perhaps the asawari system is also currently infected but hasn't yet exhibited other malicious behavior. This gives us the opportunity to thwart future risky activity from that machine.