PRIMER
VISUALIZING WITH IMAGEJ
Free image/video processing software creates vivid representations of time, movement, and data.
ImageJ is a free, cross-platform program for processing images and videos. Its author, Wayne Rasband, originally wrote it for use by biomedical researchers working with microscope images. But he designed it with an open architecture so anyone could write plugins to add new tricks to the program. As a result, its capabilities are constantly growing and improving, thanks to contributions from the more programming-savvy among its users.
But ImageJ isn’t yet well-known outside of the scientific community. As a scientist and fan of creative tinkering, I thought it would be fun to introduce MAKE’s readers to some of the tricks it can perform.
ImageJ processes images using filters similar to those in programs like Photoshop. These filters are written as plugins, and there are hundreds available.
In his Country Scientist column, Forrest Mims has described using ImageJ as a tool to make scientific measurements (see MAKE Volume 18, page 42, and subsequent columns). But my favorite tricks are the ones that transform a video into a single image, and those that perform math on images — combining two images by adding their pixel intensities, for example.
This article explains how to get started with ImageJ, then describes some of my favorite ImageJ recipes. Starting with a few interesting images or a short video captured by a digital camera or a webcam, you can cook up any of these example images within about 20 minutes.
Bob Goldstein is an occasional contributor to MAKE and a cell biologist at the University of North Carolina at Chapel Hill.

Gregory Hayes
DOWNLOAD IMAGEJ AND PLUGINS
On a Mac or Linux computer, download ImageJ from the Research Services Branch of the National Institutes of Health (NIH) web-site, imagej.nih.gov/ij. (PC users can skip this step; the PC download has ImageJ included.)
ImageJ comes with several valuable plugins already populating its plugins folder, but you’ll want to add more. The NIH website has a huge number to choose from, with bewildering names like Lipschitz Filter, so I recommend starting with the small, useful bundle published by the microscopy group at McMaster University.
Download the bundle from macbiophotonics.ca/downloads.htm and move it into the folder ImageJ/plugins (for PC users, this download includes the ImageJ application, so the one download is all you’ll need).
The McMaster site includes some simple instructions for allocating system memory before you begin. ImageJ is a memory hog, and following these directions before you launch the program will save you headaches later.
Once you’ve installed ImageJ, it can be interesting to open a photo or import a video and just start clicking away to see what various buttons do. For a more systematic start, you can follow the User Guide, available under the Documentation link at rsbweb.nih.gov/ij. The Plugins link on the same page lists additional plugins with short descriptions, and you can install most of them by simply moving them into your plugins folder.
CREATE IMAGES
Here are some examples of what you can do with ImageJ. For each, I’ll give a short description, sample images, and a step-by-step protocol that explains how to do it with your own photos and videos. The letters (A–F) correspond to the images shown.
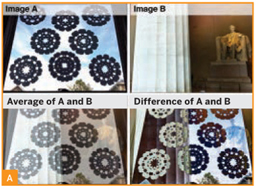
A. IMAGE CALCULATOR: TWO IMAGES COMBINED
The Image Calculator tool can combine images using simple arithmetic; for example, by adding, subtracting, or averaging the colors of each pixel. In the 4 sample images above, the lower left-hand corner pixel of the snow-flake image has an RGB color of 12,6,10, while the lower left Lincoln pixel is 70,54,42. (RGB encodes colors as 0–255 each for red/green/blue, where 0 is darkest and 255 is brightest.) Averaging these two values results in a pixel with a color of 41,30,26. Image Calculator combines the pixels of all images this way.
Scientists might not need to combine images of paper snowflakes and the Lincoln Memorial, but the Image Calculator can be a powerful tool for combining other images in predictable ways. For example, it brings out differences between 2 nearly identical photos, as in Garry McLeod’s photos (A), opposite.
Bob Goldstein

Garry McLeod (A)
![]() TIPS: You’ll see a number of ways to open files of different formats under File → Import, but there’s an easier way: most files can be opened by dragging and dropping them onto the gray bar below the row of tool icons. On a PC, some formats will be difficult to open (color .mov files, for example). You can use Quicktime Pro or other programs to convert these to other formats, such as .avi.
TIPS: You’ll see a number of ways to open files of different formats under File → Import, but there’s an easier way: most files can be opened by dragging and dropping them onto the gray bar below the row of tool icons. On a PC, some formats will be difficult to open (color .mov files, for example). You can use Quicktime Pro or other programs to convert these to other formats, such as .avi.
Protocol: Click File → Open to select an image on your computer, and repeat to open a second image. Click Process → Image Calculator, select each of your image names, then select an operation like Average or Difference to combine the images.
B. Z-PROJECT A STACK: LIGHTNING FLASH
Here I started with a short video I captured of a lightning flash, which took about a second to cross the sky. On the video, distinct parts of the flash could be seen in separate frames (Figure B, frames 1 through 8). To see what the entire lightning bolt looked like, I combined all the video frames into one image using the Z Project tool. This effectonly works well with video captured from a stationary camera position.

Protocol: Before opening a video file, you may need to use a video editing program to shorten its length or lower its resolution. ImageJ has no problem with 800×600 pixel videos of a few hundred frames, but longer videos with much larger dimensions can slow or crash the program.
Once your video is opened in ImageJ, click to select it. (You can scroll through it using the < and > keys.) Click Image → Stacks → Z Project, and choose Max Intensity to add up the brightest pixels from each frame.
(The montage in Figure B was also made with an ImageJ tool. Select your video and click Image → Stacks → Make Montage to see options for making montages.)
C. Z-PROJECT A STACK: PELICAN FLIGHT
The image in Figure C was made in a similar way to the lightning flash, but here the subject was darker than its background. The video was taken by a stationary camera, pointing at the sky as birds flew overhead. I then Z-Projected a 2-second segment, about 30 frames.

Protocol: Open your video. Click on your video to select it, then click Image → Stacks → Z Project, and choose Min Intensity to add up the darkest pixels from each frame.
D. COLOR-CODING TIME: STAR PATHS ACROSS THE NIGHT SKY
I made a time-lapse film of the stars passing over my yard from dusk to dawn. (I used a Canon camera hacked with open source Canon Hack Development Kit, or CHDK, software to do long-exposure time-lapse recording).
I used ImageJ to make a black and white film of only the moving objects by subtracting everything from each frame that was also in the previous frame. I then time-coded the resulting film by color, with purple slowly turning to yellow.
Lastly, all the colored frames were projected onto a single image. In the final image, purple objects were the ones visible just after sunset, and orange/yellow objects, like the clouds, appeared around sunrise. Stars moved across the field of view at all times.

Protocol: Open a video. When the “convert to 8-bit grayscale” option pops up, accept it. Click on the video to select it, and make a second video showing only the moving objects by clicking Plugins → Stacks — T-Functions → Delta F. To color-code the time, click Plugins → Stacks – Z-Functions → Z Code Stack, and select a color scheme. Finally, click Image → Stacks → Z Project, and choose Max Intensity to add up the brightest pixels from each frame.
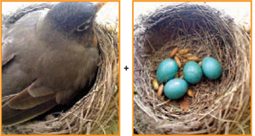
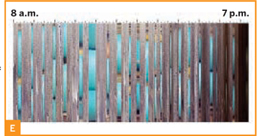
E. KYMOGRAPH: MOTHER ROBIN’S NEST TIME GRAPH
My sons and I found a robin’s nest on our house, and we were fascinated to have a peek. So we set up a webcam and watched the nest. One day we made an all-day, time-lapse recording. The mother sat on the eggs throughout the day, periodically taking trips away, presumably for food.
We were curious to see if there were any obvious patterns to the timing of her trips, so we made a kymograph, which displays a single slice of the image along one dimension, with time running along the other dimension.
The kymograph in Figure E marks the time in 10-minute intervals along the top, running from morning at the left to evening at the right. When the blue of the eggs is visible in the vertical stripes, the mother bird was out of the nest, and you can see how the egg positions changed with each maternal visit.
We had read online that robins never leave their nests for more than 10–15 minutes at a time, but it looks like this bird took a long lunch from around 11:40 a.m. until noon. It got dark just before 7 p.m.
Protocol: Open a video, then select the straight line tool from the row of tool icons, and click and drag to draw a line over an area of interest in the video (here, the eggs). Click Image → Stacks → Reslice to see what happened under that line over time.
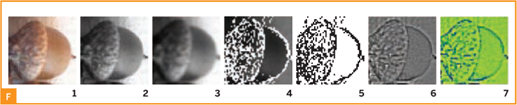
F. IMAGE PROCESSING WITH A SPREADSHEET
You can extract the pixel values from an image and transform them yourself in a spreadsheet program like Microsoft Excel. It’s interesting to see how features like local contrast can be highlighted this way.
Here, I started with a 50×50 pixel image of an acorn (Image 1 above), then generated several versions using simple formulas in Excel. Image 2 is a grayscale version of 1. In 3, I blurred the image by averaging each pixel’s value with that of its neighbors. In 4, I highlighted high-contrast areas by comparing each pixel with its neighbors. Image 5 shows only the high-contrast areas. In 6, the contrast values that I used to make 5 were converted into continuous grayscale (6), and in image 7, this grayscale image was converted to color (in ImageJ, not Excel) using a lookup table.
Protocol: First, I recommend that you select (or crop or resize down to) a tiny image of about 50×50 pixels, as each step that follows will work very slowly on larger images.
Save an image using File → Save As→ Text Image. This produces a text file that you can open in a spreadsheet program. In the spreadsheet (I used Excel), you’ll see an array of numbers representing the pixel values in a grayscale version of your image. In Excel, I transformed the pixel values using a variety of formulas (see makezine.com/27/primer for a sample spreadsheet).
After manipulating the numbers in the spreadsheet, I copy-pasted those cells into a text editor (I used TextWrangler for Mac) and saved it out as a plain text file (.txt). Back in ImageJ, I opened the file with File → Import → Text Image. For the final transformation, from Image 6 to Image 7, I clicked Image → Lookup Tables and selected a color scheme for coloring the grayscale image.
CONTRIBUTE TO SCIENCE!
Makers and scientists both constitute creative communities that could learn a thing or two from each other. If you can program in Java, and you see an interesting way to display images that no existing ImageJ plugins can yet do, why not write a new plug-in? Hundreds of plugins exist already, but the best ones probably have yet to be written.
If you do write a new ImageJ plugin, you can add it to the wiki at imagejdocu.tudor.lu.
Who’ll make use of your plugin, and what scientific discoveries might it help propel? Biomedical research articles are increasingly found in full form online, so in the months and years to come after submitting a plugin, search online for its name to find out! ![]()
RESOURCES
» ImageJ software: rsbweb.nih.gov/ij
» McMaster Biophotonics Facility ImageJ software library: macbiophotonics.ca/downloads.htm
» ImageJ Information and Documentation Portal — includes a wiki where new plugins can be added: imagejdocu.tudor.lu
» FIJI — a distribution of ImageJ with Java and well-organized plugins: fiji.sc.wiki