A Brief Summary of the NAVAIR Study
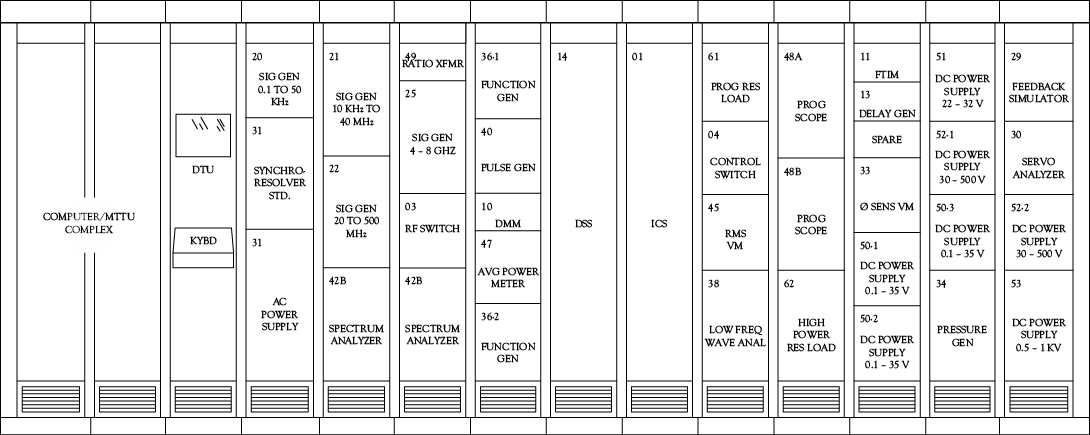
Figure A1.1 shows a high-level descriptive diagram of a complex repair process, used to capture the flow of materials in the repair cycle for aviation electronics (“avionics”) in the U.S. Naval Air Force (technically the Naval Air Systems Command, or NAVAIR), which has much to do with the development of WFMA as covered in this book. Each of the blocks in this diagram is a high-level view of a great deal of detailed activity in different physical units on an aircraft carrier or at a shore base.

Figure A1.1. The avionics repair cycle in the U.S. navy aircraft intermediate maintenance department (AIMD).
Source: Adapted by permission of the publishers, in The Information Processing Theory of Organization by John L. Kmetz (Farnham: Gower, 1998), p. 140. Copyright © 1998.
Note that unlike figures of workflows in this book, this is not a WFMA workflow map as discussed in Chapter 3. This diagram was created at the request of a Navy client for legibility and conservation of page space, so that the entire repair cycle could be shown on one page. It does not conform to the discipline of workflow mapping as covered in Chapter 3—it uses nearly square “rectangles” for the process blocks; there are multiple blocks with more than one exit arrow; there are double-headed arrows made of dotted lines instead of solid lines, etc. The arrows have been numbered and labeled to guide readers through the flow of processes and locations represented in the diagram; however, without extensive documentation this diagram was much more difficult for many users to follow than a workflow map. It was accompanied by 10 pages of text that explained every process and arrow in detail, and took at least 30 minutes to present if there were no questions.
This actually portrays a very effective design for a maintenance process that is entirely contained on the carrier or shore site. It begins with a simple one-for-one exchange of an “avionics component” (AC) from an aircraft, where a technician-sailor pulls a failed unit from an aircraft (arrow 1) and turns it in to a screening unit, at which point it enters the repair cycle shown in arrows 2 through 13. However, the sailor should be able to obtain a ready AC from supply and install it in the aircraft (arrow 14) without delay, and thereby immediately return the aircraft to operational status. In short, this is nothing but a remove-and-replace process where the failed unit is removed, turned in, and exchanged for a unit of the same item ready for installation. All of the repair cycle in the rest of the map is invisible to the sailor on the deck fixing the aircraft.
The problem that the Navy encountered during the Cold War was that this workflow depended entirely on one tester, the VAST system shown in the lower-right corner of Figure A1.1. It seemed that this tester was unable to produce repaired ACs in sufficient numbers to support the requirements of the air wing once flight operations began in earnest on a deployment. That meant that the supply of ready ACs in the supply pool was depleted, and when a sailor brought a failed AC from an aircraft, there might not be (and often wasn’t) a replacement AC available. This was a major readiness issue for the Navy for many years.
I became involved in the study of this workflow as a member of the faculty of the University of Southern California’s Systems Management Center (long since reorganized and merged into other parts of the university), where we attempted to screen and compile a number of engineering and logistics support studies of the VAST tester and its performance, and from this determine why this tester appeared to be failing to meet its production expectations. We found, quite simply, that it was not failing, and that all we could do was propose a more comprehensive study of the entire avionics maintenance process in NAVAIR. This modest start led to my 15-year-long program of work in the avionics maintenance field.1 We figured out that the problem with VAST was not a problem with VAST at all, but instead with the information processing capacity inherent in the Navy’s maintenance system. Part of this required information technology to resolve, but the most important part was understanding the relationship between VAST and its effects on the maintenance workflow. Armed with that understanding, one of the units I worked with was able to design software and process changes to cope with the “VAST problem” by early 1983, and within the next two years problems of production in the VAST avionics workflow had largely been eliminated.
(In doing this I became far more knowledgeable of the NAVAIR maintenance workflow than I had ever thought would happen, and so worked on the next generation of automatic testers, helped write technical proposals for major prime- and sub-contractors, and had opportunity to see the results of earlier work on Fleet readiness. Without realizing it, I had become somewhat of a “national expert” on the subject, at least according to the Royal Canadian Air Force—I was asked in 1989 to do a study of their avionics maintenance process, and was so labeled by the principal logistics officer who requested me.2 The Canadians bought F/A-18 Hornets in 1980 to replace a group of older aircraft in their air force, and since the F/A-18 is a U.S. Navy design which used a newer version of VAST for avionics maintenance, they came to NAVAIR and the VAST contractor for help when they began to encounter the same problems the U.S. Navy did. Their problem was the same as the NAVAIR’s, and it was not the tester.)
Part of the problem was that the “repair cycle” was complicated, and even more so that Figure A1.1 suggests. In brief, this figure reduces the complexity to the essential 14 flows in the repair cycle shown, which are:
Arrow 1. |
An AC indicated as not working (from aircraft pretest or in-flight failure) is removed by a maintenance technician (sailor). The sailor turns it in to a screening unit that is part of the larger supply organization, and should immediately be given a replacement to install on the aircraft (Arrow 14). |
Arrow 2. |
A few things cannot be repaired on the carrier and are removed from the repair cycle as beyond capability of maintenance. |
Arrow 3. |
On-site repairables are turned over to production control, and are now on awaiting maintenance status. |
Arrow 4. |
VAST-repairable ACs are released to the VAST shop for testing. |
Arrow 5. |
Parts identified by VAST testing (“cards” similar to computer cards and adapters) are removed and turned into Screening, and should immediately be replaced by new ones (Arrow 11) to repair the AC. |
Arrow 6. |
Cards repairable on site are sent to other specialized shops to be repaired, and some of these generate an additional failed-parts flow (Arrow 7), which is handled like ACs. |
Arrow 7. |
Small parts are screened and either put into the repair cycle or junked because they are consumables. |
Arrow 8. |
Repairable cards go to a specialized repair shop. |
Arrow 9. |
Serviced cards are sent for retesting. |
Arrow 10. |
Repaired cards (having passed testing) are returned to Supply for reuse. |
Arrow 11. |
Cards are sent from Supply to the VAST shop as noted in Arrow 5. |
Arrow 12. |
Repaired (passed testing) ACs are returned to supply for reuse. |
Arrow 13. |
Either the AC or a removed card may need parts, and they may not be available (although they should be). When this happens the items are put on awaiting parts status, and held in a separate area. When parts arrive, production control releases the original items back into the repair cycle. |
Arrow 14. |
A Ready for Issue AC is given to the aircraft technician, as noted with Arrow 1. |
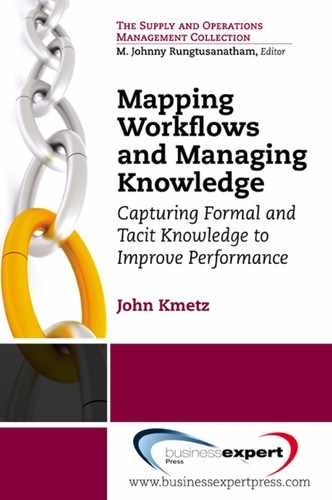
What may not be immediately evident in this is that we have a very simple set of one-for-one exchanges nested in this workflow, which looks like Figure A1.2 if there are no instances where a need for a part cannot be satisfied. Some nonrepairable items fall out along the way, but these are very few. By design, this closed-loop system permits carriers to operate with minimal shore support while on deployment, so there is a continual program in place to reduce parts removal from the repair cycle and maximize at-sea repair capability.
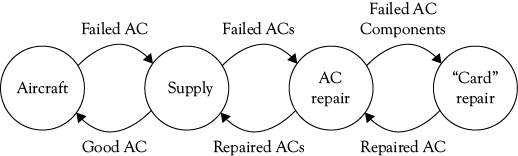
Figure A1.2. A simplified diagram of the avionics repair cycle.
Source: Adapted by permission of the publishers, in The Information Processing Theory of Organization by John L. Kmetz (Farnham: Gower, 1998), p. 101. Copyright © 1998.
Of course, a perfectly uninterrupted supply of parts is not going to happen in the real world, and so the simplicity of Figure A1.2 is never found in the operating Navy. “Lack of spares” is one problem that confounds this model, and so it is simple and logical to conclude that if the model is not working in reality, the solution is to increase the number of spare parts in the system. At one point this logic was followed and NAVAIR bought $46 million of spares (in the early 1980s); the result was to saturate the repair cycle with a larger number of items awaiting maintenance and awaiting parts (!), but no permanent improvement in the effectiveness of the repair cycle or operational readiness for the Fleet air wing.
In part, this failed experiment in increased sparing levels illustrated the importance of political factors in WFMA. Organizational politics is inevitable (Chapter 5) because information is inherently imperfect (Chapter 1), and this applies to the Navy as much as any other organization. In the military, politics are often manifested in the logistics support functions because “an army marches on its stomach.” For those familiar with the military, it is a given that there are 99 support personnel in place for every frontline soldier or pilot, and those support personnel are responsible for flows of a huge amount of specialized material. Empires are built on these flows, and these empires become the basis of enormous political and budgetary battles. The number and type of empires is suggested by Figure A1.3, which suggests the size of the support structure in aircraft maintenance. This figure shows the support structure for the now-retired F-14 “Tomcat,” of “Top Gun” fame, but it applies to all aircraft and weapon systems (and in the case of the F-14, its retirement was partly because it required an average of 110 hours of collective maintenance for every hour it spent in the air).
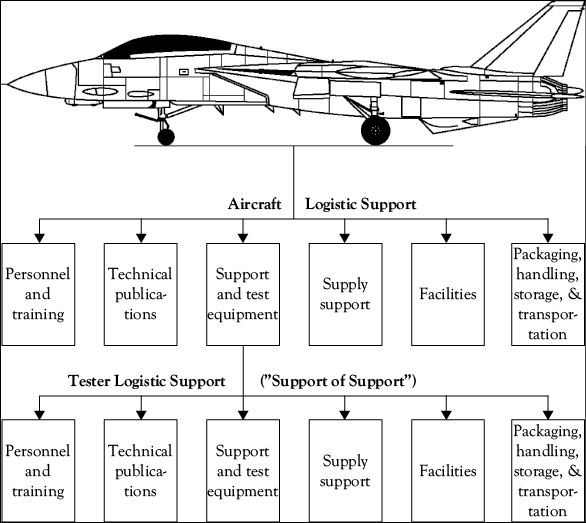
Figure A1.3. The logistics “tail” of aircraft maintenance.
Source: Adapted by permission of the publishers, in The Information Processing Theory of Organization by John L. Kmetz (Farnham: Gower, 1998), p. 94. Copyright © 1998.
All six of the aircraft logistic support elements immediately under the “deck” are individual empires, and there is a secondary universe of these in the support and test equipment arena. I intend nothing pejorative or demeaning when I use the word “empire,” because an “emperor” is needed to organize, operate, and not occasionally defend, these logistic elements. All of them are absolute necessities to keep an effective fighting force deployed, and I have enormous respect for the managers and officers I have met in these functions. But they have to deal with imperfect information, just like the rest of us, and so politics is inevitable.
An unintended consequence of this kind of organization and the imperfection of information is that “defense of the empire” may lead to real or perceived information misuse. This had occurred in the Navy—the CNO was very aware of the problems with operational readiness afflicting the carrier Navy, and wanted to know how to fix them. The information he received, from different logistics managers inside NAVAIR, from contractors without, from experienced air wing commanders and many others, led to nowhere but confusion. NAVAIR is part of the broad Navy matrix organization, as was the Bureau of Naval Material, the organization controlling all supply functions as well as test equipment. The CNO finally became so frustrated with his inability to get clear answers and effective solutions to his problems that he created a separate organization that reported directly to him, and kept information flows about this problem out of the regular chain of command. This organization was the Aircraft Intermediate Maintenance Support Office, or AIMSO. AIMSO was charged with full investigation of the avionics repair cycle, and as an independent consultant and researcher engaged in the same activity, I was assigned to coordinate my work with them.
This turned out to be a marriage made in heaven. The principal investigator for AIMSO was a graduate of the USC program I had taught in, and from the first we had an excellent working relationship, from our intellectual orientations to our practical ideas. We were able to really test and evaluate many of our ideas using some simulation methods (Chapter 6) as well as develop other tools for information technology support of the VAST workflow. Most importantly, AIMSO provided us with the forum to get our recommendations to the right sponsor (Chapter 5), and thus into application. Of course, after resolving the problem AIMSO had been intended to investigate, it was merged into the Bureau of Naval Material.
Before that happened, however, the story had a very happy ending— actually, two. One was that what we learned through this study became the basis for an automated decision process that later grew into the overall program used for all Naval maintenance, not just avionics—this was the APMM described at the end of Chapter 6. Second, when President Reagan decided to build five new Nimitz-class nuclear carriers as part of the 600-ship Navy he wanted, one of the implications was that the VAST production line would have to be restarted, at enormous cost. By the time this study was completed, all of the VAST stations ordered by the Navy had been completed, the company that built them had merged into another larger firm, the plant site closed and sold off, and many of the engineers and production people who knew VAST had retired or were scattered around the country.
But by this time the studies had brought us to fully understand what information needed to be acquired and processed to properly manage the material flow in avionics maintenance, and after creating and validating new programs to process that information, the productivity of the VAST shops exploded. Shore sites that had been provisioned with six stations for support and training were now doing the same job (actually, an increased workload) with two stations, and kept a third one for maintenance training. Carriers that had needed four stations were now meeting their requirements with two, and keeping a third for rotating, periodic preventive maintenance, and to be available as a backup. In addition, technical bugs had been investigated and worked out, as with any new system. This combination of active ingredients meant that enough VAST stations were freed from other bases and carriers to outfit the five new carriers, at a savings to the taxpayer of between $200 and $400 million, depending on whose estimates you choose. That is a very happy ending, indeed.
Very early in the slightly more than 15 years I spent in this program of study and analysis, it became clear that the ability to capture what was happening in the enormous detail that makes up the “everyday” things that organizations do, and to convert that into information that could be communicated to those who could make decisions and affect the future course of events, was the single most important WFMA outcome of all. From that realization grew much of what we see in this volume, and I hope it will be as useful and helpful to my readers as it was to me.
A Short Pictorial Gallery
I thought it might be helpful to show at least a line drawing or two, primarily of a VAST station, which very few people have ever seen, and of the primary aircraft this type of carrier supported during the height of the Cold War. These follow on the next four pages.
The first illustration is a line drawing of a VAST station. Test equipment is just not as sexy as the aircraft it supports or the carriers on which it was installed, so it seems there are very few pictures or drawings of VAST anywhere, including on the part of the manufacturer and their engineers and others who built it. The line drawing gives an idea of what electronic units were in the station, and some idea of how it appeared physically. It is a big machine—78 inches tall, 34 inches deep, 30 feet 4 inches long, and weighing nearly 19,000 pounds.
The A/N-USM-247(V) VAST system, 14-rack version, line drawing
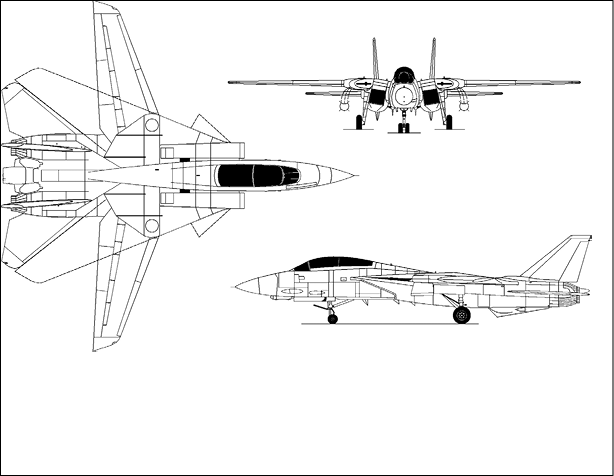
F-14A “Tomcat” air superiority and defense fighter aircraft
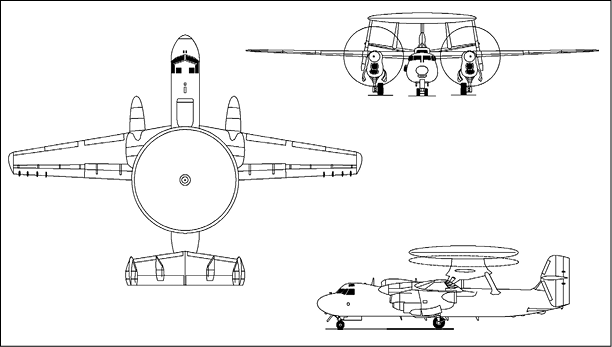
E-2C “Hawkeye” command, control, communication, and intelligence aircraft
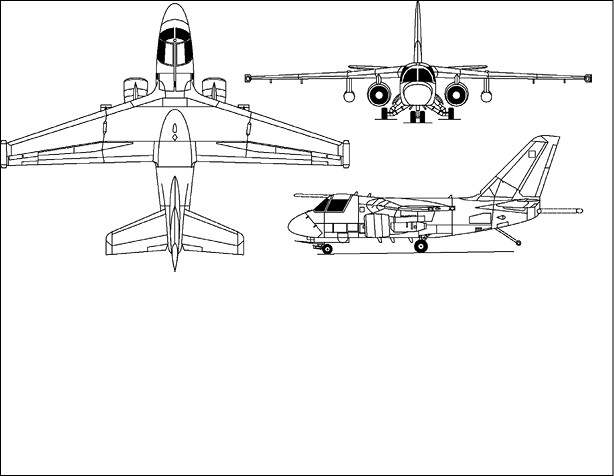
S-3A “Viking” Antisubmarine warfare aircraft
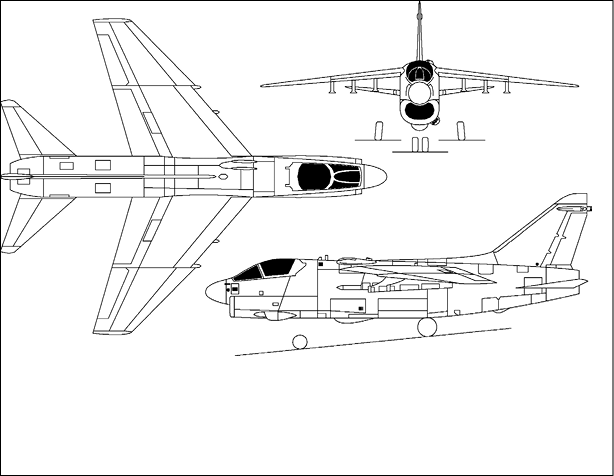
A-7E “Corsair II” strike (surface attack) aircraft
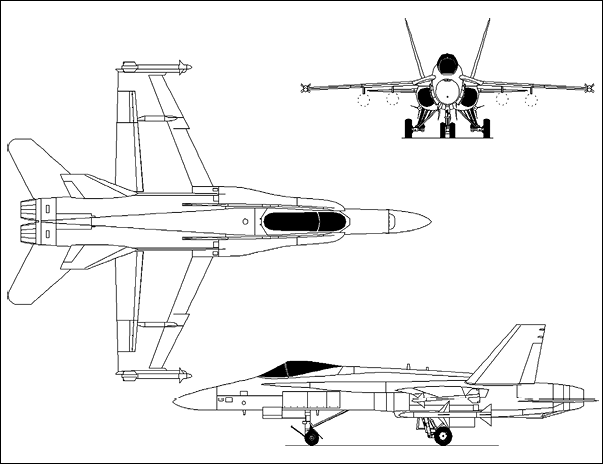
F/A-18 “Hornet” air superiority and strike aircraft