Introduction
Understanding its processes is fundamental for any organization to achieve its goals, no matter what they are. The highest-level process might be thought of as the “business model,” and being able to understand and control that is of paramount importance. Consider the case of Blockbuster Video, the literal textbook success story of the 1990s—customers came to their stores, rented videotapes and DVDs, and brought them back. Netflix realized that with the growing shift to home DVD players and the growth of the Internet, the “store experience” could be done online and transportation provided by the U.S. Mail, all with very low overhead. With no change in the overall service goal but a change in the customer service process, Netflix crushed the Blockbuster success story in the next decade, grew again through early and aggressively priced streaming video, and then stumbled badly by attempting to raise the price for its mail service DVDs by 50% at one time. The business-model wars in the entertainment industry will be a constant source of pressure to capture relevant information about these processes and adapt them as tastes and technologies change.
This chapter provides a singular approach to process mapping for all types of users, including those who want to analyze their business model. But it also serves users ranging from those needing to study and understand complicated problems bound up in a flow of work, to those needing to capture and codify the knowledge used in their processes, and to those needing only to diagram a well-understood procedure for purposes of training new employees or documenting a process for an ISO 9000 or other quality certification. This system creates the maps that are the basis of these and more extensive analyses for process improvement and other applications. In most cases, these applications will have much in common with each other, and most users will find that this chapter applies to them no matter what their objective. Chapter 3 focuses on process mapping, and chapter 4 focuses on analysis of those maps; together they define a system of WFMA.
The Kmetz method of WFMA is quite unlike the majority of approaches to process mapping in two significant ways. First, it does not require the installation or application of any specific supporting software. The core objective of the method is understanding and mapping of workflows as they exist in companies and organizations, and this is key for any further analysis or process change. Drawing software is certainly helpful to record a map, but even that is not an absolute requirement. Second, tacit knowledge is not an impediment to applying the method, and is actually captured by the method and incorporated into our workflow maps. The Kmetz method reveals and subsumes tacit knowledge rather than considering it an aberration in a workflow or an obstacle to process mapping.
Most WFMA projects encompass some elements of routine recording and some elements of diagnosis and discovery. WFMA meets these objectives by showing how the “stuff” of any organization’s work, whether tangibles like manufactured materials, or intangibles like information or changes in patients’ states of health, moves through that organization. In today’s economy, the “material” that most organizations work on is information itself, and for most of the time I will also refer to this as material, even though it is not. Any of the things that organizations do to accomplish their objectives involves both the processing of their materials and the processing of information, in the form of formal and tacit knowledge.
While WFMA is an increasingly important tool in Six Sigma programs and other aspects of quality management and performance improvement, there is no standard format for creating workflow maps1; not uncommonly, these are referred to as “flowcharts” or “flow diagrams,” “process maps,” “business process maps,” and so on.
I use the term “workflow mapping” to differentiate what is being done here from these other methods, and to reinforce the idea that what we are creating with this method really is a “map,” more often through uncharted territory than we might imagine. In discussing the unknown aspects of processes, always with the unintended outcomes of processes and the like in chapter 2 in mind, we should expect to find these and other aspects of processes whenever we begin a mapping project. I always encourage anyone beginning such a project to adopt a mindset of “assume nothing.”
Hasn’t This All Been Done Before?
Before we go on, we should answer a good question—hasn’t this type of book already been done, or isn’t this material all out there on the Web? I should point out that to those who have done some Web surfing to examine materials on flow mapping, business process mapping (BPM), business process reengineering (BPR), KM, and related topics, it may seem rather strange to propose that we should start with another clean slate.
There is no question that a lot has been done to bring workflow mapping to the level of management awareness it deserves, and that much effort has been expended to create a body of tools and techniques to enable managers and analysts to do it. In particular, organizations like the workflow mapping consortium (WfMC) (www.wfmc.org) have been a great benefit to the field.2 Founded in 1993, the WfMC is a global nonprofit organization dedicated to promoting awareness and uniform standards for WFMA, and publishes an annual handbook. It comprises over 300 member organizations and has developed a standard method for graphing and modeling workflows (XPDL), which enables companies and organizations to use information technology in standardized ways and with maximum interoperability between systems and locations. Many members and nonmembers of WfMC have made major contributions to this field.
In March 2010, IBM Corporation and Lombardi LLC held a webinar to discuss “lessons learned from the first decade of BPM.”3 This was promoted by another web-based organization, the Business Process Management Institute (BPMInstitute) (www.BPMInstitute.org), also an excellent resource for process mapping information.4 However, one might ask what WfMC believed itself to be doing if it had been founded eight years earlier than the beginning of that “first decade.” While I like much of what IBM, Oracle, WfMC, and BPMInstitute have to offer, and am especially glad for the support they provide to an important function like process mapping, these organizations also illustrate the diversity, and sometimes the confusion, that surrounds it.
So why do we need anything more? The short answer to this question is that while there is a great deal of material on the Web or published elsewhere, much of it excellent, it is unfortunately true that confusion and complexity are big problems with this body of work. I will expand on my reasons for this a bit more in Appendix 2, where I list some WFMA software (and explain why I don’t list some others), and chapter 5, where I discuss the broader issue of KM.
Much of what I find on the web suffers from several problems. The biggest problem is that to use the tools and methods found there, the user is going to have to invest considerable time and energy into learning a fairly complex software-driven mapping tool before they can begin mapping their own processes. These mapping efforts become major projects, with all that such an undertaking entails, to plan a major program, detail what must be done at each step, gain support for doing it, and the like.
In making that investment, those users will have to learn a number of conventions and rules (sometimes a large number), and then map their processes using a predefined structure that is usually associated with a specific software package. Increasingly, the programs associated with these “BPM” approaches are proprietary top-down applications where “process” effectively means “automated process,” despite occasional nods in the direction of nonautomated methods.5 Along with the growth in sophistication that has accompanied these methods over the past few years, there is therefore an accompanying dependence on the use of information technology; I am a big fan of information technology (IT), but there are cases where the software and hardware can get in the way of things we need to do quickly and simply. These approaches are also often costly. Of course, companies can always hire consultants to do this for them.
A second associated problem is that many of these methods are overprescribed in at least one of two ways. In a word, these all are, or become, specialist approaches—they ultimately require the level of mastery only a specialist can provide through careful study if they are to be applied correctly. In many cases they require the user to apply a relatively rigid set of methods to workflow mapping, often involving special software and predefined approaches to mapping and storing data. This requires learning the vocabulary of that approach, its software application, and basically how to fit everything we need to learn about a process into that framework. At its worst, it essentially requires users to redesign processes to accommodate the software and its assumptions, that is, the tail wags the dog.
Specialist methods inherently limit accessibility to process mapping and the interpretation of data for many who might benefit from the information these tools would provide. An individual in a large company in need of help with an inefficient process may find that a specialist approach to deal with the problem must go through a review and approval procedure that may delay needed fixes for far too long; similarly, the small firm with a limited budget may not be able to afford the fix, even if it could be done quickly. Complexity in process-mapping approaches does not serve these potential clients well.
The other type of overprescription is often that the providers of mapping software and techniques have attempted to catalog processes and constrain the user to applying predefined selections from that catalog, regardless of fit. The logic behind this creation of catalogs is ironically derived from the basic idea of workflow mapping—capture the information and steps involved in a process by drawing a picture of it. Having done that, it is easy to extend the logic a bit and conclude that there must be a finite number of small but similar process components, and so creating an exhaustive catalog of them would permit anyone to “assemble” maps of complex processes from the contents of the catalog, expedited with a bit of software support.
This idea is so appealing that in the early 1990s the Massachusetts Institute of Technology (MIT) undertook exactly such a project to create and commercialize a master repository of over 5,000 business processes.6 With this repository and its accompanying software, it was thought, any and every organization could map its processes directly by examining the company, matching or building its processes from the repository, and then assembling them into a master map. The project was commercialized and turned over to the Phios Corporation in 1996.7
The project appears to have foundered. On visiting the company website, one finds a few entries from the late 1990s, 2003, and 2006, but little evidence of continuous or more recent activity. The list of clients is relatively short. MIT has little to say about it, but in 2006, Phios announced that it had turned its process catalog over to MIT in an open-source format. Neither of the links to the MIT open-source materials work as of this printing.
What happened? My guess, in two words, is “the inevitable.” For reasons discussed in chapter 2, where we glimpsed the potential extent of process variety, workflow processes simply cannot be predefined in the way the MIT project assumed. In addition, the diversity of companies and organizations, the speed and extent of change and evolution in them over time, along with the difficulties in collecting valid information on much of what they do in their processes, conspire to make assembly of a comprehensive catalog nearly impossible. In short, the MIT project was doomed from the outset. It made the fatal assumption that processes are fixed entities, which, once specified, will be found in the same configuration no matter who does them; that is, they all fit into a KK cell in Figure 1.1. I think this is most unlikely, and moreover, even if it were true, the variety of organizations out there will find many ways to create processes in their systems that were not foreseen when the repository was formed. People will combine formal and tacit knowledge to create unique and individualized processes that were simply never envisioned in the original organization. Both the MIT catalog and software were certain to have major problems in adapting to these variations, and I would guess they could not. Tacit knowledge is always the major obstacle for such programmed workflow mapping; further, exception handling is always a major challenge, and as we will see is often the most difficult part of a process to map and understand. Exceptions, by definition, cannot be predicted, and their resolution cannot be predetermined. In contrast to the MIT project, APQC may have had more success with their process classification framework (PCF), begun in 1992, in part because it is a classification scheme, not an exhaustive inventory.8 But PCF faces challenges from tacit knowledge as well.
In many ways, what seems to have happened to the MIT project is that it ran headlong into the information issues chapter 1 discusses, and in working organizations, those obstacles are not theoretical abstractions. The imperfections of information, the adaptability of systems, and the creativity of people always combine to create truly unique entities to which one-size-fits-all solutions will never apply. In a complex world, we have to come up with our own answers to the challenges of life. Even in a specialized and delimited field such as software development for “knowledge engineering,” characteristics of the “domain” or general environment of a business are so diverse and difficult to capture that creation of a meaningful knowledge base and the collective definition of what its content should be is a major challenge.9
The issues I have with many existing systems have long been recognized by others, as summarized by Alonso and his colleagues in the abstract to their analysis of automated workflow systems:10
Workflow systems hold the promise of facilitating the everyday operation of many enterprises and work environments. As a result, many commercial workflow management systems have been developed. These systems, although useful, do not scale well, have limited fault tolerance, and are inflexible in terms of interoperating with other workflow systems.
I believe these challenges continue to explain why major vendors of BPM systems all seem to agree that many such software projects fail, wholly or in part,11 and that the quest for the successful IT-based system that will solve these problems also continues.12
For all these reasons, the Kmetz workflow mapping method in this book is deliberately the opposite of these overprescribed approaches—after learning the simple symbols and rules in this chapter, anyone can quickly begin to model and map workflow processes. The method is better described as “disciplined” rather than “standardized,” and while it is likely there will be much variation in the way different users might describe the same process, this method allows for multiple “right answers.” My approach is nonspecialist, and can quickly be learned and applied by nearly anyone. Most importantly, rather than being blocked by tacit knowledge in the workflow, the Kmetz method simply captures and describes it. This method can be understood by anyone who is not a trained user in just a few minutes. Finally, for those who are considering the next step into an IT-intensive system of workflow modeling, they will find that my method is quite consistent with the basic approach used by WfMC and provides invaluable preparation for successful implementation of such systems.
Workflow Mapping and Analysis
What is WFMA?
As I pointed out earlier, I differentiate my approach to WFMA from IT-dependent mapping methods. WFMA is a graphic method of completely describing the joint material and information flows necessary to accomplish one or more specific objectives of work, in their correct sequence, in a single job, a process, an organizational unit, or an entire organization. As we will see very shortly, WFMA is designed around simplicity and the application of a discipline, rather than software or more elaborate graphical methods. It certainly may take advantage of drawing software support, but no specific program or package is required.
To begin, a workflow map shows exactly how all materials and information are combined in the correct sequence to accomplish a known end purpose. Unlike a system diagram (Figure 2.2), which shows the overall structure of the system, the workflow map shows the linear sequence of operations on material and information to achieve a system objective. A system diagram and a workflow map for the processes in that system are quite different, and it is often a useful exercise in gaining understanding of a system to diagram both of these. Our present concern, however, is the workflow map.
Workflow maps have a number of important properties. First, they are graphic—they show workflow processes visually, diagramming them as a combined flow of activities and information. Second, the method here is singular, meaning that it uses one specific symbol set for all workflows or processes being mapped, and that these are used with a specific set of rules. Third, these rules constitute a discipline, and this is as much part of the Kmetz method as the symbols. Fourth, they are scalable, in that they can encompass all parts of a process at whatever level of detail is selected by the user. Fifth, they are robust—the mapping method we will see below can be applied to any flow of work in virtually any kind of organization. Sixth, they are verifiable—maps can describe existing processes as they are, and any map can be audited or evaluated against the actual flow of materials and information and the behavior of jobholders to determine its accuracy. Finally, these properties make WFMA an important precursor for workflow measurement and process improvement—all workflow activities, flows, and decisions can be measured in a variety of ways that support change and process improvement.
Workflow mapping creates a “static model” of a process within a business system. When a workflow map is created and verified, the user has a graphic depiction of everything needed to do the work the process includes and identify all information needed to perform the process and handle exceptions to it. If a manufacturing process or an insurance claim process is mapped, people can “walk through” the process as if they were on the plant floor or at the claim site.
There are two major components of the Kmetz method—the symbols used to diagram the workflow maps, and the discipline that governs the methods and conventions used to create the maps. Both are important.
Part 1. The WFMA Symbols
In Figure 3.1, the reader will find the basic symbol set used for all WFMA in my method. The usual reaction to first seeing these is, “Is that all there is”? or “Big deal”! That is entirely by design. One of the hard lessons learned in developing this system in my NAVAIR studies is that the symbols have, in fact, very little to do with WFMA; they are a means to identify and order the universal elements comprising any flow of work, but the real objective is to understand the information content of the map, and that has much more to do with the words and expressions in the symbols, along with the relationships between them, than the symbols themselves. The symbols are important, as we will see, and must be used in a consistent way. But they cannot be, and should not be, the dominant part of the mapping process. This is one key element of the designed simplicity of this method.

Figure 3.1. The WFMA symbol set.
Source: Adapted by permission of the publishers, in The Information Processing Theory of Organization by John L. Kmetz (Farnham: Gower, 1998), p. 378.
The mapping symbols in Figure 3.1 are a very basic set of flowcharting symbols that have been adopted as the entire set for creation of workflow maps. No other symbols are needed, and as we will see, no others are desired. There is nothing unique or original about these, and many different flowcharting programs and systems use them as well. Why these were selected is simply that through multiple trials of mapping workflows, validating these maps with operators on the site, seeking diagrams that could communicate clearly with other analysts, managers, and specialists in the navy and elsewhere, these are the ones that did all the things I needed. These five survived a Darwinian selection process. They work. They have been used in every conceivable circumstance and are so robust that any organizational process can be mapped using them.
The first is the simple rectangle (and this must always be a rectangle— a square is not an acceptable substitute). It can show a huge variety of events and operations, including processes, activities, and location; it can be used to designate delays or holds (the absence of activity over time), such as waiting for paint to dry. It can be used for materials and information. It is often referred to as a process block. It has only one exit path, although multiple paths may enter a process block.
The second is the diamond. This is simply a small square rotated 45°, and represents a decision or a branching point in a flow. It is because this is a rotated small square that the rectangle must never be replaced with a square—these symbols must be kept visually distinctive. The diamond is the only symbol that has two exit paths, which must be mutually exclusive. It is primarily an information symbol, although it can be used to show how physical items are parsed or divided. It may also have multiple entering paths.
Third, there is the circle. This can be used individually as a terminal to designate “start” and “stop” points, but is most commonly used as a connector for clarity—continuations where matched circles enable a large, complex map to be arranged in sections. A connector circle labeled “A” at the end of an arrow designates that another “A” at the head of an arrow leading into the workflow is where the flow continues. These may also be used to indicate where different parts of a path might lead back to a single re-entry point in a flow. (Since many programming purists over the years have harassed me on the use of circles for “start” and “stop” events, I have allowed the small circle to be stretched into an oval, without repercussions for those who do this, but an oval is not really necessary and I always use the circle.)
The fourth symbol is the arrow. This is a single-headed arrow to be used individually between other symbols. Multiple arrows from any source other than a decision diamond are not allowed, nor is a double head, that is, an arrow with opposing heads on each end. Arrows exiting a diamond are always labeled; those exiting a process block usually are not, but may be for clarity.
Finally, there is the document. This is a bit of an anachronism. The truth is that most of what is shown using a document symbol can be represented just as effectively with a rectangle, but I have found that there are often circumstances where the need to show that a document was produced, or a rule referred to in a process, or a report generated, and the like, were very important. For that reason, it survives. Entry and exit flows are the same as for a process block.
All of these symbols are associated with brief descriptive information. Process blocks (rectangles) usually contain names and statements. Diamonds usually contain conditions in the form of questions or tests, and these should be unambiguous. Circles tell us what connects to what, or where we start and stop workflows. Arrows are often used without descriptions, but exit paths from diamonds should always be labeled. Finally, documents should have a description of either what was done (like a process block), or what the document is, and sometimes both.
The selection of these symbols was rather Darwinian, as I said earlier. What I mean by this is that they are the “survivors” of a number of different candidates that I tried over time. There are several related reasons for their survival, and for my insistence that they be used only as shown here. First, they are all visually distinctive—if drawn as shown, there is no possibility for any of them to be confused with any other symbol. Second, they can be learned very quickly, without requiring a user to first memorize a large number of symbols or the mastery of any particular software. Third, they are robust, such that they can be used to map any flow of work, whether regular flows or exceptions. Finally, they are comprehensive—they are able to capture all activities and information in a workflow or process, whether material, formal knowledge, or tacit knowledge. Together, they establish a “graphic vocabulary” both for mapping workflows in organizations and for effectively and efficiently communicating what is found.
Part 2. WFMA Discipline—the Rules for Symbol Use
In chapter 2 we saw that processes are a combination of actions and information. However simple the symbols are, do not be deceived by that simplicity! After many years of experience with workflow mapping, there are three issues that always confront new users of WFMA: (1) Mapping the material actions in a workflow is by far the easiest task, since these are the things that actually move through the process. This can create a challenge for new mappers, because they tend to focus too exclusively on the materials, and have difficulty with the information. (2) Seeing and capturing information in a workflow map is one of the most challenging parts of the job. We run into both explicit and tacit knowledge everywhere, and capturing that is always a far bigger challenge than capturing the primary flow of materials. The tacit information is tricky because it is characterized by “four I’s”—it is individualized, internalized, frequently invisible, and idiosyncratic (often to the company or organization). (3) A significant part of the mapping process is to create a document that is clear and orderly on the page, so that it is as informative as possible to its users. This will inevitably take more than one draft to get into the final form we want. Like any other skill, practice at workflow mapping is necessary, and makes it easier every time we do it.
While we diagram material and information flows separately in a system model like Figure 2.4, in a workflow map materials and information are usually tightly bound together. We use information to acquire, transform, and deliver the materials in the workflow. Decisions are made, tests conducted, protocols followed, documents completed, and much more, all as part of the combined flow of materials and information. The map should show these parts of the process as they occur, usually together and usually in a specific sequence.
There are a number of rules for symbol use, which are discussed in the next section. I refer to these as a discipline—“rules” rather than “suggestions” or some gentler term—because I have found that violating them, even slightly, leads to still more violations, and that these progressively destroy the consistency and simplicity which makes the Kmetz method of WFMA robust and effective.
The rules are the syntax for constructing workflow maps. When applied correctly, they make it possible for the symbol set to quickly retreat into the perceptual background of any WFMA user. The objective of such a simple set is to make it “disappear” in use—if more than two minutes is needed to completely explain the symbols, they are too complex. Literally, if one flips through a five-slide show, with one symbol and the bullet points explaining it as shown in Figure 3.1, an audience with handouts should need no more than 25 seconds to understand each symbol. They will need practice using them, of course, but accurate recognition should be achieved quickly.
Keeping the symbols simple and consistent means the basic WFMA methods here can be learned quickly and efficiently. By keeping both the symbols unchanged and the discipline (syntax) consistent, anyone—jobholder, analyst, consultant, or manager—will be able to create and interpret workflow maps in one morning. These will not be perfect at first, but a little practice will correct that.
The “consistent way” of symbol use discussed in the preceding section is the most critical part of this method, and thus is what I refer to as the discipline that must be used to apply WFMA successfully. This discipline must be learned and ingrained at the outset, and required in all workflow maps created with the symbols. This discipline is necessary to preserve the simplicity of the WFMA system, and thereby preserve its power to describe a vast array of workflows. At the same time, users should recognize that this discipline does not result in a single “correct” map for a given workflow or process; in fact, it makes it more likely that it will result in multiple possible “correct” maps, none of which will necessarily be the same.
How can this be so? It is simply that any workflow map is a joint product of the flow of work being mapped or described, and the knowledge and perceptual processes of the mapper, whether this is a jobholder or a specialist. There is no way to isolate these or their effects on each other, and so every map produced will be a function of what work is done interacting with the eye of the beholder. This also underscores the critical need for a disciplined approach to workflow mapping.
With an understanding of the importance of the discipline, we are ready to examine it in detail. There are seven basic components of the WFMA discipline.
Keep It Simple, Stupid (KISS)
The basic WFMA symbol set is based on a sound psychological principle that favors fewer rather than more symbols.13 Busy people have a hard time keeping large numbers of information “chunks” (including symbols) straight in their minds, and overload is never far away.
Many people suggest that a method that makes workflow mapping easy is to simply write down, in step-by-step fashion, what is done in a process; some even contend that this is more than enough to provide the information a map would yield. I disagree with both of these arguments. Very few processes are so completely linear as to allow a clear, well-organized written description. What do you do, for example, each time you come to a branch or decision? How do you keep track of where you have been when you’re on page 26 and don’t quite remember which set of branches you took to get there? When you have to depart from a main process to deal with exceptions, how do you track through frequently complex exception-handling procedures and remember what was happening when you return to the main flow? Diagramming the workflow is preferable to verbal descriptions for all of these reasons, and more.
Use the Symbols Consistently and Correctly
A major benefit of simple symbols is that they have highly specific meanings. Using them as intended prevents confusion; be especially careful not to violate these rules:
• Use the symbols only for the purposes shown. For example, never show decisions in rectangular process blocks (a fairly common error, actually).
• Use only the symbols needed to map the process clearly and correctly. Even though there are only five symbols, not all of them are required for every process map, as we will see, and if they are not needed, they should not be used.
• Use brief, clear text within the symbols (as much as possible) to communicate what is happening at each step. If additional annotation is needed, this can be added in other locations on the page or through notes—this will be discussed in more detail below.
• Use only single arrows, always with the arrowhead shown to designate direction. Two-way arrows (pairs of arrows facing in opposite directions) or double-headed arrows are never allowed.
• Multiple arrows can converge on an individual symbol (three paths might lead into one process block or diamond), but with the exception of a diamond, only one arrow exits any symbol. There are many cases and situations where multiple paths and subroutines in a workflow can converge on a single process or decision; in no case, however, does a rectangular process block, circle, or document have more than one exit arrow.
• Use only two mutually exclusive exit paths (arrows) from a decision diamond (unless there is truly no other choice, and that is extremely rare). Mutually exclusive paths mean that there can be no confusion over what each path means or why one would be selected rather than the other. This is an extremely important rule, and in some cases may make a workflow map segment larger than using more than two exit paths would suggest. Nevertheless, apply this rule.
Here are two examples: if we apply a first coat of paint to a wall and want to recoat it, we might show this as a decision (“first coat dry?”) with “Yes” and “No” exit paths. However, which one applies to “touch dry”? We might instead use three paths labeled “fully dry,” “touch dry,” and “wet.” To make sure that we do not mistakenly apply the second coat too quickly, we may need to add one or more additional conditions (decision diamonds) to the map to be unambiguous. Alternatively, we might ask in a first diamond whether the paint is “touch dry,” and in a second diamond whether at least eight hours have passed since the last of this coat was applied (surface-dry paint might still wrinkle if recoated too soon). A “yes” to both of these might actually make “fully dry” redundant. Even a simple matter like this may be represented by more than one “correct” map.
In a second (historical) case example, credit card customers were being reviewed at random, and for those with some questions about their credit histories, a possible outcome of the review was to limit their account or suspend it entirely; most, however, were at least renewed and frequently offered a higher line of credit. The student with whom I had this argument took the position that there could be five outcomes from a single review decision. These were (1) raise the limit; (2) renew the account at present limit; (3) renew the account with lower limit; (4) suspend the account for a limited time; and (5) close the account. The student argued that all five exits paths could come from a single “Account review outcome?” diamond, and that there was no need to make this more complicated by the addition of a stepwise series of two-outcome decisions. (I insisted on a progressive series of decision diamonds with yes/no exit paths.)
In both cases, it outwardly sounds logical to use more than two exit paths from a decision, since this summarizes the actual outcome states; however, I disagree with the association of all possible outcomes with a single decision diamond. My contention is that if we do not insist on mutually exclusive paths at all branches in the workflow map, it is inevitable that ambiguous conditions for branching will creep into the map, and what seems absolutely clear to the person(s) creating the map will be completely confusing to other users. My personal experience with this issue bears this out—in another credit card case, one student argued for three decision exit paths, labeled “Yes,” “No,” and “Maybe.” I asked the student to define “Maybe,” and of course this was a nested set of further questions and conditions that had to be detailed in order to understand the full process. This confusion never arises when decisions or branching conditions are mapped in mutually exclusive terms. Moreover, the consistent use of two paths becomes habitual for both mappers and users, so that when a decision diamond is encountered, there will always be two paths to evaluate—no more, no less.
The most important reason for consistent use of two mutually exclusive paths, however, is that these require the creators of the map to fully articulate the logic for the branching that occurs at that point. This is often harder to do than we might think, because much of what gets done within many jobs is a process of evolutionary change and internalized (tacit) knowledge. Having to spell out all that is done, and why, involves more head scratching than is immediately apparent, but the payoff is that a great deal of very important tacit knowledge is uncovered this way.
• Put brief text labels on exit paths from a decision diamond. This enables the user to follow the map clearly, and helps keep the logic of the map visible and accessible to the user. Arrows between other symbols, and those entering decision diamonds, are simply flow paths and usually are not labeled; there are cases, however, where a label adds valuable information, and if so, then label the arrow.
• Avoid complex backward flows. These are acceptable on small areas of a map, but can be confusing on large areas. The problem is typically that in some part of the diagram, flow arrows will have to cross or “jump” each other. Use connector circles instead to break the map into coordinated sections and pieces, which can be followed more easily.
• Be careful of creating endless loops. This can happen for several reasons, but is often because of the incorrect use of double (or double-headed) arrows in a flow, or ambiguous criteria for a decision or branch. In more complex situations an endless loop may be created by a condition that sends one far upstream in a workflow, and you get caught in a loop without realizing it. Validation (see below) will catch this.
• Avoid making a single page too dense, whether with large numbers of symbols and arrows, too much text, small symbols and fonts, or a combination of these. In an earlier lifetime in the printing industry, we were always concerned about the amount of “white space” on a page, meaning that there was enough unprinted area to make the printed parts accessible to the reader and the page visually appealing. While one always has to struggle with the tradeoff between detail and content per page versus overall document size, adequate white space is beneficial to workflow maps, as it is to most documents. Connectors help solve this problem.
• When using connectors, there is usually only one start location in a workflow map, but there may be multiple stopping points. These terminal points should be identified clearly. It is also best to match continuation connectors clearly, so that a point where a loop or another part of a process may rejoin an activity flow from several other locations cannot be confused—all “C” connectors that are exits from part of a flow should connect to only the single correct “C” reentry point, and so on for all connectors.
A “Correct” Process Map Captures an Unbroken Sequence of Processes and Branches From Beginning to End
In short, from the start of any process map, it must be possible to follow the sequence of activities to any end point(s) with no gaps in the sequence and with no stopping point(s) other than completion of the work cycle. In most cases, we want to map the full “work cycle” in the system, showing the input (or how we get it), the transformation process (probably in some detail), and identify the output (or the stopping point).
The stopping point in the workflow being mapped may not always be the end of the full cycle. For example, it is common in many maps to trace the workflow to the customer, and sometimes into the customer’s application of the output. However, if the map you create is only for one department of several on that workflow, the “end point” you select is the point at which the department completes its part of the process; the remainder of the process is completed elsewhere. The same could be true for the “starting point”—it may be where the work in this department begins.
When the symbol set is properly used, there will be no places where the map stops if there are still parts of the process remaining to be completed; there will be no gaps; and all branches from diamonds will flow to a completion point or will merge back into the flow. It bears repeating that no two analysts will be likely to do the “correct” map the same way.
Start By Creating Actual Maps of the Workflow, Not the Maps That “Should Be”!
A sure way to waste lots of time with WFMA (or any process mapping effort) is to let people diagram the way (they think) work should be done when the mapper needs to know how it is actually done now. Most WFMA projects start with the intention of description and diagnosis, and often are intended to support process improvement. Validation, the next step, will help ensure that the map really reflects what is being done now, and that is the point of departure for any application of the map. Mapping “what should be done” is almost always an exercise in fiction writing, to some extent. Fiction writing is not the right idea for WFMA, no matter how good the final story.
This should not be interpreted as meaning that a normative, “should be” map can never be drawn—a normative map might serve as a valuable straw man for discussion of how one or more jobs might be redesigned, for example. The problem is that when this approach is used for many existing jobs and workflows, the version of reality that is reflected in the map will be an idealized view of it, and often a view held by one or two passionate individuals alone. In mapping the workflows on seven aircraft carriers and seven shore sites in my NAVAIR studies, I found no two alike; nevertheless, I had three experienced chief petty officers provide me with “ideal” workflow and organizational maps for different sites. None of those matched, either.
Validate the Map
When a map has been done, trace it through to the final details and verify the map against the workflow. If the map doesn’t completely match the process, it is not a valid map, and you don’t know what is actually being done. Revise the map and try again. Seldom does the first draft of a map not need revision.
This is a task that often falls on the manager or originator of the mapping process, and sometimes requires the support of higher management (such as the process owner, to be discussed in chapter 5). In simple terms, the validator often has to be a pest and “walk through” the map with the person(s) who created it. At every step, that “pest” needs to be prepared to ask questions, clarify terms, correct some of the mapping discipline, add or subtract steps, and the like. Typically, a revised map will be needed, and this may happen several times until the map is fully validated. This is a high value-added part of the discipline, and if it is not done there are many things that can go wrong with workflow mapping, producing maps that are ambiguous, incorrect, and misleading.
Getting a fully validated map means that there will be “little things” in the first draft that are omitted or do not match the actual flow, that is, exceptions, and many of these are not “little things.” It is not at all uncommon for the major part of the work done in a process to be the smaller part of a map, while exceptions and deviations from the norm eat up lots of time and energy to diagram, often mimicking the reality of actually doing them. Getting this information will take persistence, but this is where process variation lives, and it is often where the richest opportunities for process improvement are found as well.
Mapping and validating actual workflows are parts of the mapping process where information flows become paramount. This is true for several reasons. First, most people are familiar with the routine process that works correctly, so it is easy to map it and describe its details. This also seems to be the most important part of the process to map, since it is where most companies add value that customers are willing to buy; it indeed seems logical to pay the most attention to this part of the process.
However, these routine material flows are not the part of the process that necessarily requires the most attention from workflow staff; that distinction is usually associated with the exceptions we referred to above, and these are often complicated with respect to both the sources and causes of them, as well as from the work needed to correct them and get the process or product back on track.
In validating a workflow map, the majority of what will be added to the map will be examples of information processing activity undertaken solely to deal with exceptions, and much of this may be for specific types of exceptions. These exception-handling maps may well be larger than that for the entire routine workflow. Generating them often seems to be more time consuming than justifiable when it is first done, given that exceptions are not where value is perceived to be added—people often resist doing this part of the process, for that reason. The tacit nature of much of this information also makes it difficult to describe and to map.
My experience has been that creating both a complete workflow map—one that attends to all the details as they now exist—and validating that it is in fact the actual process that is followed both when things go right and when they do not, is the most challenging part of my method. This is true largely because the analyst must dig out all of the detail that has to be acquired, processed, understood, and put into the map in such a way that both the nature of the exception and the process to handle it are clear and fully communicated. For experienced personnel in many organizations, this is an area where deep internalization of information occurs over the course of handling many exceptions, and this is vital tacit knowledge in the workflow. This tacit knowledge can be discovered and mapped, but it is typically much easier to carry out such a complex process than it is to fully describe the activity, the information required, and the outcome it should generate.
What Happens Before, and What Happens Next?
If a map cannot account for where something came from before it got to a particular location in a process, or where it goes next, is it really connected to the rest of the organization; is it really connected to critical suppliers; is it really connected to customers? Again, organizations are systems. Valid workflow maps must show what the system is actually doing, and without a valid map meaningful process improvement or other change is most difficult.
This question may be related to map validation in that the “before” and “next” may refer to exception-handling processes. In many cases, companies may find it helpful to start with mapping the normal, routine, successful workflow and get that correct (this is good practice for mappers, too), before going into mapping the handling of exceptions.
Make WFMA Your Own, But Limit “Customization”
Some circumstances necessitate minor changes to the basic approach here to account for things unique to a process or organization. There is usually need for an organizational standard format. Do these things, but only as much as really necessary. Using “swimlanes” or color to designate where parts of the process are done are fine, for example. Do not add more symbols (or “modifications”) to the symbol set.
This rule is especially likely to be violated by those with flowcharting, data flow diagramming, or similar kinds of experience. The temptation to add a shadow to a rectangle after doing it for years is hard to resist; so is using a round-shouldered as opposed to a right-angled rectangle, or using double vertical walls. But doing this now requires the user to learn, and to carefully observe, these subtle differences while also attending to the logic of the flow and the information contained in the symbols; this introduces noise and inevitable confusion to the system, and these are never good things. They will also confuse users of the map.
Like the symbol set, these seven rules are also simple. Following them consistently is often neither simple nor easy. The discipline needed to make WFMA effective is to apply these rules strictly, and not to allow variations to creep into either the maps or the procedures that produce them. If this is not done, any moderately large firm, or firm with geographically separated offices, will inevitably begin to develop divergent and incompatible WFMA techniques, and the power of WFMA will be lost.
As WFMA is applied more widely in an organization, it is strongly recommended that a “process owner” be designated (if that has not already been done), and a configuration-control system be put in place. The latter is also very simple—it consists of review and final approval of all WFMA maps, and saying ”no” to those that do not conform to the discipline.
Basic Mapping Conventions
Figures 3.2–3.5 illustrate the major conventions for constructing workflow maps. Figure 3.2 illustrates a very simple workflow map, with symbols of four processes in sequence. Such a simple map requires only four process blocks, a “start” and “stop” point in circles, and the arrows to indicate the flow.
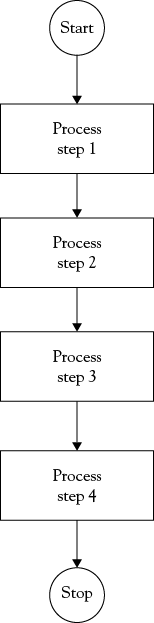
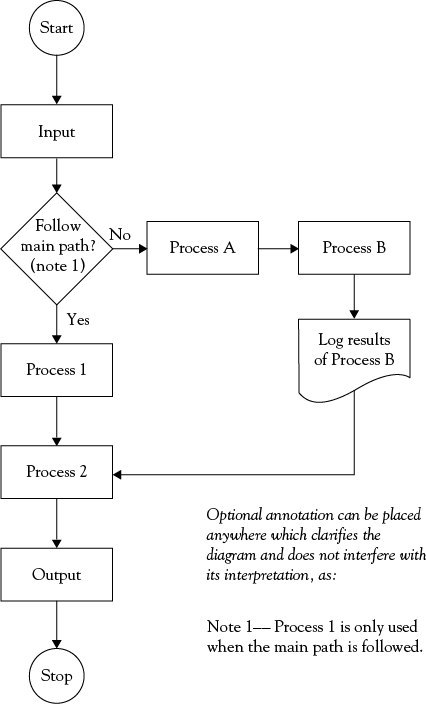
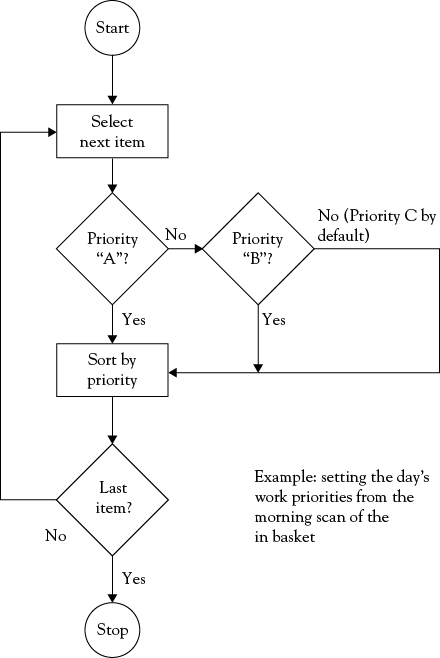
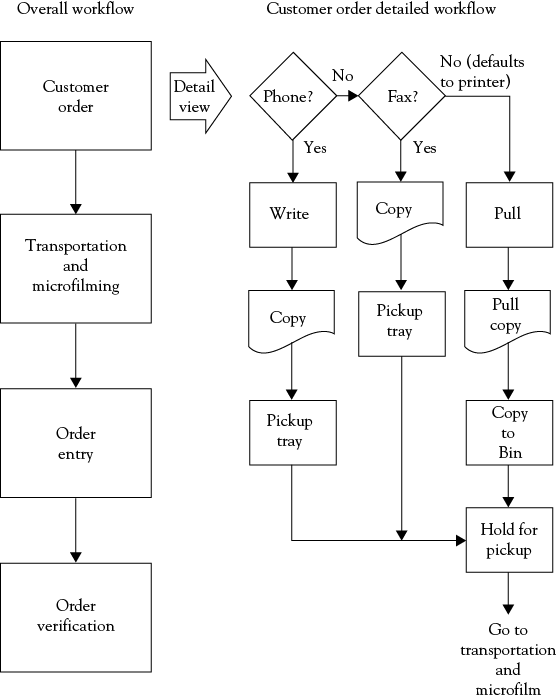
Figure 3.3 illustrates a workflow map where a branch occurs by selection of the process path (main or alternate) to follow. If the main path is followed Processes 1 and 2 are used, but for the alternate path Processes A, B, and 2 are used, and Process 1 is skipped. The results of Process B are also documented. This map uses all five symbols in the set. Annotations of various parts of the process can be added if they add clarity, as shown, and this will be discussed in more detail in the next section of this chapter.
Figure 3.4 illustrates a repetitive loop in a workflow map. While I generally discourage backward flow loops in maps, this is a case where it clearly makes more sense to keep the map on one page rather than force some kind of stylistic compromise to avoid such a loop. Proliferation of such backward loops, however, can reduce the clarity of a map, and one excellent application of connector circles is to use them to reduce the extent to which backward (and especially crossing) flows are needed.
Figure 3.5 illustrates how processes can be viewed at differing levels of detail. On the left side of the figure the four high-level steps necessary for completion of a transaction in this financial institution are shown. The right side shows the first of these four steps, the taking of the customer order, in more detail. Here we can see the three different ways that orders can be received (telephone, fax, or via dedicated computer link), and the additional activities needed to prepare them for the next major part of the process.
Using Annotation in WFMA Maps
The general rule for the use of text in WFMA is that we want to keep as much of the necessary text and information about a process flow inside the symbols as possible, or closely associated with the symbols. This is part of the WFMA discipline and a payoff of it—when the user follows the map, there will be an automatic association between the symbols and the information in them. Together, these fully define the workflow we are mapping.
Occasions arise where annotation apart from the symbols is necessary, and there is a wide variety of such circumstances. In making a workflow map for training new personnel, we might note to the trainee that things done in one step may be referred to another office under some conditions; that there may be supplier or other external relationships that could affect a part of the flow; that random samples of work may be taken for quality assurance; and the like.
Whatever the situation requiring annotation, there are several rules of thumb that should be followed to the greatest extent possible:
1. Try to keep annotation within the area of the relevant symbols. This simply associates the annotation with the process steps it refers to, and prevents the user from having to go somewhere else in the map or another document to get the desired information.
2. Do not mix annotation directly with process information in the mapping symbols. Annotation implies supplemental information, and it is best to keep it that way. When annotation is used, it should be apparent that it is annotation.
3. Avoid using straight arrows to associate annotation with symbols, since these are used as part of the maps themselves; connective symbols for annotation should generally be avoided. If there is a need to associate comments and annotation with specific symbols in a map, the famous engineer’s “curving arrow” (see the “system boundary” in Figure 1.4) may be appropriate in some cases, but too many of them clutter the map and make misinterpretation of it more likely rather than less. My preference is to use relatively standard typographic tools such as asterisks, parenthetic note references, footnotes, and endnotes to associate supplemental information with the map and its symbols. Footnotes are often a very effective way to make this association, and are automatically fit onto a page by word processors. This is a convenient association for making printed copies of a map, and is also useful for electronic documents, since relatively large displays with high resolution have become common.
4. Use annotation appropriate to the level of detail in the workflow map. Annotation is sometimes used to address matters at levels of detail much higher or lower than the level of the map, and this can be confusing and distracting. If one is looking at the high-level (left side) view of Figure 3.5, for example, it might be appropriate to note why the sequence is what it was at that time. (This is an historical case where time is money, and these are high-value transactions; thus, nothing was done until the order was logged and officially in the system. Needless to say, this was automated a long time ago.) It would not be appropriate to explain at the high level that pulling a copy from the computer printer meant separating five-part forms with carbon sheets between them (as was the case then); this would be appropriate to the detail view on the right side, or perhaps even a more detailed drill-down map.
Cases like these are where the linking capabilities of many drawing and workflow-mapping software packages can be used to excellent advantage. Figure 3.4 could be separated into two parts (the high level and detail views), and each could be annotated as needed. A user wanting to have easy access to information at different levels would only need to select the desired link to see the alternate view. Some packages refer to these links as “layers,” but that term has multiple meanings.
5. Hyperlinks, the familiar blue-colored underlined connections we use to browse the Internet and link documents, are easily created with nearly every major software package, and can be a very useful form of annotation. As an example, suppose that a particular step in the administration of an experimental drug to a patient requires the consultation of an attending physician; specific attention to several important patient health details as well as other matters; and that a form must be signed by the appropriate physician upon giving a dose. Trying to annotate this much supporting information at a single point in a workflow map might be dysfunctional given the length of the procedures and forms to be completed. However, this requirement could be met with annotation such as, “Only attending physicians are allowed to give this drug and they must document their actions every time.” The hyperlink associated with “document” may connect to a lengthy and complicated research protocol; the workflow map, on the other hand, can immediately and clearly go on its way.
Somewhat more time is needed to learn the rules, but these should also quickly become part of the disciplined approach to WFMA. Learning the rules is best done with hands-on practice, beginning with something relatively simple and then progressing to a more complex process. Nearly anyone should become an “expert” in WFMA workflow mapping in no more than a few sessions. Validating the map and doing the rest of what WFMA entails takes a bit more time, but the basics should be successfully acquired very quickly.
Again, what I learned in my early experiences with WFMA is that the information conveyed by the map, through the brief descriptors used in conjunction with the arrangement of symbols that graphically describes how something gets done, is the only thing that matters. If the mapping graphics and rules get in the way, they obscure what they should reveal, and they distract from the analysis rather than support it. In no case is this good, and in situations where there may be political or other opponents of what is being done with WFMA, these distractions provide ammunition for them to discredit the entire program and its objectives. The power of the Kmetz method is its simplicity and consistency.
Making Bread
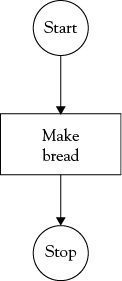
Let me use an example of a common activity to illustrate these basic conventions. The example is making bread, one of the most fundamental forms of food preparation in human society. I have included my own bread recipe at the end of this chapter for those who might want to know more about it, and I can attest that I have never had a failure with this recipe. Many people are intimidated by baking (the expression, “cooking is art, but baking is chemistry” is true in my experience), but this chemistry always works and tastes wonderful. Figure 3.6a illustrates a high-level view of the process, where everything done to combine water, flour, and yeast to make bread is compressed into a single process block. While technically correct, it provides very little information beyond identification of the process itself. In cases where we either do not need details about the process or can assume an expert audience who already knows the details, we may need nothing more than this level of information.
Most users of a workflow map will want more detail than this map provides. Figure 3.6b is a “drill-down” of the overall process in Figure 3.6a, revealing a series of four principal processes—mixing the dough from its basic ingredients, allowing the dough to rise from the action of the yeast, forming the dough into sections appropriate to the type of final product being baked (large loaves, small loaves, individual rolls, and so on), and then baking the formed loaves.

The next level of detail is seen in Figure 3.6c, where we now see that the baker has a choice regarding whether the bread dough will go through more than one rising, with the reason for this decision explained in the annotation to the “Yes” exit path from the diamond. We also see more detail in other parts of the process, where mixing ingredients is now seen to be two steps; this is a drill-down of the single process in Figure 3.6b, and the entire figure is a further drill-down of Figure 3.6a.

The highest level of detail shown is in Figure 3.6d, which is a further drill-down of all process steps and conditions shown in Figure 3.6c. Figure 3.6d is a sufficiently detailed map of the process of making bread that it could be followed as a recipe, and is annotated to show where individual process steps correspond to the written recipe shown at the end of the chapter. But even more detail could be added to this map, showing things such as the tacit knowledge of what “mix well” means (if using an electric mixer, the dough should release from the sides of the bowl with no residue sticking to the bowl, and the dough should have a high degree of elasticity; other tests apply if the dough is mixed by hand, but it should always be elastic when it is well mixed and kneaded), or how to assemble a pizza if that is how the dough is being used. Other forms of tacit knowledge affect how we form loaves—some bakers prefer the “country” style breads made by simply dividing the dough and forming loaves from the sections rather than rolling it with a rolling pin, as I do.
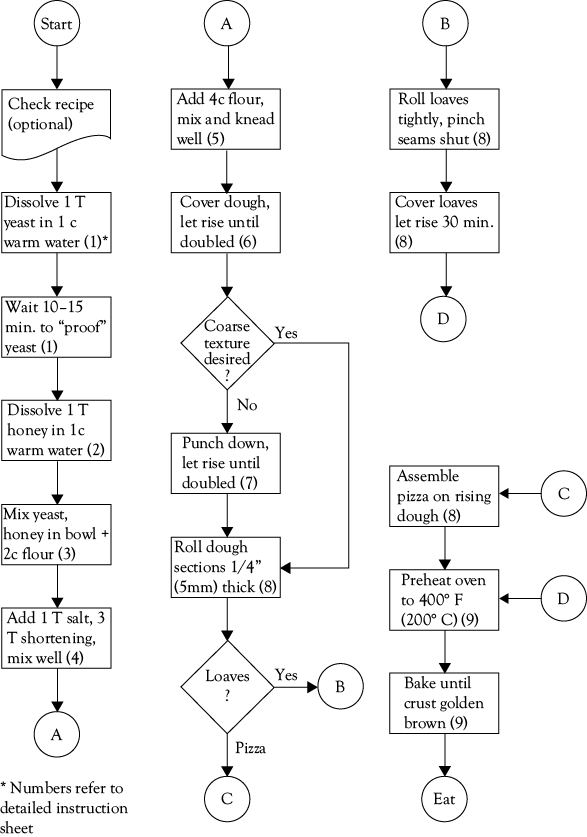
Since “baking is chemistry,” there will be less variation in a process map for making bread than there would be for making soup. The action of yeast creates carbon dioxide that makes the dough rise and expand, and this requires time and temperature control; it also dictates upper and lower limits on how long a baker can wait to perform steps in the process. But even in this case tacit knowledge is extremely important and has a great impact on the recipe. I spent many years trying bread recipes and experimenting with variations until I felt confident I understood the chemistry and could change the type and proportion of ingredients to my liking. In many ways, it is accurate to regard the entire recipe as tacit knowledge, even though the chemistry of baking imposes boundaries on what we use to make bread. We should note that there is only one document symbol in these maps, but one could be added to any of the last three figures for a baker to make notes on their own recipe or modifications to mine, as I did. My own recipe documents a type of filled Italian bread called “pinulata,” where the dough is rolled like a pizza, then covered evenly with the filling, and rolled up (pinch the seams to seal them) to form a loaf. This is not shown in Figure 3.6d, and would be part of a more elaborate subsequent map.
In closing this culinary example, we should note that what has been illustrated by it applies to nearly every process we can imagine. We can start at a very high level and progressively drill down into greater levels of detail. As we do so we will likely use more of the symbols, but note that only at the fourth level of detail were all of the symbols used. It is equally worth noting that all of the details we want to show can be mapped using the basic symbol set and the discipline—this is a highly robust mapping technique.
Mapping Parallel Processes
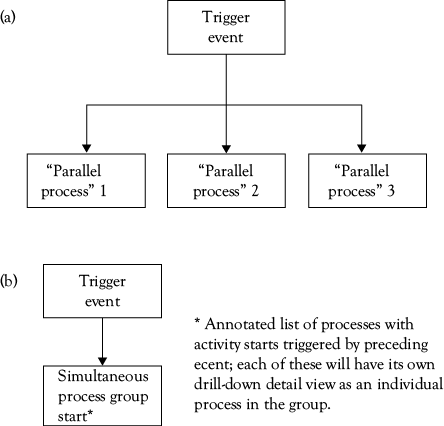
A question that often arises is how to map “parallel” processes, where a number of discrete processes are carried out and all seem to have begun from a single trigger event. The mapping issue this raises is that it would appear to violate the rule that a process block never has more than one exit path, requiring a single process block to immediately trigger a number of other process blocks. This incorrect practice (which is not that unusual to actually see in many maps) is shown in Figure 3.7a, along with the correct mapping method in Figure 3.7b. I have encountered this apparent dilemma in a number of situations, and it is only an “apparent” dilemma. Let me explain.
First, these apparent parallel processes occur in two forms, external and internal to the organization. Externally, there are processes that are simultaneous and not controlled by the organization, as in the case of a home-security company. The security firm monitors clients’ home systems for evidence of (1) break-ins, (2) fire, (3) flood, (4) medical emergencies, (5) earthquake, and (6) loss of electrical power, and has a predefined response for each of these. In addition to the home systems, other sources of information are scanned, including (7) firm personnel in satellite locations whose observations may initiate responses, and (8) local emergency responders such as fire companies, which are monitored for information that may affect customers. Finally, (9) news media reports of emergencies that could affect customer residences are also monitored for potential response.
Any of these nine information sources could provide a cue that would trigger a response by the security service. This cue is received through rapid sequential surveillance of these sources (like an emergency radio scanner), and the cue triggers one or more predefined response processes. This is in fact rapid execution of a serial process, and is not truly parallel at all. If the process is automated, the program flowchart would reflect this sequence of steps; if not, and human intervention is required, execution is still a sequence, albeit probably slower. For example, for a worker to be able to stop an assembly line in an automobile plant when a quality problem is detected requires a great deal of prior work, involving the creation of company policies that allow such a step, installation and testing of the “kill switch” that would stop the line, training the worker to detect the problem and understand the correct response, and installing corrective processes to solve the problem and resume production. There is a long series of steps required to establish what outwardly appears to be a process that is “parallel” to the normal production process.
Internally, a trigger event sometimes sets a number of processes in motion, almost at once, and can again seem to be a parallel process. A type of production I am personally quite familiar with is the writing of a proposal for a major weapon system, when the official release of a request for proposal (RFP) from the Department of Defense triggers rapid mobilization of a team to write the proposal. Teams will be engaged to write a document covering basic system engineering, manufacturing engineering, logistics support, maintenance, personnel training, technical documentation, and a myriad of other requirements. All of these seem to start at once on release of the RFP, but in fact, there are many serial processes at work well in advance of that trigger event. Potential contractors devote much energy to gathering intelligence on what the customer might require, what competitors might offer, and above all, to assembling the teams of people to write the various sections of the proposal. It is literally the case that for most of these programs, years of preparation have gone into being ready to launch the actual proposal effort, and the latter is only apparently a set of “parallel” processes. Many companies in many industries live and die by the same kind of bid-and-proposal business, and the seemingly automatic, parallel processes in their responses are actually the culmination of years of serial preparation, and embody a huge amount of tacit knowledge as well.
Rather than referring to these as “parallel” processes, I prefer the term simultaneous processes. I am prepared to argue that “parallel” processes only exist with respect to a point in time, when the typically lengthy and voluminous series of preparatory steps that enables them have been completed. In the case of internal simultaneous processes, most of these have been predefined through design, experimentation, and experience, and often embody tacit knowledge that has often been formalized because experience has showed it worked.
Mapping these is often less of a challenge than may seem to be the case. Consider the emergency services firm—only two process blocks with a decision diamond are required to show how it works. The first process block is “Continuously survey information sources,” connected to a diamond querying, “Response cue received?” If no, that branch loops back to the survey process block; if yes, it connects to the second process block, “Respond with appropriate predefined process.” The first process block would be annotated to indicate the kinds of information sources surveyed (home monitors, scanners, media), and the second annotated with a list of the different processes for each of the six emergencies to which the company responds. A similar technique can be used for the launch of proposal-writing teams. The first process block would identify the kinds of pre-launch preparation needed to be ready for the release of the RFP, which is the query in the diamond. The second block is “Hold for RFP release,” to indicate that preparations were complete and a delay in launching the effort was for reasons beyond company control. The third shows the release of the RFP, and the final block is “Proposal teams prepare proposal sections,” annotated with a list of those teams and sections, as shown in Figure 3.8.
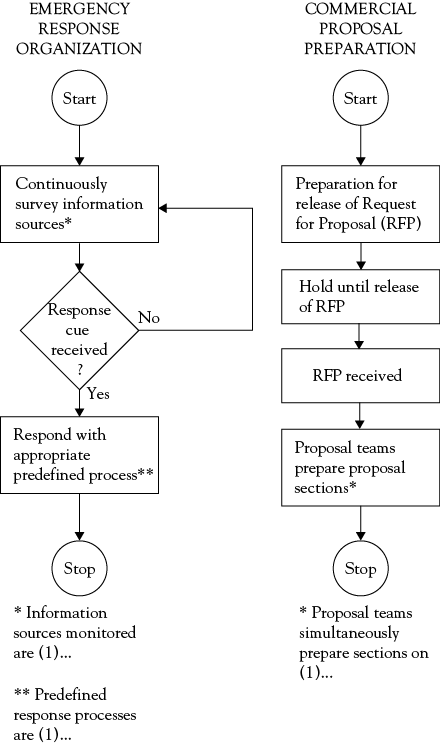
Figure 3.8. Two illustrations of organizational response to external events with simultaneous internal processes.
This is a case where hyperlinking and drill-down support from drawing software can be very helpful. For each of the first process blocks, details on individual predefined information source monitoring for emergency services, and details on specific steps needed to be ready to launch a proposal effort, can be provided; these can go into significant further detail as needed to document complex processes. The second process block drill-downs can detail the predefined emergency responses (an excellent way to assemble training and review information on these processes), and the detail needed for each of the proposal sections, all of which is highly specific to the proposing firm or organization. It is not at all uncommon for many of these kinds of predefined processes to depend on legal, procedural, or other documentation, all of which can also be hyperlinked to the appropriate processes at the appropriate level of detail.
Types of Workflow Maps
What types of workflow maps can we produce with the WFMA symbol set and rules? In one sense, there is only one kind of map, because the disciplined use of the symbol set can be applied completely under the user’s control. Different kinds of maps can be produced, however, depending on the focus of the user. There are basically two questions to consider—do we want to focus on a process or do we have a different objective, and do we want to be comprehensive or map a segment of a larger process?
First, we can obviously map specific types of workflows, without respect to whether the map captures the entire content of any particular job on the flow. This is the most common type of map and implicitly has been the type that has been the focus of our discussion thus far. To treat a patient in an emergency room requires the services of a receptionist (if the patient is self-transported), an orderly, one or more nurses, and an ER physician, at the minimum. Some or all of these people may have things to do that go beyond the emergency patient-care workflow, but our concern here is with the handling of the ER patient. The workflow map for a cardiac emergency will not be the same as for a splinter in the left big toe. Using maps to document processes for quality certification is still another example. A map prepared to “document what you do” for ISO 9000 certification will not be the same as a map prepared to train a new worker to do that process—the latter will be much more detailed. ISO 9000 maps are typically not exhaustive descriptions of the individual jobs involved in them, either.
Second, maps can be constructed with a focus on tasks or jobs, as well as processes. That is, we can create workflow maps of individual tasks within a larger job; or we can map the entire job, which will always have at least one task, but nearly always has more. We might want to map the work done in or through a group, whether the group is a team, part of a unit, or a whole unit, and could also include work done by contractors and others who contribute to the output but are not members of the organization. At the upper extreme of group size, we can even map an entire organization. No matter what the scale, the objective of this type of map is to capture the “technical” (material) content and knowledge in the relevant system, where that system is not a “workflow” as we have been using that term. I have seen this kind of application used by several clients to create graphic job descriptions and supporting training documents, among other things.
We could also map the flow of materials or specific items of information, without initial regard to how these are used. The latter types of flows are often useful for investigatory purposes such as process improvement, security, waste reduction, cost control, and the like; in some cases, we just want to see what happens to a piece of paper or a bit of information for one reason or another.
These categories are not necessarily mutually exclusive. It is entirely possible for a process to be contained within a single job. The main point to be aware of in considering types of workflow maps is that whether they are comprehensive of either jobs or workflows is a matter of what the user wants. Many workflows only require a segment of the individual jobs they pass through, and conversely, many jobs contribute partially to several workflows. WFMA is flexible enough to accommodate all of these, but it is necessary for users to be clear about the content they want in a workflow map.
Flow relationships. In chapter 2, we discussed convergence and synchronicity in flow relationships. These distinctions in the nature and timing of workflow elements do not necessarily require separate types of maps, but these may be disaggregated into distinctive parts. If we are mapping the process of “cash management,” meaning depositing and disbursing cash along with periodic reconciliation of the cash account, this will be several flows of activities with related exception-handling processes, much like any other. These would indicate that one person prepares and deposits cash receipts, and another will be the one to write checks and disburse cash. At certain dates or on certain random intervals, reviewers who are not part of this regular workflow will verify the overall transactions and the resulting balances (that is, an audit). The overall process is continuous and cyclical, even though it is done by a group of individuals with responsibility for discrete activities in the process. Divergence is a matter of where the activities that make up the workflow are done, and timing is a matter of when these activities get done; but all of them are part of one process—cash management. The relationship between the overall process and its detailed parts would be similar to Figure 3.5.
Much of the purpose of WFMA is to describe, and in some cases to discover, exactly this kind of deeper understanding. The understanding begins with a valid map of what is actually being done, and this is sometimes a very challenging map to create, for reasons discussed above. Having this map, however, enables properties like the functional or dysfunctional nature of the workflow to be seen as well as matters of synchronization or convergence of actions and decisions.
Who Prepares the Map?
One last question often posed about WFMA concerns who should prepare the map. The best approach is to have the person who does the job prepare the map. Prior training in the symbol set and its use is strongly advised, but this is not a time-consuming requirement—having trained hundreds of people to create workflow maps, my experience is that 75% of trainees will learn to use the symbols correctly on the first or second try, and nearly everyone else gets it with a third try. This is especially likely if several nonthreatening exercises are done as part of the training, and groups of trainees serve as “consultants” to each other. The “consulting” usually consists of simple tasks like helping people to remember to label exit paths from decisions, not mix diamonds and rectangles (a common problem at first), and putting arrowheads on arrows. Clarifying what is meant by the content of the diagram is also important—it is quite common for statements to be put in a decision diamond when a question is actually needed, for example. I have provided several exercises at the end of the chapter to assist learning symbol application, and it is easy to develop similar exercises that may have specific appeal or relevance to other groups.
While there may be some circumstances where the initial (first draft) workflow map should be prepared by a supervisor or a specialist, my experience is that these are rare, and generally not beneficial. First, it takes a great deal of time and interaction between two people for the second one to understand and correctly describe the other’s work. Second, there are many perceived reasons why the jobholder may not want to be fully forthcoming to someone else—lack of trust in that person, a feeling of being examined or watched closely (perhaps to be caught in mistakes), or a sense of pressure just to get done, from either or both people. Most importantly, the internalized tacit knowledge on the part of the jobholder may be harder to discover and understand if interpreted by another. These factors interact to make validation harder rather than easier, because the onus of correct explanation of a flow of work has been shifted from the person who does it to the person mapping it.
A supervisor or internal consultant, on the other hand, should be involved in validation of the map at some point. Inevitably, that which is crystal clear to me when I describe it in familiar terms is absolute gibberish to someone else; steps that are assumed to be known from birth will be absolute unknowns to someone else; common language and acronyms that “everyone” knows will be misinterpreted; and so on. All of these issues must be resolved before a map is considered valid. While jobholders usually prepare the first draft of a map, having others’ eyes and ears on the map for validation is equally valuable, and almost always results in change and clarification.
There are many situations where the objective of WFMA is to develop a map for a process that is performed by a group. An alternative to building the process map from individual ones may be for the group to do the map collectively. For WFMA projects like this, the common “sticky note” can be an engaging way to get everyone in the group involved. The common rectangular and square notes provide the two workhorse symbols (the process block and decision diamond); the other three can easily be drawn on these two. These can be put on a wall or whiteboard in a public area (the coffee pool) with an invitation to everyone to change or contribute to the diagram as one sees fit. Not only does this create a great deal of interest in the mapping process, it also creates “buy-in” for the final product, a vital concern for change and process improvement.
As with any job, larger organizations may want to have one or two skilled specialists in WFMA diagramming around; these people will likely be able to help prepare and validate maps more quickly and easily than individual jobholders, and can serve as a mapping resource to jobholders. Specialists selected and trained for their interpersonal skills, for example, are often very effective at getting through the validation of a map with less stress than the supervisor or an outsider (and excellent interpersonal skills are recommended). They can take a first “rough cut” jobholder map and work with the jobholder(s) to easily do the editing and revision these typically need. As they learn the nature of work done in a group or unit, they can become very effective at asking good questions about exception handling and parts of the job where tacit knowledge is important. They can play a valuable role, and are well worth the time and practice taken to develop them.
Additional Examples of Workflow Maps
Several additional examples of workflow maps are shown in this section to illustrate several points. First, Figures 3.9 and 3.10 are both relatively complex transactions from financial services companies. Names and details have been changed to protect their identities, but these figures illustrate processes involving typical client services from such institutions. Both of these were prepared using Microsoft Visio software, and show how all symbols are used in a map and how they can show considerable detail and yet be arranged to fit on a single page. In truth, Figure 3.10 is about as crowded as I would allow a page to become, but there is always a benefit from being able to see a process map in one piece, as opposed to having to change pages.
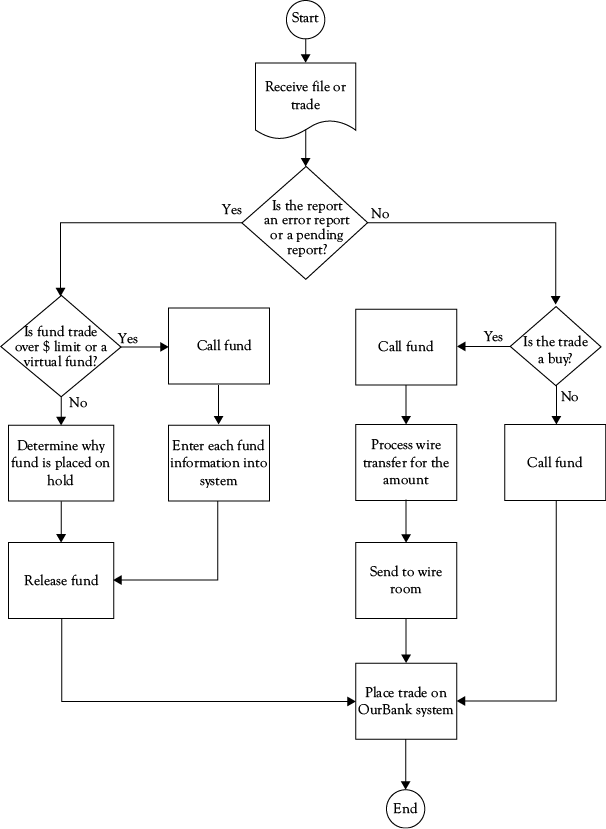
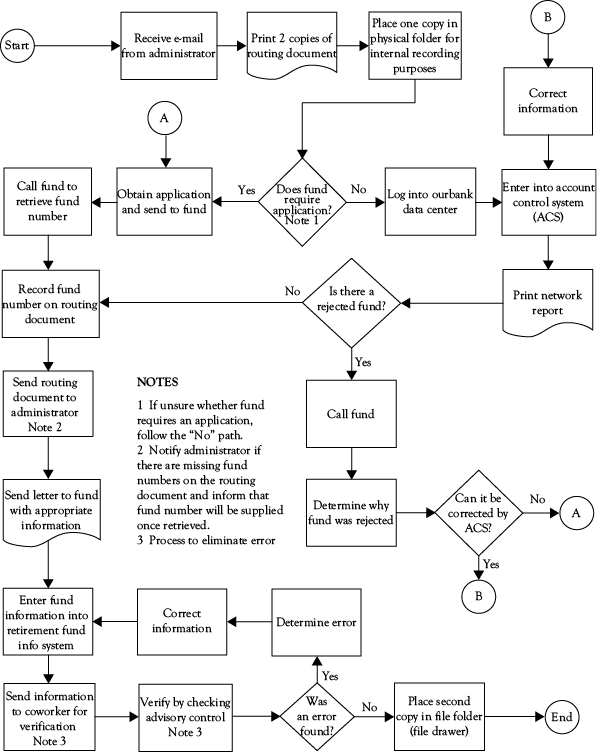
Figures 3.11–3.13 are two-part figures, where the first part shows a workflow map as prepared by a client organization, and the second part shows that map constructed using the Kmetz method. Figure 3.11 is a prepared-foods firm, and this figure illustrates the packaging process for a Laptime TV Dinner, as done by the client and as redone. Figure 3.12 shows a proposed new book selection system at the University of Delaware, again in client form and as redone by the Kmetz method.
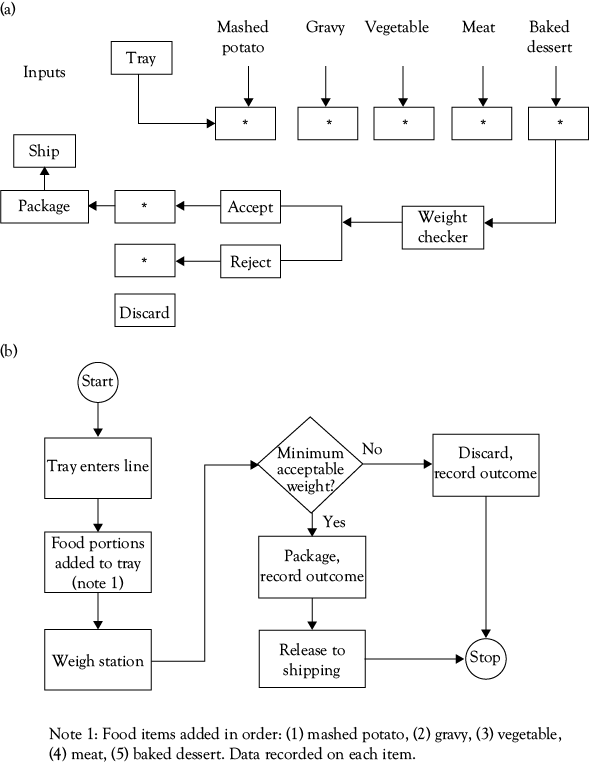
Figure 3.11 (a) Client process map for Laptime TV dinners. (b) Kmetz method process map for Laptime TV dinners.
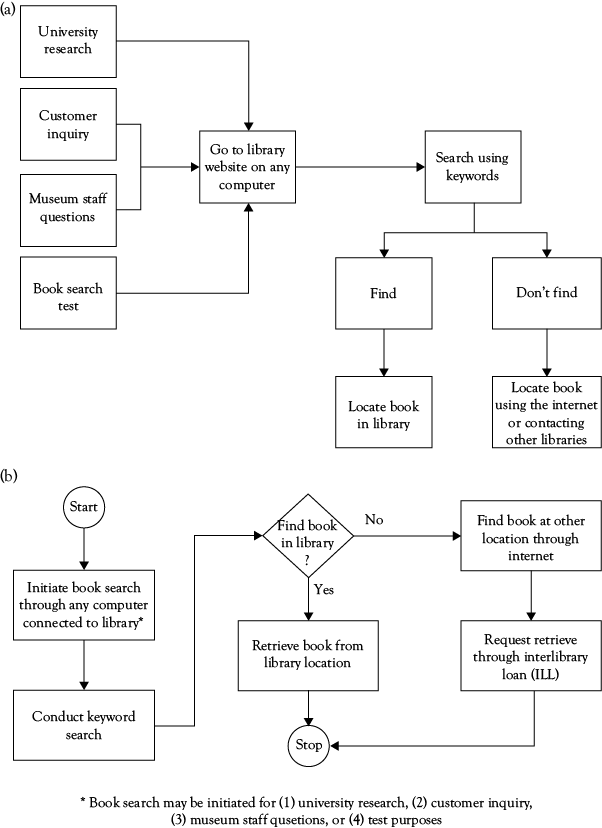
Figure 3.12. (a) Client process map for new book selection. (b) Kmetz method process map for new book selection.
Figure 3.13 also shows the conversion of a map done in data flow diagram (DFD) format, which the client used. This was an interesting case in that the client wanted to capture both the process and the interplay of parts of their information system, and believed that the best way to do this was to focus on the data. As can be seen, the actual process flow is much simpler and clearer in part (b) rather than in the DFD format in part (a); this process is really a straightforward linear sequence of steps, as shown on the left in part (b), with the subprocesses needed to retrieve and export data shown in the two detail views to the right of the main flow. This is the type of map where software like Visio can be very helpful—the detail views could be part of the file where the main flow is stored, and by hyperlinking the words “See Detail n” we can jump to those details when needed, and otherwise focus on the main process flow.
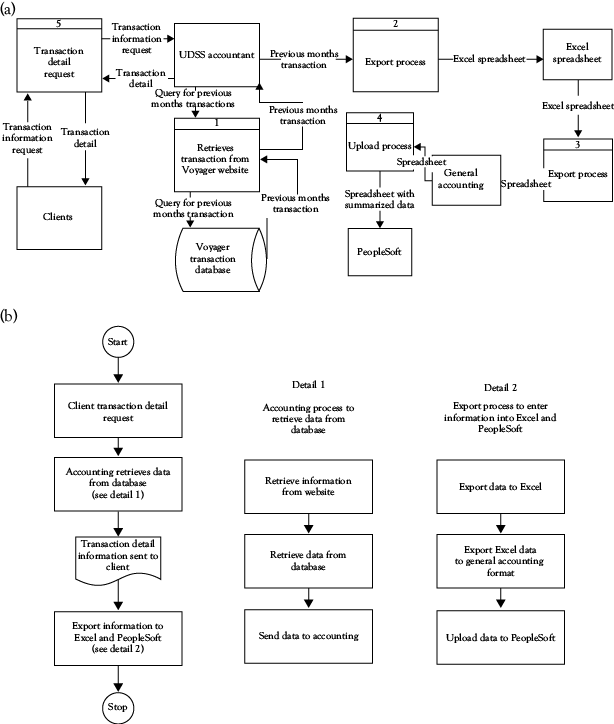
Figure 3.13. (a) Client Data Flow Diagram map for travel accounting. (b) Kmetz method process map for travel accounting.
Will Maps of the Same Process All Be the Same?
I have pointed out several times in this chapter that there is a great deal of variation in the way individuals and organizations do things, and that part of what will be in a map depends on the perceptions of the mapper. While it might seem logical to expect that using a restricted symbol set and a consistent discipline would produce the same maps for any specific process, that is not the case. It bears repeating that there will be more than one “right” answer to a process map, and in most cases there will be many right answers.
Consider the simple act of making a list of food and groceries before going shopping to buy them, an exercise I regularly run in WFMA training programs I conduct. Many people do not actually make a list, but rely on memory (pure tacit knowledge) to do their shopping, and making a list is a somewhat artificial behavior for them in the first place. For those who do make lists, the nature of that list depends on a huge number of variables. Some people rely on preprinted checklists (also available as smartphone and other device apps) and record items needed on them; in some cases everyone in the family is expected to contribute to the hard-copy list, but in other cases it is done by one primary shopper. Some use a freeform “running” list to accumulate items between shopping trips.
One memorable former student had a family of nine children, and his wife had given up a lucrative career to be a full-time mother, requiring them to provide for the entire family on one income. Their “shopping list” began with a month-long detailed menu plan (updated weekly) so that exact items could be purchased in sufficient quantities, and at the same time sales and price reductions could be fully exploited to minimize food costs. An unforeseen sale on seafood might cause a change in the menu to take advantage of the cost savings, meaning that the menu plan sometimes had to be updated more often than weekly. All items selected for purchase were then matched with coupons if possible, and sometimes lack of a coupon meant that an item was removed from the list and the menu modified to reflect that. Regular monitoring of newspapers, mail offerings, Internet coupon sites, and other media were a regular part of menu and shopping list preparation, and this task was done daily. The mother had become a self-trained nutritionist, which meant that overall menu planning and shopping had to meet nutritional standards, and that food purchases were subject to those tests. This was by far the most elaborate and rigorous shopping list preparation I have ever encountered, and could not be in greater contrast to the unmarried man whose “preparation” for food shopping consisted of quickly looking at his pantry cupboard, followed by a quick scan of his refrigerator (sometimes smelling or examining items to see if they had spoiled and had to be discarded), and then going to the local grocery store to get whatever he thought he needed; the trigger event for doing this, however, was usually that he had run out of beer.
One student had an aversion to frozen foods, and shopped every two to three days to purchase only fresh foods. She had been born in Italy, and as with a great many European city-dwellers, shopping was a daily event, and the shops visited were very specific for individual food items. That habit carried over when she emigrated to the United States and no longer found the assortment of small shops she had known in Italy, but the idea of thawing frozen chicken or frozen beans before cooking them was simply incomprehensible to her, and her shopping lists reflected the tacit knowledge that so strongly influenced her shopping behavior.
For the average class group of 20 students, there is typically not one true duplicate among the workflow maps for shopping list preparation. The same is true for every other exercise I have ever run as well as for every organization where I have mapped working processes. Any workflow map that is a complete and valid portrayal of a process is “right,” without regard to whether it matches another person’s map or some presumed “standard” that does not really exist.
Summary
This chapter, in many ways, is the major “nuts and bolts” of the WFMA method I have developed, in that it shows how to develop the workflow maps that are the core of the system. By design, the method is simple and disciplined; however, “simple” is often misperceived as “simplistic,” and nothing could be further from the truth—“simple” is “powerful,” but only so long as the simplicity is preserved.
The idea behind this method is straightforward—both mappers and users of map information can quickly learn the symbols and rules for their use, so that either can create, validate, modify, or question any map produced with this system. The maps can be consolidated and aggregated easily, whether in soft (electronic) or hard copy. Equally important, the maps can be changed quickly when processes change. As we will see in the next chapter, valid maps create a basis for measurement of process outcomes, and can be linked to important company and organizational metrics. Finally, the method is highly robust, and can be applied to any organization, no matter what it does.
Exercises
Unlike other chapters in this book, it seemed that several practice exercises would be helpful, since one of the principal objectives is to learn how to use the WFMA symbol set and its related discipline. I have included two groups of short exercises here to allow readers to apply what they have read in this chapter to different kinds of processes. The first two are exercises in doing personal things we all have to do, and which most of us probably do “on autopilot.” But try to be as complete in your mapping of both processes as you can.
The second set are situations more typical of what we might find in many workplace and office settings. Both of these have objectives relevant to the success of the hypothetical company in which they are done, and are not as likely to be personalized as the first group.
A hint—in both exercise sets, try to account for the parts of the processes which are purely information as well as those which may be movement of physical materials, and don’t be surprised if the information-intensive parts of the map are bigger and more involved than those tracking the material.
Individual Exercise Group I
On a separate piece of paper, draw a workflow diagram of:
1. How you mow the lawn, or (for those who don’t have one), how you clean your residence; and
2. How you do your laundry.
(Additional exercises can come from any common household activity—load the dishwasher; wash the dog/car/boat/windows, and so on.)
Individual Exercise Group II
On a separate piece of paper, diagram the workflows for the following two problems.
1. Your job is to periodically review customer credit card accounts in the bank where you work. Periodically, you retrieve accounts, review them, and must decide to either renew them, suspend them, or terminate them. If you suspend an account, you must change its status so that it should not be used, and then notify the customer of that change. If you terminate the account, you must notify merchants that the account is terminated, and then notify the customer. Naturally, if the account is renewed, you want to notify the customer of that, too.
2. You work in a mail-order catalog house where you receive orders from your customers by telephone. If a customer calls, you need to know if this is an existing customer with whom you have done business in the past; previous customers have a PIN. If so, you retrieve a customer number from your terminal, take the order and complete billing information, transmit the order to shipping, and then mail the documentation to the customer. If this is a new customer, and someone who is using a credit card, you must obtain the credit card data before completing the billing information. As with existing customers, you then transmit the order to shipping, and then mail the documentation to the customer. If the customer doesn’t have a credit card (and this sometimes happens), he or she will have to go through a credit review process that you pass on to another department; if approved for credit, billing information will be completed there and the order returned to you to finish as with any other customer.
(Just for fun, have several people do these and compare results—remember that no map is “wrong” so long as it accurately describes what that person does.)
|
John’s Bread |
|
2 cups water 105°F to 115°F |
|
1 pkg. or 1 Tbsp dry yeast |
|
6 to 6½ cups flour (“bread” flour is best, not “all-purpose” flour) |
|
1 Tbsp honey or sugar |
|
1 Tbsp salt |
|
3 Tbsp shortening (any light oil is good—I use safflower oil) |
|
Directions: |
|
1. Dissolve yeast in one cup of the warm water, and let stand for 10–15 minutes. This is “proofing” the yeast, and it will develop a foamy head—use all of this in the dough. |
|
2. Put yeast solution in large bowl or mixer (a good mixer can do the whole job, including the kneading). Dissolve honey in second cup of warm water and add to yeast solution in bowl. |
|
3. Add 2 cups of flour to water and mix thoroughly. (Hint: I use 2 cups of “stone-ground” (from Newark Natural Foods, bin 123) or coarse grind whole wheat flour to give more flavor, and 4 cups white flour for the rest; I use King Arthur unbleached white bread flour, and recommend it. You can use all white flour if you prefer.) |
|
4. Add salt and shortening and mix thoroughly. |
|
5. Add rest of flour. Mix in until moistened, then knead by hand or work in mixer at low speed until dough is smooth and elastic. I find that 10 minutes of mixer kneading (or 15 minutes by hand) is usually enough. |
|
6. Cover dough bowl with plastic wrap and let dough double in bulk. (Hint: wrap a large towel around the bowl to keep it warm; rising will take about 45 minutes). |
|
7. Punch down. At this point the dough can be used, or you can let it rise again to get a smoother, more chewy consistency. Punch down again after second rising. |
|
8. After rising, cut and shape into loaves (makes 2 generous “French” loaves or 4 “baguettes”) in whatever form you like. To make “French” loaves, I roll each half of the dough out into a rectangle 1⁄8” to ¼” thick, and then roll this into a long loaf. Let loaves rise for 30–45 minutes covered with plastic wrap to prevent drying out. Pinch the seams in rolls or loaves shut. The dough can be used for nearly any purpose, from bread to rolls to pizza dough (pizza can be assembled on the dough while it rises if ingredients are near room temperature—not too hot or cold). |
|
9. Preheat oven to 400°F. Cut ¼” diagonal slashes into top of loaves (or cut down middle) to allow steam to escape. Bake 35–45 minutes. If top and bottom shelves are used, switch loaves from top to bottom halfway through baking. |
|
Bread is done when tapping the bottom of the loaf with your finger makes a hollow “thump” sound. Crust should be nicely browned, not burned, not pale. |
|
Tip: Put a pan of water on the bottom of the oven to steam the loaves while they bake. This gives an extra-crunchy crust. |
|
You can also use the dough for pizza with just a partial first rising (30 minutes or so). It will have a coarser texture than with multiple risings, but the taste is fine. You can also use the dough for filled breads—roll it as if making regular loaves, but then spread a room-temperature filling on it (try browned and drained ground beef, onions, and chopped Greek calamata olives, for one), roll it up and pinch the roll shut, and bake as usual. |
|
ENJOY! I’ve never had this recipe fail. |