HTML and CSS are well supported in PyCharm. This section is by no means exhaustive, but does provide a detailed account of the tools that will help you stay productive. PyCharm provides tag completion for HTML, but it has so much more than this that tag completion is the least exciting feature in its feature set.
Emmet is essentially shorthand HTML and CSS. You type the abbreviations of what you want, hit Tab, and PyCharm will automatically convert that shorthand into the desired tags and subelements.
For example, if we were to type in div.container, we would be creating a div tag of the container class. In other words, the following:
div.container
turns into:
<div class="container"></div>
with your caret automatically placed inside the div tag.
This section won't teach you the basics of Emmet; the Emmet documentation site does a much better job: http://docs.emmet.io/
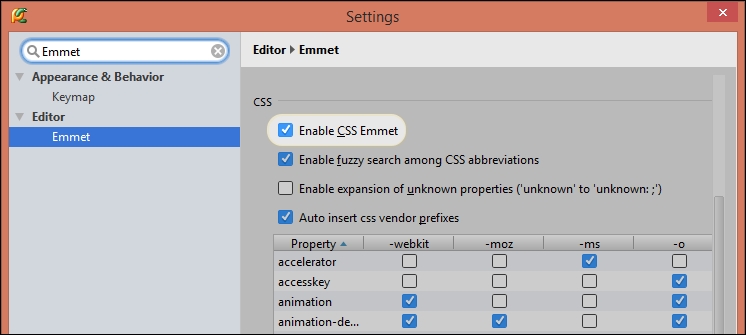
However, PyCharm has its own twist on Emmet, and this includes extra support for XML tags as well as automatic insertion of vendor prefixes that can be customized inside the Emmet subjection of the Editor settings. Depending on what CSS selector you're using, you can have PyCharm autocomplete browser prefixes for you and customize what browser prefixes you support. The default prefixes are updated with every PyCharm update.
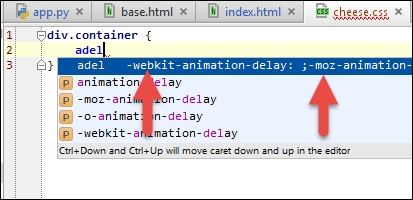
What Emmet for CSS essentially means is that now when we type in an attribute, such as animation-delay, we will get browser-specific attributes written for us as well.
Emmet also supports surround templates. For example, we can make a selection, invoke Surround With…, and use Emmet abbreviations to surround the relevant HTML.

Live debugging is one of the best PyCharm features. It renders your HTML and CSS in real time, meaning that the changes you make inside your editor are reflected in your web browser. It also channels Chrome's JavaScript console directly to PyCharm's console, meaning that you can control your web browser directly from within PyCharm.
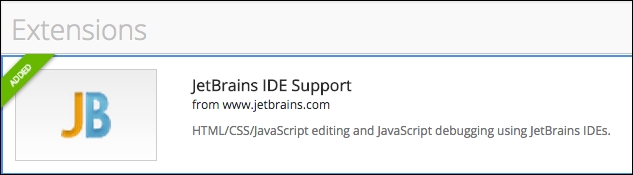
However, before we are allowed to use live edit or live debugging, we need to make sure that we have the JetBrains IDE Support extension installed.
Once this is installed, if we debug an HTML page, PyCharm will automatically figure out how to set up the connection between Chrome and itself. I wouldn't recommend messing with the settings of the extension, but I'm going to show you how to mess around with it anyway.
In most versions of Chrome, we see the JetBrains extension after we've turned on developer mode. In doing so, we gain access to the Options menu.

Inside Options, we have a few things that we can change. First of all is the port number. JetBrains uses a pretty specific port number, so don't change it unless you absolutely need to (in case you see a connection refused error pop up somewhere in PyCharm).
However, there is an option that allows you to whitelist a few sites that you want to make cross-site requests to (in case your security options are preventing a request to a specific site).

Unfortunately, I can't show you the pure awe that you feel when using live debugging, I simply can't convey it through a book (because it's something that's happening). But here are a few things to note:
- At the start, you will see a notification in Chrome, saying JetBrains IDE Support is debugging this tab.
- Any change to the HTML file will be reflected in the browser. In case it isn't, you can always use the Reload in Browser command.
- CSS changes are also reflected instantaneously, even with SASS and SCSS files, since PyCharm incrementally builds them.
- You can run JavaScript inside the console that pops up in PyCharm, and see it reflected in the console inside Chrome. Try it! Just run
alert("I am from the future");into the console and see what happens. - Whatever you select with your cursor in PyCharm will be directly reflected in Chrome.
- Make sure to disconnect after your debugging session, otherwise, the port used by PyCharm stays open.
- You can set breaking inside your JavaScript files as well as your transpiled to JavaScript files and debug the script when it's executing from PyCharm.
This is such a neat feature that I always debug when I edit. This may just be because I'm never really sure if my styles work the way I want them to, but it's good fun anyway.
File watchers are language and framework agnostic, but I feel that they are most relevant when working with HTML, CSS, JavaScript, and transpiled languages. Previously, we talked a little about file watchers in this chapter as I wanted to showcase the simplest way of setting up a watcher that suits most needs. However, the file watchers in PyCharm are very powerful and allow you to leverage macros.
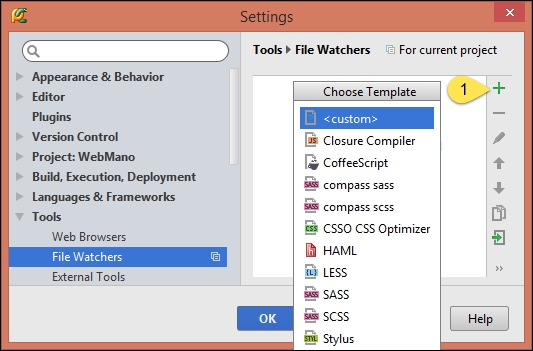
File watchers essentially run a tool on a kind of specified file after that file has been changed. For example, most of the preceding templates are for transpiled languages such as CoffeeScript and LESS. However, some of them carry out different tasks such as the CSSE CSS Optimizer template. Let's start off by looking at a sample template.

- Immediate file synchronization: This means that the file watcher will run the desired task if there is a change in the file; it does not matter whether the file is saved or not. This is enabled, by default, on most templates, but if your tool takes time to run, then disabling it would be best.
- Track only root files: This is a more subtle feature. Root files are files not included in any other file. In other words, the files that the HAML watcher is watching are the files that aren't imported anywhere in any other file. You might think that this is rather useless, but consider a language such as SCSS, which can import other SCSS files. We have a main SCSS file that we are actually going to import into our HTML. This means that when any file that is imported is changed, the watcher only runs on the main SCSS file. This saves a lot of compile time.
- Trigger watcher regardless of syntax errors: This is self-explanatory. However, I highly recommend that you keep it turned off since the console popping up and then automatically closing down again can be rather annoying since screen space is eaten up.
- Output Filters…: This allows you to use PyCharm to recognize the output from the watcher. For example, the TypeScript watcher can recognize the file path and the line numbers on which the error has occurred because of the output filter that it has enabled by default.
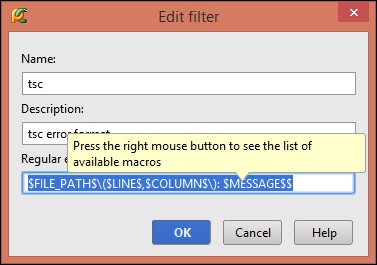
Due to this output filter, PyCharm can make links from the output console to the error in question. The
$<ALLCAPS>$variables are macros. These macros are used to recognize where the file is and the line and column number of the error message. - File type: This indicates the file type. You can only watch files with extensions recognized by PyCharm. So, in order to add a watcher for a file that is not normally recognized by PyCharm, you need to add recognition for that file by navigating to Editor | File and Code Templates
- Scope: This specifies the scope of the watcher. Although the default is what you always ought to be using, there are many other options as well that you can explore, for example Open Files.
- Program: This links program/executable to the program that is doing the task.
- Arguments: Don't ever change this if you don't know what you're doing, it's easy to get it wrong. These are basically the arguments that are fed into the program. Notice how macros are used here again to specify a generic way of passing in parameters.
- Insert macro…: This allows you to insert macros and preview them as well. Please note that it has a few quirks, for example, the Python interpreter is pointed to as
$JDKPath$.
- Working directory: This also takes in macros but also accepts hardcoded file paths. This is the directory of where the output file will go.
- Output paths to refresh: Once again, a macro is used here to refer to the compiled file. If the files were not refreshed, then live debugging would not seem to work since the compiled files would not be refreshed.
- Create output file from stdout: Only use this if the output of your program gets directly printed into stdout.