
Chapter 2 Family trees: Organising materials and processes
- 2.1 Introduction and synopsis 14
- 2.2 Getting materials organised: the materials tree 14
- 2.3 Organising processes: the process tree 17
- 2.4 Process–property interaction 20
- 2.5 Material property charts 21
- 2.6 Computer-aided information management for materials and processes 23
- 2.7 Summary and conclusions 24
- 2.8 Further reading 25
- 2.9 Exercises 26
- 2.10 Exploring design using CES 27
- 2.11 Exploring the science with CES Elements 28
A successful product—one that performs well, is good value for money and gives pleasure to the user—uses the best materials for the job, and fully exploits its potential and characteristics.
2.1 Introduction and synopsis
A successful product—one that performs well, is good value for money and gives pleasure to the user—uses the best materials for the job, and fully exploits its potential and characteristics.
The families of materials—metals, polymers, ceramics and so forth—are introduced in Section 2.2. What do we need to know about them if we are to design products using them? That is the subject of Section 2.3, in which distinctions are drawn between various types of materials information. But it is not, in the end, a material that we seek; it is a certain profile of properties—the one that best meets the needs of the design. Each family has its own characteristic profile, the ‘family likeness’, which is useful to know when deciding which family to use for a given design. Section 2.2 explains how this provides the starting point for a classification scheme for materials, allowing information about them to be organised and manipulated.
Choosing a material is only half the story. The other half is the choice of a process route to shape, join and finish it. Section 2.3 introduces process families and their attributes. Choice of material and process is tightly coupled: a given material can be processed in some ways but not others, and a given process can be applied to some materials but not to others. On top of that, the act of processing can change, even create, the properties of the material. Process families, too, exhibit family likenesses—commonality in the materials that members of a family can handle or the shapes they can make. Section 2.3 introduces a classification for processes that parallels that for materials.
Family likenesses are most strikingly seen in material property charts, a central feature of this book (Section 2.5). These are charts with material properties as axes showing the location of the families and their members. Materials have many properties, which can be thought of as the axes of a ‘material–property’ space—one chart is a two-dimensional slice through this space. Each material family occupies a discrete part of the space, distinct from the other families. The charts give an overview of materials and their properties; they reveal aspects of the science underlying the properties, and they provide a powerful tool for materials selection. Process attributes can be treated in a similar way to create process–attribute charts—we leave these for Chapter 18.
The classification systems of Sections 2.2 and 2.3 provide a structure for computer-based information management, introduced in Section 2.6. The chapter ends with a summary, further reading and exercises.
2.2 Getting materials organised: the materials tree
Classifying materials
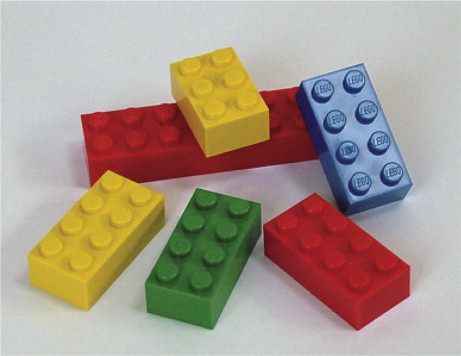
It is conventional to classify the materials of engineering into the six broad families shown in Figure 2.1: metals, polymers, elastomers, ceramics, glasses and hybrids—composite materials made by combining two or more of the others. There is sense in this—the members of a family have certain features in common: similar properties, similar processing routes and often, similar applications. Figure 2.2 shows examples of each family.
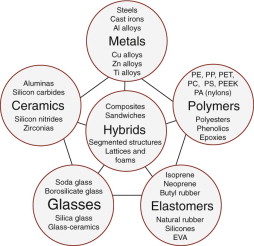
Figure 2.1 The menu of engineering materials. The basic families of metals, ceramics, glasses, polymers and elastomers can be combined in various geometries to create hybrids.

Figure 2.2 Examples of each material family. The arrangement follows the general pattern of Figure 2.1. The central hybrid here is a sandwich structure made by combining stiff, strong face sheets of aluminum with a low-density core of balsa wood.
Figure 2.3 illustrates how the families are expanded to show classes, subclasses and members, each of which is characterised by a set of attributes: its properties. As an example, the Materials universe contains the family metals, which in turn contains the class aluminum alloys, subclasses such as the 6000 series, within which we find the particular member Alloy 6061. It, and every other member of the universe, is characterised by a set of attributes that include not only the properties mentioned in Chapter 1, but also its processing characteristics, the environmental consequences of its use and its typical applications. We call this its property profile. Selection involves seeking the best match between the property profiles of the materials in the universe and that required by the design. As already mentioned, the members of one family have certain characteristics in common. Here, briefly, are some of these.
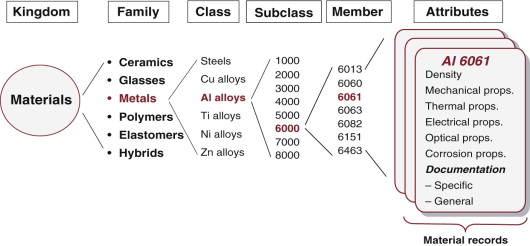
Figure 2.3 The taxonomy of the kingdom of materials and their attributes. Computer-based selection software stores data in a hierarchical structure like this.
Metals have relatively high stiffness, measured by the modulus, E. Most, when pure, are soft and easily deformed, meaning that σy is low. They can be made strong by alloying and by mechanical and heat treatment, increasing σy, but they remain ductile, allowing them to be formed by deformation processes. And, broadly speaking, they are tough, with a usefully high fracture toughness, K1c. They are good electrical and thermal conductors. But metals have weaknesses too: they are reactive; most corrode rapidly if not protected.
Ceramics are nonmetallic, inorganic solids, like porcelain or alumina—the material of spark-plug insulators. They have many attractive features. They are stiff, hard and abrasion resistant, they retain their strength to high temperatures, and they resist corrosion well. Most are good electrical insulators. They, too, have their weaknesses: unlike metals, they are brittle, with low K1c. This gives ceramics a low tolerance for stress concentrations (like holes or cracks) or for high contact stresses (at clamping points, for instance). For this reason it is more difficult to design with ceramics than with metals.
Glasses are non-crystalline (‘amorphous’) solids, a term explained more fully in Chapter 4. The commonest are the soda-lime and borosilicate glasses familiar as bottles and Pyrex ovenware, but there are many more. The lack of crystal structure suppresses plasticity, so, like ceramics, glasses are hard and remarkably corrosion resistant. They are excellent electrical insulators and, of course, they are transparent to light. But like ceramics, they are brittle and vulnerable to stress concentrations.
Polymers are organic solids based on long chains of carbon (or, in a few, silicon) atoms. Polymers are light—their densities ρ are less than those of the lightest metals. Compared with other families they are floppy, with moduli E that are roughly 50 times less than those of metals. But they can be strong, and because of their low density, their strength per unit weight is comparable to that of metals. Their properties depend on temperature so that a polymer that is tough and flexible at room temperature may be brittle at the −4 °C of a household freezer, yet turn rubbery at the 100 °C of boiling water. Few have useful strength above 150 °C. If these aspects are allowed for in the design, the advantages of polymers can be exploited. And there are many. They are easy to shape (that is why they are called plastics): complicated parts performing several functions can be moulded from a polymer in a single operation. Their properties are well suited for components that snap together, making assembly fast and cheap. And by accurately sizing the mould and pre-coloring the polymer, no finishing operations are needed. Good design exploits these properties.
Elastomers—the material of rubber bands and running shoes—are polymers with the unique property that their stiffness, measured by E, is extremely low (500–5000 times less than those of metals), and their ability to be stretched to many times their starting length yet recover their initial shape when released. Despite their low stiffness they can be strong and tough—think of car tires.
Hybrids are combinations of two (or more) materials in an attempt to get the best of both. Glass and carbon-fibre-reinforced polymers (GFRP and CFRP) are hybrids; so, too, are sandwich structures, foams and laminates. And almost all the materials of nature (wood, bone, skin, leaf) are hybrids—bone, for instance, is a mix of collagen (a polymer) with hydroxyapatite (a mineral). Hybrid components are expensive and they are relatively difficult to form and join. So despite their attractive properties the designer will use them only when the added performance justifies the added cost. Today’s growing emphasis on high performance and fuel efficiency provides increasing drivers for their use.
2.3 Organising processes: the process tree
A process is a method of shaping, joining or finishing a material. Casting, injection moulding, fusion welding and electro-polishing are all processes; there are hundreds of them (Figures 2.4 and 2.5). It is important to choose the right process-route at an early stage in the design before the cost-penalty of making changes becomes large. The choice, for a given component, depends on the material of which it is to be made; on its shape, dimensions and precision; and on how many are to be made—in short, on the design requirements.
The choice of material limits the choice of process. Polymers can be moulded, other materials cannot. Ductile materials can be forged, rolled and drawn but those that are brittle must be shaped in other ways. Materials that melt at modest temperatures to low-viscosity liquids can be cast; those that do not have to be processed by other routes. Shape, too, influences the choice of process. Slender shapes can be made easily by rolling or drawing but not by casting. Hollow shapes cannot be made by forging, but they can by casting or moulding.
Classifying processes
Manufacturing processes are organised under the headings shown in Figure 2.4. Primary processes create shapes. The first row lists six primary forming processes: casting, moulding, deformation, powder methods, methods for forming composites and special methods including rapid prototyping. Secondary processes modify shapes or properties; here they are shown as machining, which adds features to an already shaped body, and heat treatment, which enhances surface or bulk properties. Below these come joining and finally, surface treatment. Figure 2.5 illustrates some of these; it is organised in the same way as Figure 2.4. The merit of Figure 2.4 is as a flow chart: a progression through a manufacturing route. It should not be treated too literally: the order of the steps can be varied to suit the needs of the design. The point it makes is that there are three broad process families: those of shaping, joining and finishing.
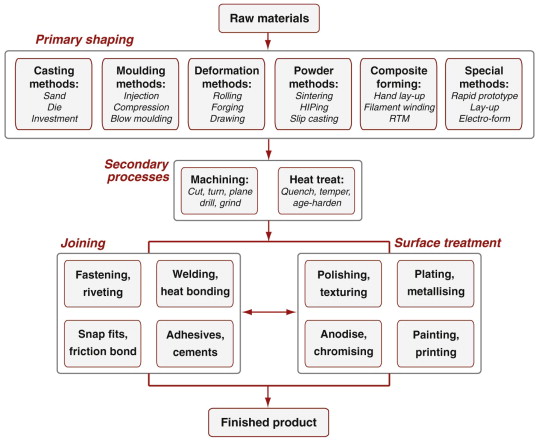
Figure 2.4 The classes of process. The first row contains the primary shaping processes; below lie the secondary processes of machining and heat treatment, followed by the families of joining and finishing processes.
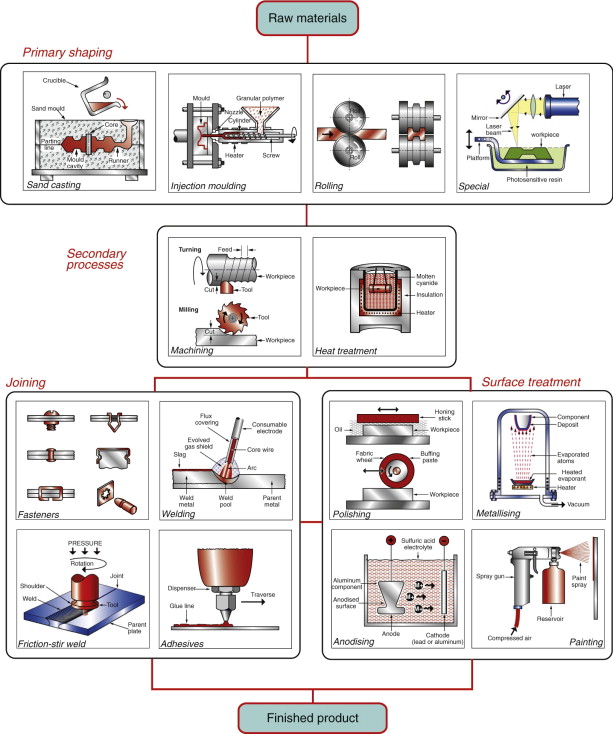
Figure 2.5 Examples of the families and classes of manufacturing processes. The arrangement follows the general pattern of Figure 2.4.
To organise information about processes, we need a hierarchical classification like that used for materials, giving each process a place. Figure 2.6 shows part of the hierarchy. The Process universe has three families: shaping, joining and surface treatment. In this figure, the shaping family is expanded to show classes: casting, deformation, moulding etc. One of these, moulding, again is expanded to show its members: rotation moulding, blow moulding, injection moulding and so forth. Each process is characterised by a set of attributes: the materials it can handle, the shapes it can make, their size, precision and an economic batch size (the number of units that it can make most economically).
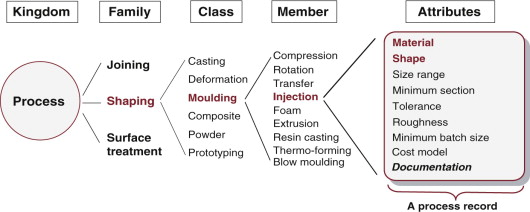
Figure 2.6 The taxonomy of the kingdom of process with part of the shaping family expanded. Each member is characterised by a set of attributes. Process selection involves matching these to the requirements of the design.
The other two families are partly expanded in Figure 2.7. There are three broad classes of joining process: adhesives, welding and fasteners. In this figure one of them, welding, is expanded to show its members. As before, each member has attributes. The first is the material or materials that the process can join. After that the attribute list differs from that for shaping. Here the geometry of the joint and the way it will be loaded are important, as are requirements that the joint can or cannot be disassembled, be watertight and be electrically conducting.
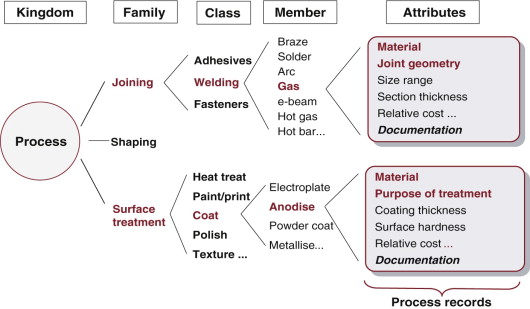
Figure 2.7 The taxonomy of the process kingdom again, with the families of joining and finishing partly expanded.
The lower part of the figure expands the family of finishing processes. Some of the classes it contains are shown; one of them, coating, is expanded to show some of its members. Finishing adds cost: the only justification for applying a finishing process is that it hardens, protects or decorates the surface in ways that add value. As with joining, the material to be coated is an important attribute but the others again differ.
We return to process selection in Chapters 18 and 19.
2.4 Process–property interaction
Processing can change properties. If you hammer a metal (forging) it gets harder; if you then heat it up it gets softer again (annealing). If polyethylene—the stuff of plastic bags—is drawn to a fibre, its strength is increased by a factor of 5. Soft, stretchy rubber is made hard and brittle by vulcanising. Heat-treating glass in a particular way can give it enough impact resistance to withstand a projectile (bullet-proof glass). And composites like carbon-fibre-reinforced epoxy have no useful properties at all until processed—prior to processing they are just a soup of resin and a sheaf of fibres.
Joining, too, changes properties. Welding involves the local melting and resolidifying of the faces of the parts to be joined. As you might expect, the weld zone has properties that differ from those of the material far from the weld—usually worse. Surface treatments, by contrast, generally are chosen to improve properties: electroplating to improve corrosion resistance, carburising to improve wear.
Process–property interaction appears in a number of chapters. We return to it specifically in Chapter 19.
2.5 Material property charts
Data sheets for materials list their properties; they give no perspective and present no comparisons. The way to achieve these is to plot material property charts. They are of two types: bar charts and bubble charts.
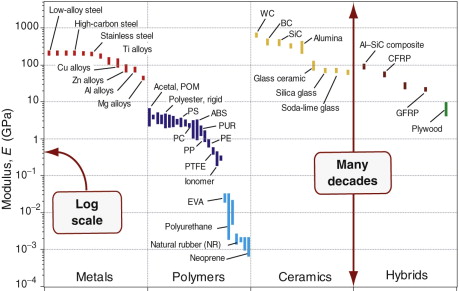
A bar chart is simply a plot of one property for all the materials of the universe. Figure 2.8 shows an example: it is a bar chart for modulus, E. The largest is more than 10 million times greater than the smallest—many other properties have similar ranges—so it makes sense to plot them on logarithmic1, not linear scales, as here. The length of each bar shows the range of the property for each material, here segregated by family. The differences between the families now become apparent. Metals and ceramics have high moduli. Those of polymers are smaller, by a factor of about 50, than those of metals; those of elastomers are some 500 times smaller still.
More information is packed into the picture if two properties are plotted to give a bubble chart, as in Figure 2.9, here showing modulus E and density ρ. As before, the scales are logarithmic. Now families are more distinctly separated: all metals lie in the reddish zone near the top right; all polymers lie in the dark blue envelope in the center, elastomers in the lighter blue envelope below, ceramics in the yellow envelope at the top. Each family occupies a distinct, characteristic field.
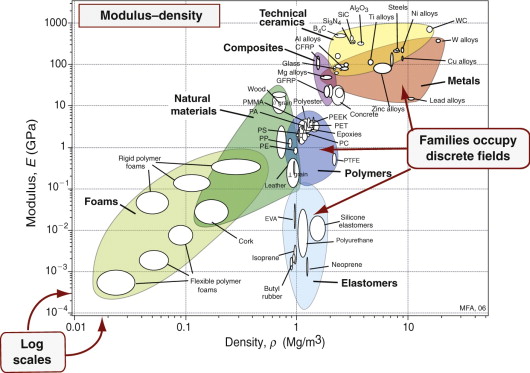
Material property charts like these are a core tool, used throughout this book.
- They give an overview of the physical, mechanical and functional properties of materials, presenting the information about them in a compact way.
- They reveal aspects of the physical origins of properties, helpful in understanding the underlying science.
- They become a tool for optimised selection of materials to meet given design requirements, and they help understand the use of materials in existing products.
These two charts, and all the others in the book, were made using the CES software, which allows charts of any pair of properties, or of functions of properties (like E/ρ) to be created at will. Their uses, and the operations they allow, will emerge in the chapters that follow.
2.6 Computer-aided information management for materials and processes
Classification is the first step in creating an information management system for materials and processes. Records for the members of each universe are indexed, so to speak, by their position in the tree-like hierarchies of Figures 2.32.6 and 2.7. Each record has a unique place, making retrieval easy.
The CES software is an example of an information and selection system that uses this structure. Figure 2.10 shows part of a record for a material; Figure 2.11 shows the same for a process. A record is found by opening the tree, following the branches until the desired record is located (browsing) or by locating it by name using a text-search facility (searching).
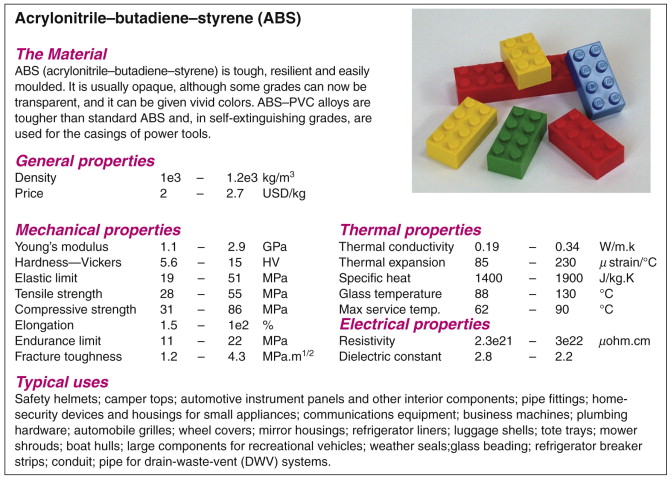
Figure 2.10 Part of a record for a material, ABS. It contains numeric data, text and image-based information.
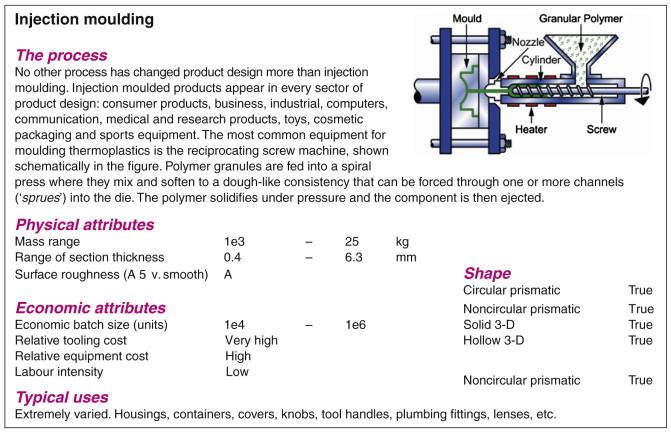
Figure 2.11 Part of a record for a process, injection moulding. The image shows how it works, and the numeric and Boolean data and text document its attributes.
Don’t worry for the moment about the detailed content of the records—they are explained in later chapters. Note only that each contains data of two types. Structured data are numeric, Boolean (Yes/No) or discrete (e.g. Low/Medium/High), and can be stored in tables. Later chapters show how structured data are used for selection. Unstructured data take the form of text, images, graphs and schematics. Such information cannot so easily be used for selection but it is essential for the step we refer to in the next chapter as documentation.
2.7 Summary and conclusions
There are six broad families of materials for design: metals, ceramics, glasses, polymers, elastomers and hybrids that combine the properties of two or more of the others. Processes, similarly, can be grouped into families: those that create shape, those that join and those that modify the surface to enhance its properties or to protect or decorate it. The members of the families can be organised into a hierarchical tree-like catalog, allowing them to be looked up in much the same way that you would look up a member of a company in the company’s management sheet. A record for a member stores information about it: numeric and other tabular data for its properties, text, graphs and images to describe its use and applications. This structure forms the basis of computer-based selection systems of which the CES system is an example. It enables a unique way of presenting data for materials and processes as property charts, two of which appear in this chapter. They become one of the central features of the chapters that follow.
Ashby M.F., Johnson K. Materials and Design—The Art and Science of Material Selection in Product Design 2002 Butterworth-Heinemann Oxford, UK ISBN 0-7506-5554-2. (Materials and processes from an aesthetic point of view, emphasising product design.)
Bralla J.G. Design for Manufacturability Handbook 2nd ed. 1998 McGraw-Hill New York, USA ISBN 0-07-007139-X. (Turgid reading, but a rich mine of information about manufacturing processes.)
Callister W.D. Materials Science and Engineering, An Introduction 6th ed. 2003 John Wiley New York, USA ISBN 0-471-13576-3. (A well-respected materials text, now in its sixth edition, widely used for materials teaching in North America.)
Charles J.A., Crane F.A.A., Furness J.A.G. Selection and Use of Engineering Materials 3rd ed. 1997 Butterworth-Heinemann Oxford, UK ISBN 0-7506-3277-1. (A materials science approach to the selection of materials.)
Dieter G.E. Engineering Design, A Materials and Processing Approach 2nd ed. 1991 McGraw-Hill New York, USA ISBN 0-07-100829-2. (A well-balanced and respected text focusing on the place of materials and processing in technical design.)
Farag M.M. Selection of Materials and Manufacturing Processes for Engineering Design 1989 Prentice-Hall Englewood Cliffs, NJ, USA ISBN 0-13-575192-6. (A materials science approach to the selection of materials.)
Kalpakjian S., Schmid S.R. Manufacturing Processes for Engineering Materials 4th ed. 2003 Prentice-Hall, Pearson Education New Jersey, USA ISBN 0-13-040871-9. (A comprehensive and widely used text on material processing.)
2.9 Exercises
- Exercise E2.1 List the six main classes of engineering materials. Use your own experience to rank them approximately:
- Exercise E2.2 Examine the material property chart of Figure 2.9. By what factor are polymers less stiff than metals? Is wood denser or less dense than polyethylene (PE)?
- Exercise E2.3 What is meant by a shaping process? Look around you and ask yourself how the things you see were shaped.
- Exercise E2.4 Almost all products involve several parts that are joined. Examine the products immediately around you and list the joining methods used to assemble them.
- Exercise E2.5 How many different surface treatment processes can you think of, based on your own experience? List them and annotate the list with the materials to which they typically are applied.
- Exercise E2.6 How many ways can you think of for joining two sheets of a plastic like polyethylene? List each with an example of an application that might use it.
- Exercise E2.7 A good classification looks simple—think, for instance, of the periodic table of the elements. Creating it in the first place, however, is another matter. This chapter introduced two classification schemes that work, meaning that every member of the scheme has a unique place in it, and any new member can be inserted into its proper position without disrupting the whole. Try one for yourself. Here are some scenarios. Make sure that each level of the hierarchy properly contains all those below it. There may be more than one way to do this, but one is usually better than the others. Test it by thinking how you would use it to find the information you want.
- (a) You run a bike shop that stocks bikes of many types, prices and sizes. You need a classification system to allow customers to look up your bikes on the Internet. How would you do it?
- (b) You are asked to organize the inventory of fasteners in your company. There are several types (snap, screw, rivet) and, within each, a range of materials and sizes. Devise a classification scheme to store information about them.
2.10 Exploring design using CES
Designers need to be able to find data quickly and reliably. That is where the classifications come in. The CES system uses the classification scheme described in this chapter. Before trying these exercises, open the Materials universe in CES and explore it. The opening screen offers options—take the Edu Level 1: Materials.
- Exercise E2.8 Use the ‘Browse’ facility in Level 1 of the CES software to find the record for Copper. What is its thermal conductivity? What is its price?
- Exercise E2.9 Use the ‘Browse’ facility in Level 1 of the CES software to find the record for the thermosetting polymer Phenolic. Is it cheaper or more expensive than Epoxies
- Exercise E2.10 Use the ‘Browse’ facility to find records for the polymer-shaping processes Rotational moulding. What, typically, is it used to make?
- Exercise E2.11 Use the ‘Search’ facility to find out what Plexiglas is. Do the same for Pyroceram.
- Exercise E2.12 Use the ‘Search’ facility to find out about the process Pultrusion. Do the same for TIG welding. Remember that you need to search the Process universe, not the Material universe.
- Exercise E2.13 Compare Young’s modulus E (the stiffness property) and thermal conductivity λ (the heat transmission property) of aluminum alloys (a nonferrous metal), alumina (a technical ceramic), polyethylene (a thermoplastic polymer) and neoprene (an elastomer) by retrieving values from CES Level 1. Which has the highest modulus? Which has the lowest thermal conductivity?
2.11 Exploring the science with CES Elements
The CES system contains a database for the periodic table. The records contain fundamental data for each of the elements. We will use this in the book to delve a little deeper into the science that lies behind material properties.
- Exercise E2.14 Refresh your memory of the periodic table, perhaps the most significant classification of all time. Select CES Elements (File > Change database > CES Elements) and double-click on periodic table to see the table. This database, like the others described in this chapter, has a tree-like structure. Use this to find the record for aluminum (Row 3, atomic number 13) and explore its contents. Many of the properties won’t make sense yet. We introduce them gradually throughout the book.
1 Logarithmic means that the scale goes up in constant multiples, usually of 10. We live in a logarithmic world—our senses, for instance, all respond in that way.