
Chapter 7 Bend and crush: Strength-limited design
Stiffness-limited design, described in Chapter 5, is design to avoid excessive elastic deflection. Strength-limited design, our concern here, is design to avoid plastic collapse. That generally means design to avoid yield, arranging that the component remains elastic throughout, when it is called elastic design. Elastic design is not always possible or necessary: local yielding may be permissible provided general yield is avoided.
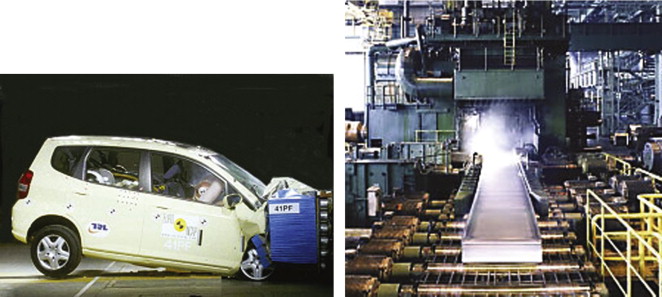
Elastic design, avoiding plasticity, ensures that the cabin of the car does not deform in a crash. Plasticity absorbs the energy of impact, and allows metals to be shaped and polymers to be moulded. (Image of crash testing courtesy AutoNews; image of hot rolling courtesy of Tanis Inc., Delafield, WI)
7.1 Introduction and synopsis
Stiffness-limited design, described in Chapter 5, is design to avoid excessive elastic deflection. Strength-limited design, our concern here, is design to avoid plastic collapse. That generally means design to avoid yield, arranging that the component remains elastic throughout, when it is called elastic design. Elastic design is not always possible or necessary: local yielding may be permissible provided general yield is avoided.
That is half the picture. The other half is design to permit controlled plastic collapse. The safety of modern cars relies on the front of the car absorbing the kinetic energy in a collision by plastic deformation. And the manufacturing processes of metal rolling, forging, extrusion and pressing use plastic flow. Here, strains are large, elastic deformation irrelevant and the focus is on the forces and work necessary to achieve a prescribed change of shape (see cover picture).
Plasticity problems are solved in more than one way. When yield is to be avoided, we analyse the elastic state of stress in a component and make sure that this nowhere exceeds the yield strength. Full plasticity, by contrast, requires general yield. Then the mechanism of plastic collapse must be identified and the collapse load calculated by requiring that yield does occur where it needs to.
Chapter 5 introduced elastic solutions for common modes of loading: tension, compression, bending, torsion or internal pressure. Not surprisingly there are equivalent results for plastic design, and we start with these. As before, you don’t need to know how to derive them, just where to find them and how to use them. We use them to develop material indices for strength-limited design and apply them via case studies.
7.2 Standard solutions to plastic problems
Yielding of ties and columns
A tie is a rod loaded in tension, a column is a rod loaded in compression. The state of stress within them is uniform, as was shown in Figure 5.1(a). If this stress, σ, is below the yield strength σy the component remains elastic; if it exceeds σy, it yields. Yield in compression is only an issue for short, squat columns. Slender columns and panels in compression are more likely to buckle elastically first (Chapter 5).
Yielding of beams and panels
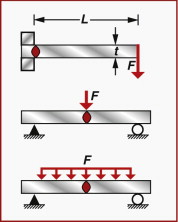
The stress state in bending was introduced in Chapter 5. A bending moment M generates a linear variation of longitudinal stress σ across the section (Figure 7.1(a)) defined by
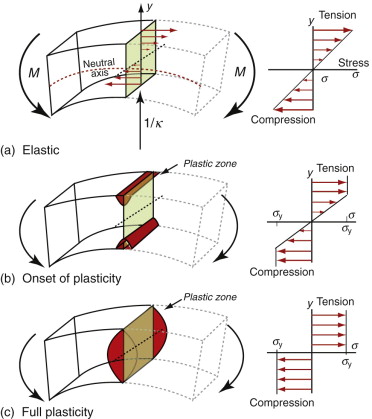
Figure 7.1 A beam loaded in bending. The stress state is shown on the right for purely elastic loading (a), the onset of plasticity (b) and full plasticity (c).
where y is the distance from the neutral axis, and the influence of the cross-section shape is captured by I, the second moment of area.
For elastic deflection, we were interested in the last term in the equation—that containing the curvature κ. For yielding, it is the first term. The maximum longitudinal stress σmax occurs at the surface (Figure 7.1(a)), at the greatest distance ym from the neutral axis
The quantity Ze = I/ym is called the elastic section modulus (not to be confused with the elastic modulus of the material, E). If σmax exceeds the yield strength σy of the material of the beam, small zones of plasticity appear at the surface where the stress is highest, as in Figure 7.1(b). The beam is no longer elastic and, in this sense, is damaged even if it has not failed completely. If the moment is increased further, the linear profile is truncated—the stress near the surface remains equal to σy and plastic zones grow inward from the surface. Although the plastic zone has yielded, it still carries load. As the moment increases further the plastic zones grow until they penetrate through the section of the beam, linking to form a plastic hinge (Figure 7.1(c)). This is the maximum moment that can be carried by the beam; further increase causes it to collapse by rotating about the plastic hinge.
Example 7.1
Calculate the maximum ‘extreme fibre’ stress in the 300 × 25 × 1 mm stainless steel ruler in Examples 5.1 and 5.2, when it is mounted as a cantilever with the X-X axis horizontal with 250 mm protruding and a weight of 10 N is hung from its end. Compare this bending stress with the yield stress of the material and the direct stress when a 10 N force is used to pull the ruler axially.
Answer. The maximum bending moment M in the cantilever (at its base—adjacent to the support) is M = WL = 0.25 × 10 = 2.5 Nm. Using equation (7.2) with IXX = 2.1 mm4 (from Example 5.1), and ym = 0.5 mm at the extreme fibre of the beam,
The yield strength of stainless steels lies in the range 200 to 1000 MPa. So the ruler would have to be made of quite a strong stainless steel to withstand this load without yielding.
When loaded by the same force in tension, the stress would be
This stress is far less than the strength of most engineering materials (see Figure 6.6).
Figure 7.2 shows simply supported beams loaded in bending. In the first, the maximum moment M is FL, in the second it is FL/4 and in the third FL/8. Plastic hinges form at the positions indicated in red when the maximum moment reaches the moment for collapse. This failure moment, Mf, is found by integrating the moment caused by the constant stress distribution over the section (as in Figure 7.1(c), compression one side, tension the other)
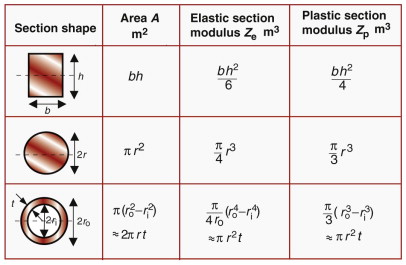
where Zp is the plastic section modulus. So two new functions of section shape have been defined for failure of beams: one for first yielding, Ze, and one for full plasticity, Zp. In both cases the moment required is simply Zσy. Values for both are listed in Figure 7.3. The ratio Zp/Ze is always greater than 1 and is a measure of the safety margin between initial yield and collapse. For a solid rectangle, it is 1.5, meaning that the collapse load is 50% higher than the load for initial yield. For efficient shapes, like tubes and I-beams, the ratio is much closer to 1 because yield spreads quickly from the surface to the neutral axis.
Yielding of shafts
We saw in Chapter 5 that a torque, T, applied to the ends of a shaft with a uniform circular section, and acting in the plane normal to the axis of the bar as in Figure 7.4, produces a shear stress that increases linearly with distance r from the central axis:
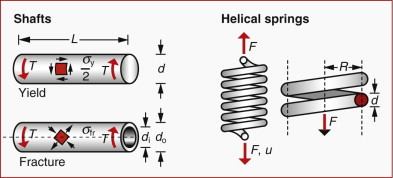
Figure 7.4 Elastic torsion of shafts. The stress in the shaft depends on the torque T and the polar moment of area K. Helical springs are a special case of torsional loading.
where K is the polar second moment of area. The resulting elastic deformation was described by the angle of twist per unit length θ/L. Failure occurs when the maximum surface stress exceeds the yield strength σy of the material. The maximum shear stress, τmax, is at the surface and has the value
where R is the radius of the shaft. From Chapter 6, the yield stress in shear, k, is half the tensile yield stress, so first yield occurs when τmax = σy/2. When the torque is increased further, plasticity spreads inward. The maximum torque that the shaft can carry occurs when τ = k over the whole section. Any greater torque than this causes the shaft to collapse in torsion by unrestrained rotation. For example, for a solid circular section, the collapse torque is
Example 7.2
The solid brass shaft in Example 5.2 has a yield strength in tension of 300 MPa. Calculate the torque at first yield and the torque at plastic collapse (that is, it is plastic right through).
Answer. At first yield, using equation (7.5) and noting that J = K for circular sections (see equation (5.7)):
At plastic collapse, using equation (7.6) gives
Helical springs are a special case of torsional loading (Figure 7.4): when the spring is loaded axially, the individual turns twist. It is useful to know the spring stiffness, S. If the spring has n turns of wire of shear modulus G, each of diameter d, wound to give a spring of radius R, the stiffness is
where F is the axial force applied to the spring and u is its extension. The elastic extension is limited by the onset of plasticity. This occurs at the force
Spinning disks (flywheels)
Spinning disks or rings store kinetic energy U (Figure 7.5). Centrifugal forces generate a radial tensile stress in the disk that reaches a maximum value σmax. Analysis of a disk of density ρ, radius R and thickness t, rotating at an angular velocity ω radians/second, gives the kinetic energy and the maximum stress (when Poisson’s ratio is taken as 1/3) as
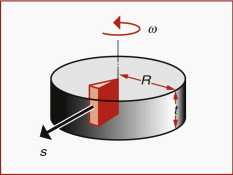
Figure 7.5 Spinning disks, as in flywheels and gyroscopes, carry radial tensile stress caused by centrifugal force.
The disk yields when σmax exceeds σy, and this defines the maximum allowable ω and limits the inertial energy storage.
Example 7.3
A flywheel has a radius of 150 mm and a thickness of 50 mm. It is made of CFRP with a strength of 700 MPa and a density of 1600 kg/m3. What is its burst speed (the speed at which the material at the centre reaches its failure strength)? What is the maximum amount of kinetic energy it can store? How does this value compare with the chemical energy stored in the same mass of gasoline?
Answer. When the stress at the centre reaches the yield strength, equation (7.8) gives:
At this speed, equation (7.8) gives the maximum possible kinetic energy as
The mass of the flywheel is m = πR2tρ = π 0.152 × 0.05 × 1600 = 5.7 kg. Using the calorific value of gasoline of 43 000 kJ/kg (Example 4.3), the equivalent chemical energy is 43 000 × 5.7 = 245 MJ; that is, 160 times the maximum kinetic energy stored in the flywheel. Flywheel-powered cars are impractical. The flywheel would have to weigh at least 100 times more than a full gas tank for an equivalent range.
Flywheel energy storage is, however, practical for regenerative braking systems, which store energy during deceleration of a vehicle and re-insert it during acceleration. This is the principle of the Kinetic Energy Recovery Systems (KERS), introduced into Formula I racing cars in 2009.
Contact stresses
Contact stress analysis is important in design of rolling and sliding contacts as in bearings, gears and railway track. Yielding at contacts is closely linked to failure by wear and fatigue. When surfaces are placed in contact they touch at a few discrete points. If the surfaces are loaded, the contacts flatten elastically and the contact areas grow (Figure 7.6). The stress state beneath the contact is complex, first analysed by the very same Hertz1 for whom the unit of frequency is named. Consider a sphere of radius R pressed against a flat surface with a load F. Both sphere and surface have Young’s modulus E. While the contact is elastic (and again assuming Poisson’s ratio ν = 1/3), the radius of the contact area is
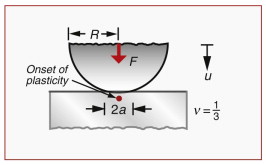
Figure 7.6 Contact stresses are another form of stress concentration. When elastic, the stresses and displacement of the surfaces toward each other can be calculated.
and the relative displacement of the two bodies is
For failure in contact, we need the maximum value of the shear stress, since it is this that causes first yield. It is beneath the contact at a depth of about a/2, and has the value
If this exceeds the shear yield strength k = σy/2, a plastic zone appears beneath the center of the contact.
Example 7.4
A steel ball bearing of radius 5 mm is pressed with a force of 10 N onto a steel ball-race. Both bearing and race have a Young’s modulus of 210 GPa and yield strength of 400 MPa. Calculate the contact radius and the relative displacement of the two bodies. Compare the maximum stress beneath the contact patch with the strength of the surface and with the stress when the load of 10 N is uniformly distributed over a circular section radius 5 mm.
Answer. The contact radius is equation (7.9)
The relative displacement is equation (7.10)
The maximum shear stress in the ball race is equation (7.11)
This is a significant proportion of the yield strength of the surface, indicating that fatigue failure due to cyclic loading may be an issue of concern. For comparison, a load of 10 N applied to an area of radius 5 mm would generate a very low stress of
Stress concentrations
Holes, slots, threads and changes in section concentrate stress locally (Figure 7.7). Yielding will therefore start at these places, though as the bulk of the component is still elastic this initial yielding is not usually catastrophic. The same cannot be said for fatigue (Chapter 9), where stress concentrations often are implicated as the origins of failure.
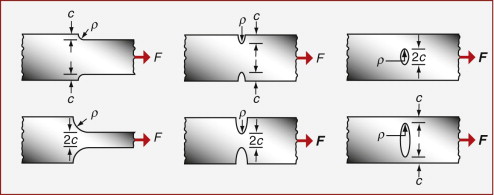
Figure 7.7 Stress concentrations. The change of section concentrates stress most strongly where the curvature of the surface is greatest.
We define the nominal stress in a component σnom as the load divided by the cross-section, ignoring features that cause the stress concentration. The maximum local stress σmax is then found approximately by multiplying the nominal stress σnom by a stress concentration factor Ksc, where
Here ρsc is the minimum radius of curvature of the stress-concentrating feature and c is a characteristic dimension associated with it: either the half-thickness of the remaining ligament, the half-length of a contained notch, the length of an edge notch or the height of a shoulder, whichever is least (Figure 7.7). The factor α is roughly 2 for tension, but is nearer 1/2 for torsion and bending. Though inexact, the equation is an adequate working approximation for many design problems. More accurate stress concentration factors are tabulated in compilations such as Roark (see Further reading at the end of this chapter).
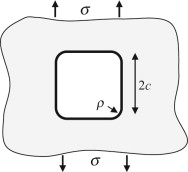
As a simple example, consider a circular hole in a plate loaded in tension. The radius of curvature of the feature is the hole radius, ρsc = R, and the characteristic dimension is also the radius, c = R. From equation (7.12), the local stress next to the hole is thus three times the nominal tensile stress—however small the hole. Local yielding therefore occurs when the nominal stress is only σy/3.
Example 7.5
The skin of an aircraft is made of aluminum with a yield strength of 300 MPa and a thickness of 8 mm. The fuselage is a circular cylinder of radius 2 m, with an internal pressure that is Δp = 0.5 bar (5 × 10⁴ N/m2) greater than the outside pressure. A window in the side of the aircraft is nominally square (160 mm × 160 mm). It has corners with a radius of curvature of ρ = 5 mm.
Calculate the nominal hoop stress in the aircraft wall due to pressure and estimate the peak stress near the corner of the window. Ignore the effects of longitudinal stress in the tube. Note that the hoop stress in the wall of a circular pressure vessel of radius R and thickness t with internal pressure Δp is given by σ = ΔpR/t. If the maximum allowable stress is 100 MPa, is 5 mm a suitable radius for the corners of the window?
Answer. The nominal ‘hoop’ stress is:
The sketch shows how the stress concentration factor for the window geometry is equivalent to one of the standard cases shown in Figure 7.7. Taking c as half the width of the window (80 mm) and ρSC = 5 mm, the stress concentration factor is: 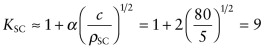
Consequently the peak stress near the corner of the window is approximately 9 × 25 = 112 MPa, which is greater than the allowable value, risking fatigue failure after a small number of pressurisations. Such was the fate of the de Havilland Comet—the world’s first pressurised commercial jet airliner, which first flew in 1949. Hence the large corner radii of aircraft windows today.
7.3 Material indices for yield-limited design
Minimising weight: a light, strong tie-rod
Many structures rely on tie members that must carry a prescribed tensile load without yielding—the cover picture of Chapter 4 showed two—often with the requirement that they be as light as possible. Consider a design that calls for a cylindrical tie-rod of given length L that must carry a tensile force F as in Figure 5.7(a), with the constraint that it must not yield, but remain elastic. The objective is to minimise its mass. The length L is specified but the cross-section area A is not (Table 7.1).
Table 7.1 Design requirements for the light tie
| Function | • Tie-rod |
| Constraints | |
| Objective | • Minimise the mass m of the tie |
| Free variables |
As before, we first seek an equation describing the quantity to be maximised or minimised. Here it is the mass m of the tie
where A is the area of the cross-section and ρ is the density of the material of which it is made. We can reduce the mass by reducing the cross-section, but there is a constraint: the section area A must be sufficient to carry the tensile load F without yielding, requiring that

where σy is the yield strength. Eliminating A between these two equations gives
The lightest tie that will carry F safely is that made of the material with the smallest value of ρ/σy. We could define this as the material index of the problem, seeking a minimum, but as in Chapter 5 we will invert it, seeking materials with the largest values of

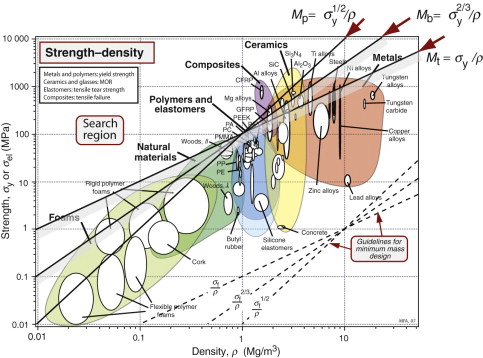
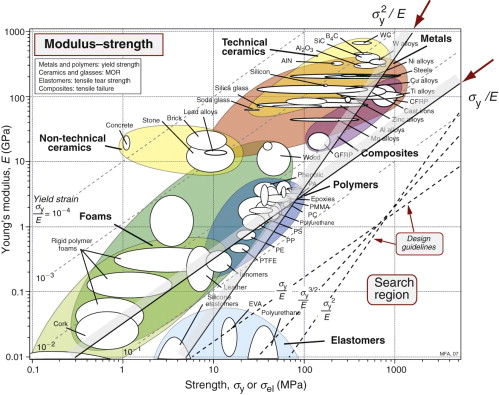
This index, the specific strength, is plotted as a line of slope 1 in the chart of Figure 7.8. A particular value of σy/ρ is identified, passing through the high-strength end of several major alloy systems—nickel alloys, high-strength steels and aluminum and magnesium alloys. Titanium alloys are significantly better than the other metals; CFRP is better still. Ceramics and glasses have high values of Mt but are impractical as structural ties because of their brittleness.
Tension, then, is straightforward. The real problem in elastic design is seldom tension; it is bending. We therefore revisit the bending of panels and beams, applying a constraint on strength rather than stiffness.
Minimising weight: light, strong panels
Figure 5.7(b) showed a panel supported at its edges, carrying a specified central load. The width b and span L are fixed, but we are free to choose the thickness h. The objective is to minimise the mass. Reducing the thickness reduces the mass, but it must be sufficient for the maximum stress to be below the elastic limit (Table 7.2).
Table 7.2 Design requirements for the light panel
| Function | • Panel in bending |
| Constraints | |
| Objective | • Minimise the mass m of the panel |
| Free variables |
The procedure is much as before—set up an equation for the mass; find an expression for the maximum stress (noting that for a rectangular section, I = bh3/12); use this constraint to eliminate the free variable h and read off the material index. The analysis itself is left for the Exercises; the result is

This index also is shown by a shaded guideline in Figure 7.8. Now all the light alloys (Mg, Al and Ti) outperform steel, as do GFRP and wood. CFRP still leads the way.
Light, strong beams: the effect of shape
In beam design we are free to choose the shape as well as the dimensions of the cross-section. First we consider beams of prescribed shape, with freedom to change their size in a self-similar way. Then we explore how much better we can make the design by using efficient shapes.
Start with the beam of square section A = b × b, which may vary in size, loaded in bending over a span of fixed length L with a central load F (Figure 5.7(c) and Table 7.3).
Table 7.3 Design requirements for the light strong beam
| Function | • VBeam in bending |
| Constraints | |
| Objective | • Minimise the mass m of the beam |
| Free variables |
The analysis is similar to the panel (see Exercises), with the modified second moment of area, I = b4/12 = A2/12. The resulting material index is
The chart in Figure 7.8 shows that the slope of this index lies between the other two, so the competition between metals, wood and composites changes again, with CFRP still on top.
But, you will say, no one uses solid, square-section beams for minimum mass design—and you are right. If you want to support bending loads it is better to choose a shape that uses less material to provide the same strength. Wooden floor-joists in houses are typically twice as deep as they are wide; standard steel and aluminum beams have an I-section or a box section; space frames, commonly, are made from tubes. Does this change the index? Well, yes and no. Let’s start with the no.
Equation (7.18) was derived by analysing a square beam, but the result holds for any self-similar shape, meaning one in which all dimensions remain in proportion as the size is varied. Shaping a given cross-sectional area from a solid square beam into a tube or an I-beam increases the second moment of area, without changing the cross-sectional area or the mass. In Chapter 5, it was shown that this provides greater stiffness with no mass penalty. It also makes the beam stronger. Equation (7.2) shows that a bending moment gives a maximum stress determined by the elastic section modulus, Ze = I/ym. Consequently the gain in strength by increasing I is not quite as great as the gain in stiffness—shaping the section to an I-beam increases I, but usually makes the beam deeper too, increasing ym. As before, we can define a ‘shape factor’ ![]() for strength—the ratio of Ze for the shaped section to Ze for the same area of material in a solid square section:
for strength—the ratio of Ze for the shaped section to Ze for the same area of material in a solid square section:
Recall from Chapter 5 that materials are not all equally easy to shape; if they were, all could be given the same efficient shape and the index in equation (7.18) would be sufficient. Table 7.4 gives typical upper values of the shape factor for strength, for a range of competing materials.
Table 7.4 The effect of shaping on strength and mass of beams in different structural materials
| Material | Maximum failure shape factor (failure moment relative to solid square beam) |
Mass ratio by shaping (relative to solid square beam) |
|---|---|---|
| Steels | 13 | 0.18 |
| Al alloys | 10 | 0.22 |
| Composites | 9 | 0.23 |
| (GFRP, CFRP) | ||
| Wood | 3 | 0.48 |
The right-hand column of Table 7.4 shows the corresponding mass saving we might achieve by shaping and using less material to carry the same load in bending. Metals and composites can all be improved significantly (though again metals do a little better), but wood has more limited potential. So, when comparing materials for light, strong beams using the index in equation (7.18), the performance of wood should not be overestimated; other materials allow more efficient shapes.
Minimising material cost or volume
When the objective is to minimise cost rather than weight, the indices change exactly as before. The objective function for the material cost C of the tie, panel or beam becomes
where Cm is the cost per kg of the material. This leads to indices that are just those of equations (7.16)–(7.18) with ρ replaced by Cmρ.
If instead the objective is to minimise volume, density is no longer relevant. The indices for ties, panels and beams are then the same as those for minimum mass with ρ deleted.
7.4 Case studies
Plasticity problems are of two types. In the first, yield is avoided everywhere so that the entire component remains elastic, meeting the condition σ < σy everywhere. Limited local plastic flow at stress concentrations may be allowed provided that, once it has happened, the condition σ < σy is met everywhere (bedding down). In the second, full plasticity is the aim. Manufacturing processes such as metal forging and extrusion are well-managed plasticity; crash barriers and packaging, too, rely on full plasticity to absorb energy.
First a cautionary note. Carrying loads safely is not just a question of strength, but also of toughness—the resistance of the material to fracture. Strength and toughness are not the same thing—we explain why in the next chapter. For now, it is enough to know that some materials may appear to be good options for strength-limited design, but that they are impractical because they are too brittle in tension or in shock loading.
Corkscrew levers again: strength
The lever of the corkscrew of Figure 5.13 and described in Section 5.5 is loaded in bending. It needs some stiffness, but if it flexes slightly, no great harm is done. If, however, it yields, bending permanently before it extracts the cork, the user will not be happy. So it must also meet a strength constraint.
The cross-section is rectangular. As in Chapter 5 we make the assumption of self-similarity, meaning that we are free to change the scale of the section but not its shape. Then the criterion for selection is that of the index of equation (7.18), Mb = ![]() . The index is plotted in Figure 7.8, isolating materials for light, strong beams. The selection is almost the same as that for stiffness: CFRP, magnesium and aluminum alloys are the best choice.
. The index is plotted in Figure 7.8, isolating materials for light, strong beams. The selection is almost the same as that for stiffness: CFRP, magnesium and aluminum alloys are the best choice.
But what about the stress-concentrating effect at the holes? A stress concentration factor Ksc means that yield starts when the nominal stress exceeds σy/Ksc. Changing the scale of the part does not change Ksc because it depends only on the shape of the defect—the ratio ρ/c (its value for a circular hole is 3, regardless of scale)—with the result that the index remains unchanged and the selection remains valid.
Elastic hinges and couplings
Nature makes much use of elastic hinges: skin, muscle, cartilage all allow large, recoverable deflections. Man, too, designs with flexural and torsional hinges: ligaments that connect or transmit load between components while allowing limited relative movement between them by deflecting elastically (Figures 5.18 and 5.19). Which materials make good hinges?
Consider the hinge for the lid of a box. The box, lid and hinge are to be moulded in one operation—there are no separate screws or pins. The hinge is a thin ligament of material that flexes elastically as the box is closed, as in Figure 5.18, but it carries no significant axial loads. Then the best material is the one that (for given ligament dimensions) bends to the smallest radius without yielding or failing (Table 7.5). When a ligament of thickness t is bent elastically to a radius R, the surface strain is
Table 7.5 Design requirements for elastic hinges
| Function | • Elastic hinge |
| Constraint | • No failure, meaning σ < σy throughout the hinge |
| Objectives | • Maximise elastic flexure |
| Free variables | • Choice of material |

and—since the hinge is elastic—the maximum stress is

This must not exceed the yield or failure strength σy. Thus, the minimum radius to which the ligament can be bent without damage is
The best material is the one that can be bent to the smallest radius—that is, the one with the greatest value of the index

Here we need the σy − E chart (Figure 7.9). Candidates are identified by using the guideline of slope 1; a line is shown at the position M = σy/E = 3 × 10⁻². The best choices for the hinge are all polymeric materials. The short-list includes polyethylene, polypropylene, nylon and, best of all, elastomers, though these may be too flexible for the body of the box itself. Cheap products with this sort of elastic hinge are generally moulded from polyethylene, polypropylene or nylon. Spring steel and other metallic spring materials (like phosphor bronze) are possibilities: they combine usable σy/E with high E, giving flexibility with good positional stability (as in the suspensions of relays).
Materials for springs
Springs come in many shapes (Figure 7.10) and have many purposes: axial springs (a rubber band, for example), leaf springs, helical springs, spiral springs, torsion bars. All depend on storing elastic energy when loaded, releasing it when unloaded again. The stored energy per unit volume in a material carrying a tensile stress σ was derived in Chapter 4—it is given by σ2/2E. If the spring yields it deforms permanently and ceases to fulfill its function, so the maximum value of σ must not exceed σy, when the stored energy is ![]() per unit volume. The best material for a spring of minimum volume (Table 7.6) is therefore that with the greatest value of
per unit volume. The best material for a spring of minimum volume (Table 7.6) is therefore that with the greatest value of
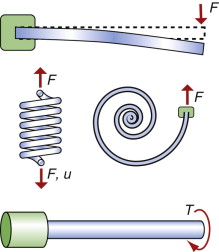
Figure 7.10 Springs: leaf, helical, spiral and torsion bar. Springs store energy. The best material for a spring, regardless of its shape or the way it is loaded, is that of a material with a large value of ![]() .
.
Table 7.6 Design requirements for springs
| Function | • Elastic spring |
| Constraint | • No failure, meaning stress below yield throughout the spring |
| Objectives | • Maximum stored elastic energy per unit volume |
| Free variables | • Choice of material |

Though it is less obvious, the index is the same for leaf springs, torsional spring and coil springs—the best choice for one is the best choice for all.
The choice of materials for springs of minimum volume is shown in Figure 7.9. A family of lines of slope 2 link materials with equal values of ![]() ; those with the highest values of M lie toward the bottom right. The heavy line is one of the family; it is positioned so that a subset of materials is left exposed. The best choices are a high-strength steel lying near the top end of the line. Other materials are suggested too: CFRP (now used for truck springs), titanium alloys (good but expensive) and nylon (children’s toys often have nylon springs), and, of course, elastomers. Note how the procedure has identified a candidate from almost every class of materials: metals, polymers, elastomers and composites.
; those with the highest values of M lie toward the bottom right. The heavy line is one of the family; it is positioned so that a subset of materials is left exposed. The best choices are a high-strength steel lying near the top end of the line. Other materials are suggested too: CFRP (now used for truck springs), titanium alloys (good but expensive) and nylon (children’s toys often have nylon springs), and, of course, elastomers. Note how the procedure has identified a candidate from almost every class of materials: metals, polymers, elastomers and composites.
Full plasticity: metal rolling
Plate, sheet, I-sections and sections like that of railroad track are shaped by rolling. Figure 7.11 shows the rolling of a plate with an initial thickness t0. The plate emerges from the rolls with a lesser thickness t1, a reduction of Δt = t0 − t1. A lower bound for the torque T and power P required to do this is found from the plastic work, σyεpl per unit volume that it takes to produce a plastic strain εpl of Δt/t0. If the rolls rotate through Δθ a length RΔθ (and thus of volume V = RΔθt0 per unit width) is fed into the ‘bite’, where it is compressed to the emerging thickness t1. Equating the work done by the pair of rolls, 2TΔθ, to the plastic work Vσyεpl gives the torque per roll:
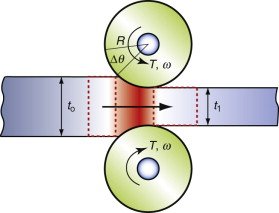
The power P is just the torque times the angular velocity ω radians per second, giving
The torque and power increase with σy so hot rolling takes less power than cold rolling because σy is smaller and work hardening (the increase of yield strength with strain) is negligible.
The values of T and P calculated here are lower bounds. Most metal-working operations involve redundant work (plastic work that is not strictly necessary but happens anyway), friction as the compressed metal expands laterally and speeds up in the gap, sliding against the roll surfaces and work hardening, all of which increase the forces and power that are needed.
Example 7.6
A rolling mill has a pair of rolls of radius 100 mm that rotate at an angular velocity of 0.5 rad/s. A steel strip passes through the rolls and its thickness is reduced from 25 mm to 18 mm. (a) Calculate the nominal plastic strain in the strip. (b) Calculate the power required to drive the rolls if: (i) the steel is at room temperature and (ii) if the steel is at 600 °C. The variation of the yield strength of the steel with temperature is shown below.
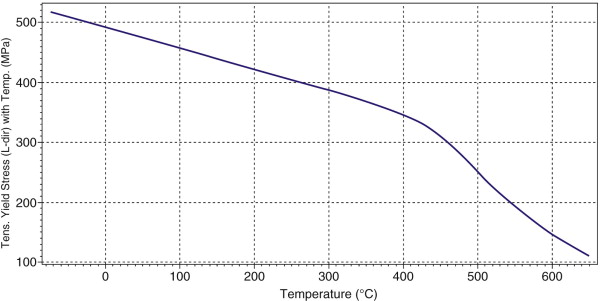
- (a) The plastic strain is Δt/t0 = (25 − 18)/25 = 0.28; that is, 28%.
- (b) (i) From the graph, at room temperature the yield strength of the steel is approximately 480 MPa. So from equation (7.25), the necessary power for cold rolling is at least
- (ii) At 600 °C the yield strength is approximately 150 MPa. The power scales with yield strength, so hot rolling at 600 °C requires a power of at least 50 kW.
7.5 Summary and conclusions
Elastic design is design to avoid yield. That means calculating the maximum stress, σ, in a loaded component and ensuring that it is less than σy, the yield strength. Standard solutions give this maximum stress for panels, beams, torsion bars, spinning disks and many other components in terms of their geometry and the loads applied to them. From these, indices are derived to guide material choice. The indices depend on objectives such as minimising mass or cost, much as they did for stiffness—limited design in Chapter 5.
Sometimes, however, controlled plasticity is the aim. Then the requirement is that the stress must exceed the yield strength over the entire section of the component. Metal-forming operations such as forging, rolling and deep drawing rely on full plasticity. The forces and power they require scale with the yield strength of the material being shaped. Thus, soft metals such as lead, or pure aluminum or low-carbon steel are easy to shape by plastic deformation, but some of the hardest, like tool steels and the nickel-based super-alloys used in gas turbines, have such high yield strengths that they have to be shaped in other ways.
Ashby M.F. Materials Selection in Mechanical Design 3rd ed. 2005 Butterworth-Heinemann Oxford, UK Chapter 4. ISBN 0-7506-6168-2. (Appendix A of this text is an expanded catalog of simple solutions to standard problems.)
Gere J.M. Mechanics of Materials 6th ed. 2006 Thompson Publishing Toronto, Canada ISBN 0-534-41793-0. (An intermediate level text on statics of structures by one of the fathers of the field; his books with Timoshenko introduced an entire generation to the subject.)
Hosford W.F. Mechanical Behavior of Materials 2005 Cambridge University Press Cambridge, UK ISBN 0-521-84670-6. (A text that nicely links stress–strain behaviour to the micromechanics of materials.)
Jenkins C.H.M., Khanna S.K. Mechanics of Materials 2006 Elsevier Academic Boston, MA, USA ISBN 0-12-383852-5. (A simple introduction to mechanics, emphasising design.)
Riley W.F., Sturges L.D., Morris D.H. Statics and Mechanics of Materials 2nd ed. 2003 McGraw-Hill Hoboken, NJ, USA ISBN 0-471-43446-9. (An intermediate level text on the stress, strain and the relationships between them for many modes of loading. No discussion of micromechanics—response of materials to stress at the microscopic level.)
Vable M. Mechanics of Materials 2002 Oxford University Press Oxford, UK ISBN 0-19-513337-4. (An introduction to stress–strain relations, but without discussion of the micromechanics of materials.)
Young W.C. Roark’s Formulas for Stress and Strain 6th ed. 1989 McGraw-Hill New York, USA ISBN 0-07-100373-8. (This is the ‘Yellow Pages’ of formulae for elastic problems—if the solution is not here, it doesn’t exist.)
7.7 Exercises
- Exercise E7.1 What is meant by the elastic section modulus, Ze? A beam carries a bending moment M. In terms of Ze, what is the maximum value M can take without initiating plasticity in the beam?
- Exercise E7.2 Derive the index for selecting materials for a light, strong panel, equation (7.17), following the steps outlined above the equation in the text.
- Exercise E7.3 Derive the index for selecting materials for a light, strong beam with a square cross-section, equation (7.18).
- Exercise E7.4 Derive an index for selecting materials for a panel that meets a constraint on bending strength and is as thin as possible.
- Exercise E7.5 Derive an index for selecting materials for a panel that meets a constraint on bending strength and is as cheap as possible.
- Exercise E7.6 A centrifuge has a rotor that can be idealised as a uniform disk. It has a diameter of 200 mm and is made of a material of strength 450 MPa and density 7900 kg/m3. How fast can it be spun (in radians per second) before the stresses it carries exceed its yield strength?
- Exercise E7.7 A material is sought for a high-speed centrifuge. The objective is to achieve as high an angular velocity ω of the centrifuge disk as possible. The constraint is that the stress created by the centrifugal force must not exceed the yield strength of the material of which it is made. Derive an index to guide the choice of material to allow the maximum ω.
- Exercise E7.8 The engine of a car is mounted on four shear bolts designed to fail in shear in a front-end collision, detaching the engine from the car, if the deceleration exceeds 10 g. Assume that all four bolts carry the same load. The mass of the engine is 80 kg. Because of space limitations, the maximum diameter of each shear bolt cannot exceed 5 mm. (a) Calculate the constraint on the yield strength σy of the material of the shear bolt, assuming that the shear strength is σy/2 and that the mounting is done in such a way that the shear can take place without friction. (b) If, to save weight, the shear bolts have to be as light as possible, what metal (of those identified in the chart of Figure 7.8) would you choose to make them?
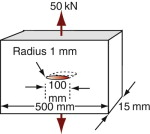
- Exercise E7.9 A plate with a rectangular section 500 mm by 15 mm carries a tensile load of 50 kN. It is made of a ductile metal with a yield strength of 50 MPa. The plate contains an elliptical hole of length 100 mm and a minimum radius of 1 mm, oriented as shown in the diagram. What is:
- Exercise E7.10 Valve springs for high-performance automobile engines must be light to minimise inertial loads since part of their mass moves with the valves; at high engine speeds the valves, if heavy, bounce out of contact with the valve itself (valve bounce), impeding the flow of gas into and out of the combustion chamber. Derive the index for light springs to guide choice for these, remembering that engine temperatures can reach 200 °C.
7.8 Exploring design with CES (use Level 2 unless otherwise indicated)
- Exercise E7.11 Use the Search facility in CES to search for materials that are used for springs. Report what you find.
- Exercise E7.12 Use the Search facility in CES to search for materials that are used for light springs. Report what you find.
- Exercise E7.13 Make a property chart with σy on one axis and E on the other. Use it to select materials for springs, using the index
 derived in the text. Which three metals emerge as the best metallic choices?
 - Exercise E7.14 A material is required for a spring that must be as light as possible. To be stiff enough it must also have a Young’s modulus E > 20 GPa. Make a bar chart with the index
 for selecting light springs derived in Exercise E7.10 (you will need to use the Advanced facility in the axis-choice dialog box to do this). Add a Limit stage to apply the constraint E > 20 GPa. Hence find the two materials that are the best choices for this application.
 - Exercise E7.15 Exercise E7.10 describes the requirements for valve springs for high-performance engines. Apply the index derived there,
 , by making an appropriate chart and plotting an appropriate selection line on it. Engines are hot: add a Limit stage on maximum service temperature of 250 °C. Hence select metals for this application.
 - Exercise E7.16 Abrasives have high hardness, H. Make a bar chart of hardness and identify the four materials with the highest values. They are prime choices for abrasive wheels and pastes.
- Exercise E7.17 The text showed that the power required to roll a metal is proportional to its yield strength. Make a bar chart of yield strength, σy, for metals. Open the record for low-carbon steel, find the range of its yield strength and take the average. Normalise all the yield strengths in the database by dividing them by this value, using the Advanced option in the dialog box for selecting the axes, so that low-carbon steel now lies at the value 1 on the bar chart. Use the chart to read off how much less power is required to roll: (a) commercially pure zinc and (b) commercially pure lead at room temperature.
- Exercise E7.18 Crash barriers, auto fenders and other protective structures rely on absorbing kinetic energy by plastic deformation. The energy Wpl absorbed in deforming a material to fracture (the area under the stress–strain curve) can be estimated approximately in CES as
Make a chart with density on the x-axis and Wpl on the y-axis by using the Advanced facility in the axis-selection dialog box. Use a box selection to find the three materials that absorb the most energy. Rank them by price, using a Graph stage to plot price.
- Exercise E7.19 If the crash barrier of the last exercise is part of a vehicle, fuel is saved if it is light. We then want the materials with the largest value of Wpl/ρ, where ρ is the density. These are found by using a selection line of slope 1 on the chart made in the last exercise and selecting the materials above the line. In this application the materials must also have adequate stiffness so that they do not bend elastically too much, requiring a Young’s modulus of at least 2.5 GPa. Apply this requirement using a Limit stage, return to the chart and move the selection line until only three materials remain. Comment on the choice.
- Exercise E7.20 Now explore what Level 3 of the database can do. Leave all the selection lines and criteria in Exercise E7.19. Go to File > Change Database > CES Edu Level 3 > Open. A dialog box asks if you wish to apply this to your current project. Click Yes. Then list the materials that now appear in the results window. Comment on the choice.
1Heinrich Rudolph Hertz (1821–1894), German physicist, discoverer of radio waves and how to generate them and inventor of the transmitter that started the radio age. In his spare time he dabbled in mechanics.