
Chapter 9 Shake, rattle and roll: Cyclic loading, damage and failure
- 9.1 Introduction and synopsis 188
- 9.2 Vibration and resonance: the damping coefficient 188
- 9.3 Fatigue 189
- 9.4 Charts for endurance limit 197
- 9.5 Drilling down: the origins of damping and fatigue 198
- 9.6 Manipulating resistance to fatigue 200
- 9.7 Summary and conclusions 202
- 9.8 Further reading 202
- 9.9 Exercises 202
- 9.10 Exploring design with CES 204
German engineering was not always what it is today. The rapidly expanding railway system of the mid-19th century was plagued, in Germany and elsewhere, by accidents, many catastrophic, caused by the failure of the axles of the coaches. The engineer August Wöhler1 was drafted in to do something about it. It was his systematic tests that first established the characteristics of what we now call fatigue
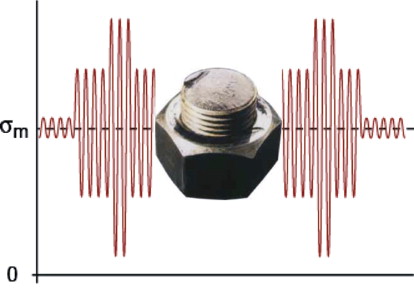
A bolt that has failed by fatigue. The fatigue crack initiated at the root of a thread, which acts as a notch, concentrating stress.
(Image courtesy Bolt Science: www.boltscience.com)
9.1 Introduction and synopsis
German engineering was not always what it is today. The rapidly expanding railway system of the mid-19th century was plagued, in Germany and elsewhere, by accidents, many catastrophic, caused by the failure of the axles of the coaches. The engineer August Wöhler1 was drafted in to do something about it. It was his systematic tests that first established the characteristics of what we now call fatigue.
Repetition is tiring, the cause of many human mistakes and accidents. Materials, too, grow tired if repeatedly stressed, with failure as a consequence. This chapter is about the energy that is dissipated, and the damage and failure that can result, when materials are loaded in a cyclic, repetitive way. Even when the amplitude of the cycles is very small, some energy dissipation or damping occurs. Larger amplitudes cause the slow accumulation of damage, a little on each cycle, until a critical level is reached at which a crack forms. Continued cycling causes the crack to grow until the component suddenly fails. Fatigue failure is insidious—there is little sign that anything is happening until, bang, it does. So when the clip breaks off your pen or your office chair collapses, it is probably fatigue that is responsible (cover picture).
We start with cyclic loading at very small amplitudes and the energy loss or damping that goes with it. We then turn to the accumulation of damage and cracking that is associated with fatigue loading proper.
9.2 Vibration and resonance: the damping coefficient
Bells, traditionally, are made of bronze. They can be (and sometimes are) made of glass, and they could (if you could afford it) be made of silicon carbide. Metals, glasses and ceramics all, under the right circumstances, have low material damping or ‘internal friction’, an important material property when structures vibrate. By contrast, leather, wood (particularly when green or wet) and most foams, elastomers and polymers have high damping, useful when you want to kill vibration.
We are speaking here of elastic response. Until now we have thought of the elastic part of the stress–strain curve as linear and completely reversible so that the elastic energy stored on loading is completely recovered when the load is removed. No material is so perfect—some energy is always lost in a load–unload cycle. If you load just once, you might not notice the loss, but in vibration at, say, acoustic frequencies, the material that is loaded between becomes only too obvious.
The mechanical loss coefficient or damping coefficient, η (a dimensionless quantity), measures the degree to which a material dissipates vibrational energy. If an elastic material is loaded, energy is stored (Chapter 5). If it is unloaded, the energy is returned—it is how springs work. But materials have ways of cheating on this: the amount of energy returned is slightly less. The difference is called the loss coefficient, η. It is the fraction of the stored elastic energy that is not returned on unloading. If you seek materials for bells, you choose those with low η, but if you want to damp vibration, then you choose those with high.
9.3 Fatigue
The problem of fatigue
Low-amplitude vibration causes no permanent damage in materials. Increase the amplitude, however, and the material starts to suffer fatigue. You will, at some time or other, have used fatigue to flex the lid off a sardine can or to break an out-of-date credit card in two. The cyclic stress hardens the material and causes damage in the form of dislocation tangles to accumulate, from which a crack nucleates and grows until it reaches the critical size for fracture. Anything that is repeatedly loaded (like an oil rig loaded by the waves or a pressure vessel that undergoes pressure cycles), or rotates under load (like an axle), or reciprocates under load (like an automobile connecting rod), or vibrates (like the rotor of a helicopter) is a potential candidate for fatigue failure.
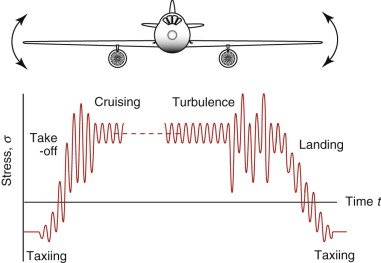
Figure 9.2 shows in a schematic way how the stress on the underside of an aircraft wing might vary during a typical flight, introducing some important practicalities of fatigue. First, the amplitude of the stress varies as the aircraft takes off, cruises at altitude, bumps its way through turbulence and finally lands. Second, on the ground the weight of the engines (and the wings themselves) bends them downward, putting the underside in compression. Once in flight, aerodynamic lift bends them upward, putting the underside in tension. The amplitude of the stress cycles and their mean values change during flight. Fatigue failure depends on both. And of course it depends on the total number of cycles. Aircraft wings bend to and fro at a frequency of a few hertz. In a trans-Atlantic flight, tens of thousands of loading cycles take place; in the lifetime of the aircraft, it is millions. For this reason, fatigue testing needs to apply tens of millions of fatigue cycles to provide meaningful design data.
The food can and credit card are examples of low-cycle fatigue, meaning that the component survives for only a small number of cycles. It is typical of cycling at stresses above the yield stress, σy, like that shown in Figure 9.1(c). More significant in engineering terms is high-cycle fatigue: here the stresses remain generally elastic and may be well below σy, as in cycle (b) of Figure 9.1; cracks nonetheless develop and cause failure, albeit taking many more cycles to do so, as in Wöhler’s railway axles.
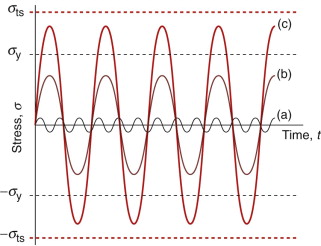
Figure 9.1 Cyclic loading. (a) Very low amplitude acoustic vibration. (b) High-cycle fatigue: cycling well below general yield, σy. (c) Low-cycle fatigue: cycling above general yield (but below the tensile strength σts).
In both cases we are dealing with components that are initially undamaged, containing no cracks. In these cases, most of the fatigue life is spent generating the crack. Its growth to failure occurs only at the end. We call this initiation-controlled fatigue. Some structures contain cracks right from the word go, or are so safety-critical (like aircraft) that they are assumed to have small cracks. There is then no initiation stage—the crack is already there—and the fatigue life is propagation controlled, that is, it depends on the rate at which the crack grows. A different approach to design is then called for—we return to this later.
High-cycle fatigue and the S–N curve
Figure 9.3 shows how fatigue characteristics are measured and plotted. A sample is cyclically stressed with amplitude Δσ/2 about a mean value σm, and the number of cycles to cause fracture is recorded. The data are presented as Δσ − Nf (’S–N’) curves, where Δσ is the peak-to-peak range over which the stress varies and Nf is the number of cycles to failure. Most tests use a sinusoidally varying stress with an amplitude σa of
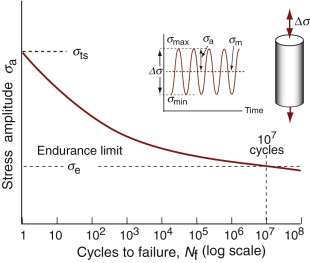
and a mean stress σm of
all defined in the figure. Fatigue data are usually reported for a specified R-value:

An R-value of −1 means that the mean stress is zero; an R-value of 0 means the stress cycles from 0 to σmax. For many materials there exists a fatigue or endurance limit, σe (units: MPa). It is the stress amplitude σa, about zero mean stress, below which fracture does not occur at all, or occurs only after a very large number (Nf > 107) of cycles. Design against high-cycle fatigue is therefore very similar to strength-limited design, but with the maximum stresses limited by the endurance limit σe rather than the yield stress σy.
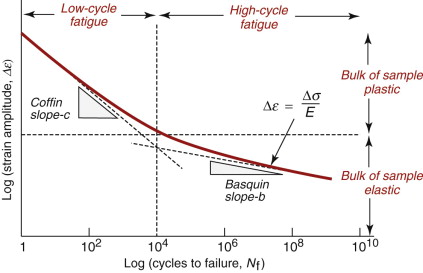
Experiments show that the high-cycle fatigue life is approximately related to the stress range by what is called Basquin’s law:
where b and C1 are constants; the value of b is small, typically 0.07 and 0.13. Dividing Δσ by the modulus E gives the strain range Δε (since the sample is elastic):
or, taking logs,
This is plotted in Figure 9.4, giving the right-hand, high-cycle fatigue part of the curve with a slope of 2b.
Example 9.1
The fatigue life of a component obeys Basquin’s law, equation (9.4), with b = 0.1. The component is loaded cyclically with a sinusoidal stress of amplitude 100 MPa (stress range of 200 MPa) with zero mean, and has a fatigue life of 200 000 cycles. What will be the fatigue life if the stress amplitude is increased to 120 MPa (stress range = 240 MPa)?
Answer. From equation (9.4), ![]() , consequently
, consequently
This is an 84% reduction in fatigue life for a 20% increase in stress amplitude. Fatigue is very sensitive to stress level.
Low-cycle fatigue
In low-cycle fatigue the peak stress exceeds yield, so at least initially (before work hardening raises the strength), the entire sample is plastic. Basquin is no help to us here; we need another empirical law, this time that of Dr Lou Coffin:
where Δεpl means the plastic strain range—the total strain minus the (usually small) elastic part. For our purposes we can neglect that distinction and plot it in Figure 9.4 as well, giving the left-hand branch. Coffin’s exponent, c, is much larger than Basquin’s; typically it is 0.5.
High-Cycle fatigue: mean stress and variable amplitude
These laws adequately describe the fatigue failure of uncracked components cycled at constant amplitude about a mean stress of zero. But as we saw, real loading histories are often much more complicated (Figure 9.2). How do we make some allowance for variations in mean stress and stress range? Here we need yet more empirical laws, courtesy this time of Goodman and Miner. Goodman’s rule relates the stress range ![]() for failure under a mean stress σm to that for failure at zero mean stress
for failure under a mean stress σm to that for failure at zero mean stress ![]() :
:
where σts is the tensile stress, giving a correction to the stress range. Increasing σm causes a small stress range ![]() to be as damaging as a larger
to be as damaging as a larger ![]() applied with zero mean (Figure 9.5(a)). The corrected stress range may then be plugged into Basquin’s law.
applied with zero mean (Figure 9.5(a)). The corrected stress range may then be plugged into Basquin’s law.
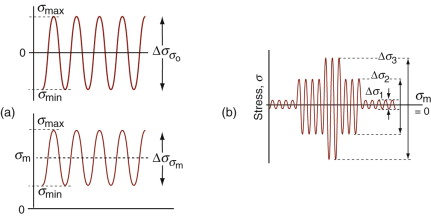
Figure 9.5 (a) The endurance limit refers to a zero mean stress. Goodman’s law scales of the stress range to a mean stress σm. (b) When the cyclic stress amplitude changes, the life is calculated using Miner’s cumulative damage rule.
Example 9.2
The component in Example 9.1 is made of a material with a tensile strength σts = 200 MPa. If the mean stress is 50 MPa (instead of zero), and the stress amplitude is 100 MPa, what is the new fatigue life?
Answer. Using Goodman’s rule, equation (9.7), the equivalent stress amplitude for zero mean stress is:
So, following the approach in Example 9.1, Basquin’s law gives the new fatigue life to be
The variable amplitude problem can be addressed approximately with Miner’s rule of cumulative damage. Figure 9.5(b) shows an idealised loading history with three stress amplitudes (all about zero mean). Basquin’s law gives the number of cycles to failure if each amplitude was maintained throughout the life of the component. So if N1 cycles are spent at stress amplitude Δσ1 a fraction N1/Nf1 of the available life is used up, where Nf1 is the number of cycles to failure at that stress amplitude. Miner’s rule assumes that damage accumulates in this way at each level of stress. Then failure will occur when the sum of the damage fractions reaches 1—that is, when
Example 9.3
The component in Examples 9.1 and 9.2 is loaded for N1 = 5 000 cycles with a mean stress of 50 MPa and a stress amplitude of 100 MPa (as per Example 9.2). It is then cycled about zero mean for N2 cycles with the same stress amplitude (as per Example 9.1) until it breaks. Use Miner’s rule, equation (9.8), to determine N2.
Answer. From equation (9.8)
So ![]() . Approximately half of the fatigue life is used up at each load level.
. Approximately half of the fatigue life is used up at each load level.
Goodman’s law and Miner’s rule are adequate for preliminary design, but they are approximate; in safety-critical applications, tests replicating service conditions are essential. It is for this reason that new models of cars and trucks are driven over rough ‘durability tracks’ until they fail—it is a test of fatigue performance.
The discussion so far has focused on initiation-controlled fatigue failure of uncracked components. Now it is time to look at those containing cracks.
Fatigue loading of cracked components
In fabricating large structures like bridges, ships, oilrigs, pressure vessels and steam turbines, cracks and other flaws cannot be avoided. Cracks in castings appear because of differential shrinkage during solidification and entrapment of oxide and other inclusions. Welding, a cheap, widely used joining process, can introduce both cracks and internal stresses caused by the intense local heating. If the cracks are sufficiently large that they can be found it may be possible to repair them, but finding them is the problem. All nondestructive testing (NDT) methods for detecting cracks have a resolution limit; they cannot tell us that there are no cracks, only that there are none longer than the resolution limit, clim. Thus, it is necessary to assume an initial crack exists and design the structure to survive a given number of loadings. So how is the propagation of a fatigue crack characterised?
Fatigue crack growth is studied by cyclically loading specimens containing a sharp crack of length c like that shown in Figure 9.6. We define the cyclic stress intensity range, ΔK, using equation (8.4), as
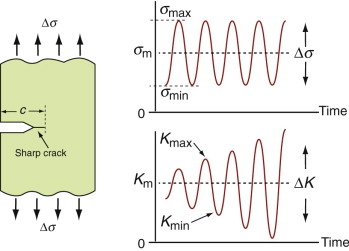
Figure 9.6 Cyclic loading of a cracked component. A constant stress amplitude Ds gives an increasing amplitude of stress intensity, ![]() as the crack grows in length.
as the crack grows in length.
The range ΔK increases with time under constant cyclic stress because the crack grows in length: the growth per cycle, dc/dN, increases with ΔK in the way shown in Figure 9.7. The rate is zero below a threshold cyclic stress intensity ΔKth, useful if you want to make sure it does not grow at all. Above it, there is a steady-state regime described by the Paris law:
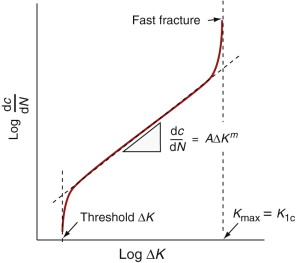
where K and m are constants. At high ΔK the growth rate accelerates as the maximum applied K approaches the fracture toughness K1c. When it reaches K1c the sample fails in a single load cycle.
Safe design against fatigue failure in potentially cracked components means calculating the number of loading cycles that can safely be applied without the crack growing to a dangerous length. We return to this in Chapter 10.
Example 9.4
The polystyrene ruler in Example 8.1 is to be loaded as a cantilever with a cyclic force that varies from 0 to 10 N. (a) What depth of transverse crack is needed at the base of the cantilever for fast fracture to occur when the end force is 10 N? (b) If the ruler has an initial transverse scratch of depth ci = 0.1 mm, how many cycles of the force will it take before the ruler breaks? The Paris law constants in equation (9.10) are m = 4 and A = 5 × 10⁻⁶ when Δσ is in MPa. (Assume that the scratch is shallow so that the stress at the crack tip is the same as the stress at the extreme fibre of the beam.)
Answer. (a) The stress in the extreme fibre of the bending beam is given by equation (7.1)
From equation (8.4), the critical crack length (depth) at fast fracture is
(b) From equation (9.10), the range of stress intensity factor is ![]() , where Δσ = σmax − σmin. In this case, Δσ = σmax because σmin = 0. The crack starts at length ci and grows steadily according to the Paris law (9.11) dc/dN = AΔKm, until it reaches the critical length c*, when the ruler breaks.
, where Δσ = σmax − σmin. In this case, Δσ = σmax because σmin = 0. The crack starts at length ci and grows steadily according to the Paris law (9.11) dc/dN = AΔKm, until it reaches the critical length c*, when the ruler breaks.
Combining equations (9.10) and (9.11) gives:
from which ![]() where Nf is the number of cycles to failure. Integrating this gives:
where Nf is the number of cycles to failure. Integrating this gives:
9.4 Charts for endurance limit
The most important single property characterising fatigue strength is the endurance limit, σe, at 107 cycles and zero mean stress (an R-value of −1). Given this and the ability to scale it to correct for mean stress, and sum contributions when stress amplitude changes (equations (9.7) and (9.8)), enables design to cope with high-cycle fatigue.
Not surprisingly endurance limit and strength are related. The strongest correlation is with the tensile strength σts, shown in the chart of Figure 9.8. The data for metals and polymers cluster around the line
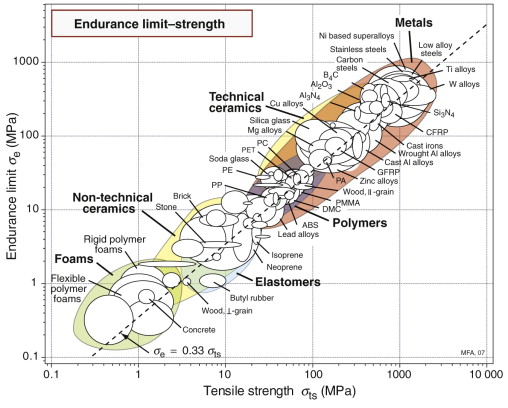
Figure 9.8 The endurance limit plotted against the tensile strength. Almost all materials fail in fatigue at stresses well below the tensile strength.
shown on the chart. For ceramics and glasses
In the next section we examine why.
9.5 Drilling down: the origins of damping and fatigue
Material damping: the mechanical loss coefficient
There are many mechanisms of material damping. Some are associated with a process that has a specific time constant; then the energy loss is centred about a characteristic frequency. Others are frequency independent; they absorb energy at all frequencies. In metals a large part of the loss is caused by small-scale dislocation movement: it is high in soft metals like lead and pure aluminum. Heavily alloyed metals like bronze and high-carbon steels have low loss because the solute pins the dislocations; these are the materials for bells. Exceptionally high loss is found in some cast irons, in manganese–copper alloys and in magnesium, making them useful as materials to dampen vibration in machine tools and test rigs. Engineering ceramics have low damping because the dislocations in them are immobilised by the high lattice resistance (which is why they are hard). Porous ceramics, on the other hand, are filled with cracks, the surfaces of which rub, dissipating energy, when the material is loaded. In polymers, chain segments slide against each other when loaded; the relative motion dissipates energy. The ease with which they slide depends on the ratio of the temperature T to the glass temperature, Tg, of the polymer. When T/Tg < 1, the secondary bonds are ‘frozen’, the modulus is high and the damping is relatively low. When T/Tg > 1, the secondary bonds have melted, allowing easy chain slippage; the modulus is low and the damping is high.
Fatigue damage and cracking
A perfectly smooth sample with no changes of section, and containing no inclusions, holes or cracks, would be immune to fatigue provided neither σmax nor σmin exceeds its yield strength. But that is a vision of perfection that is unachievable. Blemishes, small as they are, can be deadly. Rivet holes, sharp changes in section, threads, notches and even surface roughness concentrate stress in the way described in Chapter 7, Figure 7.7. Even though the general stress levels are below yield, the locally magnified stresses can lead to reversing plastic deformation. Dislocation motion is limited to a small volume near the stress concentration, but that is enough to cause damage that finally develops into a tiny crack.
In high-cycle fatigue, once a crack is present it propagates in the way shown in Figure 9.9(a). During the tensile part of a cycle a tiny plastic zone forms at the crack tip, stretching it open and thereby creating a new surface. On the compressive part of the cycle the crack closes again and the newly formed surface folds forward, advancing the crack. Repeated cycles make it inch forward, leaving tiny ripples on the crack face marking its position on each cycle. These ‘striations’ are characteristic of a fatigue failure and are useful, in a forensic sense, for revealing where the crack started and how fast it propagated.
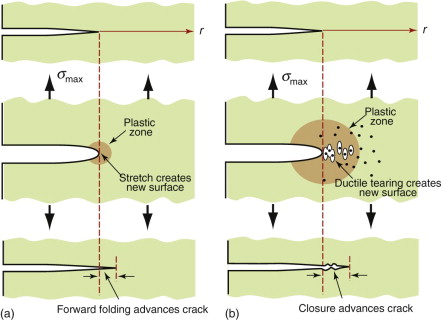
Figure 9.9 (a) In high-cycle fatigue a tiny zone of plasticity forms at the crack tip on each tension cycle; on compression the newly formed surface folds forward. (b) In low-cycle fatigue the plastic zone is large enough for voids to nucleate and grow within it. Their coalescence further advances the crack.
In low-cycle fatigue the stresses are higher and the plastic zone larger, as in Figure 9.9(b). It may be so large that the entire sample is plastic, as it is when you flex the lid of a tin to make it break off. The largest strains are at the crack tip, where plasticity now causes voids to nucleate, grow and link, just as in ductile fracture (Chapter 8).
9.6 Manipulating resistance to fatigue
Fatigue life is enhanced by choosing materials that are strong, making sure they contain as few defects as possible, and by giving them a surface layer in which the internal stresses are compressive.
Choosing materials that are strong
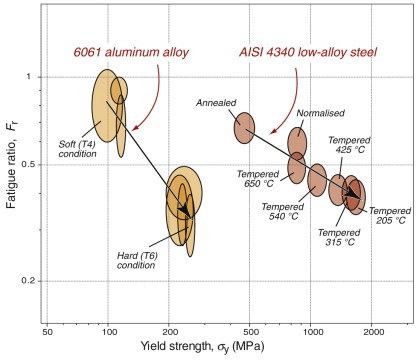
The chart of Figure 9.8 established the close connection between endurance limit and tensile strength. Most design is based not on tensile strength but on yield strength, and here the correlation is less strong. We define the fatigue ratio, Fr, as
Figure 9.10 shows data for Fr for an age-hardening aluminum alloy and a low alloy steel. Both can be heat-treated to increase their yield strength, and higher strength invites higher design stresses. The figure, however, shows that the fatigue ratio Fr falls as strength σy increases, meaning that the gain in endurance limit is considerably less than that in yield strength. In propagation-controlled fatigue, too, the combination of higher stress and lower fracture toughness implies that smaller crack sizes will propagate, causing failure (and the resolution of inspection techniques may not be up to the job).
Making sure they contain as few defects as possible
Mention has already been made of clean alloys—alloys with carefully controlled compositions that are filtered when liquid to remove unwanted particles that, in the solid, can nucleate fatigue cracks. Nondestructive testing using X-ray imaging or ultrasonic sensing detects dangerous defects, allowing the part to be rejected. And certain secondary processes like hot isostatic pressing (HIPing), which heats the component under a large hydrostatic pressure of inert argon gas, can seal cracks and collapse porosity.
Providing a compressive surface stress
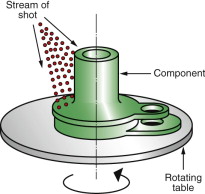
Cracks only propagate during the tensile part of a stress cycle; a compressive stress forces the crack faces together, clamping it shut. Fatigue cracks frequently start from the surface, so if a thin surface layer can be given an internal stress that is compressive, any crack starting there will remain closed even when the average stress across the entire section is tensile. This is achieved by treatments that plastically compress the surface by shot peening (Figure 9.11): leaf-springs for cars and trucks are ‘stress peened’, meaning that they are bent to a large deflection and then treated in the way shown in the figure; this increases their fatigue life by a factor of 5. A similar outcome is achieved by sandblasting or burnishing (local deformation with a smooth, polished tool), or diffusing atoms into the surface, expanding a thin layer, which, because it is bonded to the more massive interior, becomes compressed.
9.7 Summary and conclusions
Static structures like the Eiffel Tower or the Golden Gate Bridge stand for centuries; those that move have a much shorter life span. One reason for this is that materials are better at supporting static loads than loads that fluctuate. The long-term cyclic load a material can tolerate, σe, is barely one-third of its tensile strength, σts. This sensitivity to cyclic loading—fatigue—was unknown until the mid-19th century, when a series of major industrial disasters made it the subject of intense study.
Empirical rules describing fatigue failure and studies of the underlying mechanisms have made fatigue failures less common, but they still happen, notably in rail track, rolling stock, engines and airframes. It is now known that cycling causes damage that slowly accumulates until a crack nucleates, grows slowly and suddenly runs unstably. This is pernicious behavior: the cracks are almost invisible until final failure occurs without warning.
The rules and data for their empirical constants, described in this chapter, give a basis for design to avoid fatigue failure. The scientific studies provide insight that guides the development of materials with greater resistance to fatigue failure. Surface treatments to inhibit crack formation are now standard practice. We return to these in the next chapter, in which the focus is on design issues.
Hertzberg R.W. Deformation and Fracture of Engineering Materials 3rd ed. 1989 Wiley New York, USA ISBN 0-471-63589-8. (A readable and detailed coverage of deformation, fracture and fatigue.)
Suresh S. Fatigue of Materials 2nd ed. 1998 Cambridge University Press Cambridge, UK ISBN 0-521-57847-7. (The place to start for an authoritative introduction to the materials science of fatigue in both ductile and brittle materials.)
Tada H., Paris G., Irwin G.R. The Stress Analysis of Cracks Handbook 3rd ed. 2000 ISBN 1-86058-304-0. (Here we have another ‘Yellow Pages’, like Roark for stress analysis of uncracked bodies—this time of stress intensity factors for a great range of geometries and modes of loading.)
9.9 Exercises
- Exercise E9.1 What is meant by the mechanical loss coefficient, η, of a material? Give examples of designs in which it would play a role as a design-limiting property.
- Exercise E9.2 What is meant by the endurance limit, σe, of a material?
- Exercise E9.3 What is the fatigue ratio? If the tensile strength σts of an alloy is 900 MPa, what, roughly, would you expect its endurance limit σe to be?
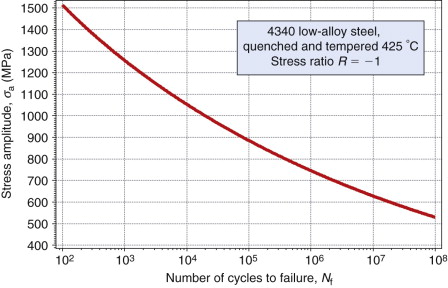
- Exercise E9.4 The figure shows an S–N curve for AISI 4340 steel, hardened to a tensile strength of 1800 MPa.
- What is the endurance limit?
- If cycled for 100 cycles at an amplitude of 1200 MPa and a zero mean stress, will it fail?
- If cycled for 100 000 cycles at an amplitude of 900 MPa and zero mean stress, will it fail?
- If cycled for 100 000 cycles at an amplitude of 800 MPa and a mean stress of 300 MPa, will it fail?
- Exercise E9.5 The high-cycle fatigue life, Nf, of an aluminum alloy is described by Basquin’s law:
(stress in MPa). How many cycles will the material tolerate at a stress amplitude σa of ±70 MPa and zero mean stress? How will this change if the mean stress is 10 MPa? What if the mean stress is −10 MPa?
- Exercise E9.6 The low-cycle fatigue of an aluminum alloy is described by Coffin’s law:
(stress in MPa). How many cycles will the material tolerate at a stress amplitude σa of ±100 MPa?
- Exercise E9.7 A material with a tensile stress σts = 350 MPa is loaded cyclically about a mean stress of 70 MPa. If the stress range that will cause fatigue fracture in 105 cycles under zero mean stress is ±60 MPa, what stress range about the mean of 70 MPa will give the same life?
- Exercise E9.8 A component made of the AISI 4340 steel with a tensile strength of 1800 MPa and the S–N curve shown in Exercise E9.4 is loaded cyclically between 0 and 1200 MPa. What is the R-value and the mean stress, σm? Use Goodman’s rule to find the equivalent stress amplitude for an R-value of −1, and read off the fatigue life from the S–N curve.
- Exercise E9.9 A material has a threshold cyclic stress intensity ΔKth of 2.5 MPa · m1/2. If it contains an internal crack of length 1 mm will it be safe (meaning, no failure) if subjected to continuous cyclic range of tensile stress Δσ of 50 MPa?
9.10 Exploring design with CES
- Exercise E9.10 Make a bar chart of mechanical loss coefficient, η. Low loss materials are used for vibrating systems where damping is to be minimised—bells, high-frequency relays and resonant systems. High loss materials are used when damping is desired—sound deadening cladding for buildings, cars and machinery, for instance. Use the chart to find:
- Exercise E9.11 Use the ‘Search’ facility to search materials that are used for:
- Exercise E9.12 Use a ‘Limit’ stage, applied to the Surface treatment data table, to find surface treatment processes that enhance fatigue resistance. To do this:
- Exercise E9.13 Explore the relationship between fatigue ratio and strength for a heat-treatable low alloy steel AISI 4340. The endurance limit σe is stored in the database under the heading ‘Fatigue strength at 107 cycles’.
Use Level 3 of the database, apply a ‘Tree’ stage to isolate the folder for the low alloy steel, AISI 4340, then make the two charts, hiding all the other materials. How do you explain the trends?
1August Wöhler (1819–1914), German engineer, and from 1854 to 1889 Director of the Prussian Imperial Railways. It was Wöhler’s systematic studies of metal fatigue that first gave insight into design methods to prevent it.