5.1 INTRODUCTION
When the ancient Greeks went into the forecourt of the temple of Apollo at Delphi they would read the aphorism “Know thyself” inscribed on the wall. This maxim likely derives from an Egyptian proverb, which called on initiates to prove their worth so that they could acquire higher knowledge (“Man, know thyself … and thou shalt know the gods”).
In the dialogue Philebus, Plato argues that gaining more knowledge of ourselves would lead us to a greater understanding of the nature of human beings. Gods and human beings are beyond the scope of this analysis but, focusing on the financial sector, it is obvious that knowing our own financial institution better is a prerequisite to being better equipped to cope with the liquidity risk associated with it.
As argued in the previous chapter, the main contribution provided by the new international regulatory framework on liquidity risk is not the two binding ratios, which are a simple combination and evolution of existing liquidity measures already used by the industry, but the comprehensive development of sound management and supervision practices about liquidity risk. This moves away from the definition of specific liquidity risk tolerance, defined by top management according to their business strategy, and calls for an articulate system of risk management, product pricing, performance measurement to warrant full consistency between risk-taking incentives for business lines and the related liquidity risk exposures for the bank as a whole.
In this framework early-warning signals, what-if analyses and internal stress test scenarios are crucial and have to be tailor-made on the basis of the risks of the business model: each bank is therefore called to analyse in detail its own business in order to identify and to face as properly as possible the worst (or a combination of) liquidity stressed scenarios and survive them by making the impact on ongoing business as small as possible.
5.2 SOME CHANGES ON THE LIABILITIES SIDE
It has already been pointed out, liquidity risk lies at the heart of traditional banking activity where banks do their business by performing maturity transformation to fund less liquid long-term assets with more liquid short-term liabilities. By doing their traditional financial intermediation, commercial banks play a pivotal role in the real economy and mitigate some negative effects related to several market failures, such as incomplete markets or asymmetric information. They facilitate payments and the smooth transfer of goods and services. They match savers who may lack detailed knowledge of borrowers and who usually want to be able to withdraw their money at short notice with borrowers who often wish to repay their loans over a longer term horizon, according to the returns of their investment projects. This maturity transformation is essentially addressed to allow capital to be invested in a productive way in order to support economic growth.
The key factor to success with this activity is to manage carefully the liabilities side of the balance sheet, according to the different degree of monetization of the assets: the less liquid the asset side of the balance sheet, the more stable the funding sources have to be, such as savings or retail deposits, or medium/long-term wholesale funding. A stable funding source is a prerequisite to carrying out maturity transformation over time, because it has to be rolled out in the short term in order to fund the less liquid and longer term asset that has an economic positive return.
Unfortunately, in the financial world nothing remains the same for very long: business models based on very liquid funding sources, such as the unsecured money market in the last two decades, did not perform as expected in the 2000s financial environment [37]. In the 1980s and early 1990s commercial banks played a central role in financial systems, acting as a redistribution function of liquidity, because they had a quasi-monopoly on the collection of deposits. The US fund industry was still developing, in Europe and Japan money market funds did not yet exist, and households were left with no choice but to hold their balances with commercial banks. With high segmentation between the traditional peer-to-peer interbank market and other financial segments, the resources collected by financial institutions and pension funds did not necessarily find their way onto the broader capital market. Moreover, security issuance as a funding instrument was less important and asset-backed repos were used only anecdotally in the interbank market by trading desks to cover their short exposure, but not for liquidity management purposes. This was a typical bank-centric financial system, where commercial banks collected money from other players such as central banks, private customers andfirms.
In the second part of the 1990s the bank-centric system was quickly over. The disintermediation of the money market led to substantial changes in commercial banks' liability mixes: security issuances and securitized funding had to compensate the reduction of interbank unsecured liabilities and of sight/term customer deposits.
Three main factors had significantly altered the distribution of liquidity in the interbank market and its very functioning: the mainstreaming of the fund management industry, the advent of repo operations and the entry of new players like pension funds and insurance companies. Money funds and pension funds are now collectors of private savings in competition with the banking system: in many cases they had replaced banks in their function of collecting money from the private sector, by de facto reducing the total liquidity pool of the interbank unsecured money market.
As a consequence, banks had to deeply reorganize their funding channels. As customer savings shifted towards the fund management industry, banks started to borrow from money market funds in the wholesale market using different instruments (CD/CP issuance and repo operations among others). Obviously, this substitution was not painless for them, because they replaced stable funding with more volatile sources. Over time this kind of funding gradually overtook the traditional funding model of deposits from rich banks using long cash positions to place funds with interbank counterparties.
The significant reduction in the percentage of interbank unsecured funding recorded over the last decade pushed banks to optimize monetization of the asset side of their balance sheets, starting from the more liquid securities with an active repo market. For instance, data from the French Banking Commission, collected in 2006 (i.e., before the start of the financial crisis that deadlocked the unsecured money market), already recorded a significant shift in the composition of banks' liabilities: the share of French interbank liabilities was equal to 22% in 2006 down from 39% in 1990. Nowadays, market-related funding of banks is essentially securitized or security related, with a negligible contribution from the unsecured interbank channel: this has obviously increased market funding liquidity embedded within the bank's balance sheet.
This relative decline in interbank transactions versus other liabilities was accompanied by a gradual shift of the traded volume towards the very short term. This phenomenon was strictly related to two different factors.
First, back-office and trading system automation allowed a greater number of transactions to be carried out per day so that the material burden of rolling over many ON and TN operations ceased to be an issue. This led to impressive activity on the very short-term tenors of the repo market, which allow banks to roll over their position on a daily basis with lower costs, not by reducing the risk premium embedded in the interest rate term structure, but by increasing the dependence on market liquidity.
Second, the increased importance of regulatory capital adequacy constraints dramatically shortened the potential horizon of unsecured interbank operations, such as treasurers witness at every end of quarter. Since treasurers reduced the term of their interbank loans, while still being willing to borrow unsuccessfully at longer term maturity, they set in motion a self-fulfilling mechanism that gradually hollowed tenors beyond 1 month, making it almost impossible to raise significant amounts for longer terms.
Figures 5.1 to 5.4 show some aggregate data from the ECB's 2012 Euro Money Market Survey (see [18]), conducted on 105 active banks in the euro money market: average daily volumes on both the unsecured lending and borrowing sides are lowering year by year versus substantial constant figures for secured funding, with a strong concentration of unsecured transactions on overnight tenor.
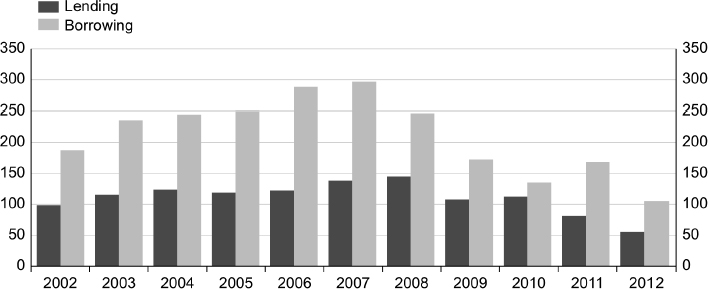
Figure 5.1. Average daily turnover in unsecured lending and borrowing (index cash lending volume in 2002 = 100)
Source: ECB's Euro Money Market Survey (2012) [18]
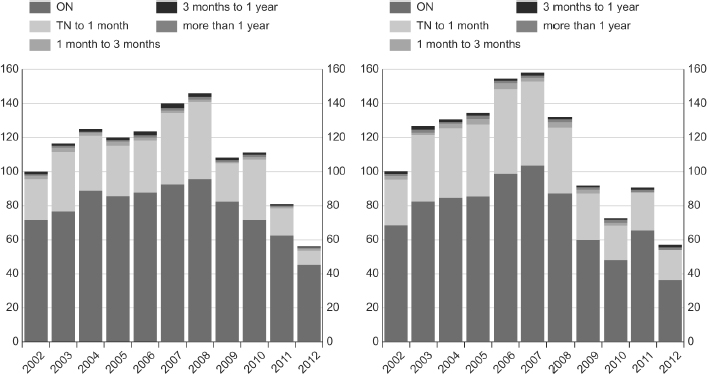
Figure 5.2. Maturity breakdown for average daily turnover in unsecured lending (left-hand side) and borrowing (right-hand side) (index cash lending volume in 2002 = 100)
Source: ECB's Euro Money Market Survey (2012) [18]
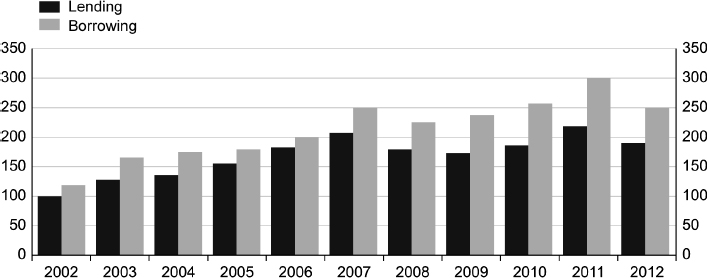
Figure 5.3. Average daily turnover in secured lending and borrowing (index cash lending volume in 2002 = 100)
Source: ECB's Euro Money Market Survey (2012) [18]
To sum up, the current state of the money market is characterized by three key features: (a) interbank operations in the narrow sense (peer-to-peer) now represent a much smaller share of banks' market-related funding than in the past; (b) banks' market funding is now more reliant on banks' access to several segments of the repo market, securitized funding, or on how they raise funds by means of non-banking entities (money market funds, insurance companies and pension funds through repos or CD/CP subscriptions), which have become actual significant lenders in the money market; and, last but not least, for the consequences on the derivative products, (c) Libor/Euribor quotations now represent only a remote proxy of their overall funding costs.
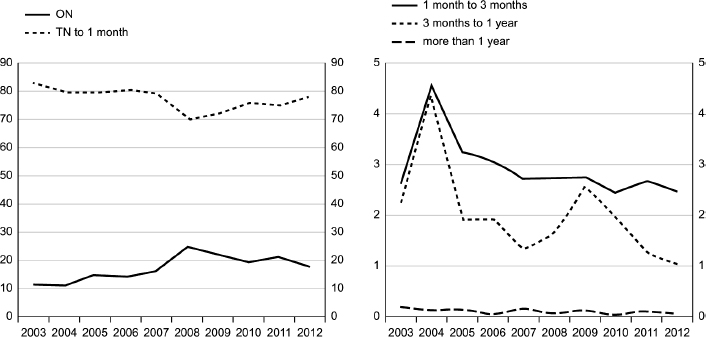
Figure 5.4. Maturity breakdown for average daily turnover in secured lending and borrowing
Source: ECB's Euro Money Market Survey (2012) [18]
5.3 THE ROLE OF LEVERAGE
Use of the repo market as the main source to fund the marketable asset side of the balance sheet has produced an interesting effect on how banks adjust the ratio known as “leverage” (i.e., the ratio of total assets to equity or net worth in response to any variation in the value of their balance sheet assets [1]).
As liabilities are more volatile than assets, commercial banks used to increase their liabilities more than they increased their assets during booms; they do the reverse during downturns. Thus, the overall book leverage of commercial banks, calculated as the value of the total assets divided by the value of total equity (where equity is calculated as assets minus liabilities) tends to rise during booms and to fall during downturns, showing a procyclical pattern.
It is interesting to note that for commercial banks a large proportion of assets are represented by loans carried in the financial accounts at book value rather than being adjusted for the fluctuations in value that arise from changes in market and credit risk over the cycle. This feature is not replicated in the financial account of security brokers and dealers, or that of investment banks generally, whose assets are securities, receivables or claims that are either marketable or very short term in nature: thus, the discrepancy between book and market values is smaller for investment banks than for commercial ones.
As shown in [2] there is a strongly positive relationship between leverage and the total assets of investment banks. This result can be reached only if investment banks actively respond to a rise in asset value by expanding their balance sheets because, ceteris paribus, a rise in the value of total assets would boost equity as a proportion of total assets, leading instead to a decline in leverage. The instrument used by investment banks to expand their balance sheets is collateralized borrowing or, more precisely, repos: they allow securities on the asset side of the balance sheet to be funded at a higher market value, by increasing the funding amount to be invested in other assets with respect to the initial purchase value.
Box 5.1. The Libor review: mission impossible?
Both Libor and Euribor are benchmark rates widely used as reference indexes in international money markets and for derivative products [76]. The former is published by the British Bankers' Association (BBA) for a given number of currencies, the latter by the European Banking Federation (EBF) for the euro. They are set by assessments of the interbank market made by a number of banks, which contribute rate submissions each business day as panel members selected by the BBA and EBF.
These submissions do not represent averages of the relevant banks' transacted rates on a given day (as occurred for Eonia); rather, both indexes require contributing banks to exercise their subjective judgement in evaluating the rates at which money may be available in the interbank market in determining their submissions.
The nature of the judgement required differs for the two rates: Libor is defined by the BBA as “the rate at which an individual contributor panel bank could borrow funds, were it to do so by asking for and then accepting interbank offers in reasonable market size just prior to 11:00 London time”; Euribor is defined as “the rate at which euro interbank term deposits are being offered within the EMU zone by one prime bank to another at 11:00 AM Brussels time” [10]. Hence, banks quoting Libor submissions are passing on information about themselves, while for Euribor they are called to forecast the funding level of a theoretical prime bank.
Over the last five years the persistent and severe discontinuation of deposit trading eroded the incentives or the ability for market participants to price fixings correctly hence implying the indexes were doomed to lose their physical anchor to the underlying market and become more notional references. In such cases, as a large number of rates applied to retail and corporate customers are indexed on these fixings, any mispricing would automatically be translated in rates applied to the real economy. Moreover, derivatives cash-settled on these fixings (like Liffe Euribor or CME eurodollar futures) could be subject to disanchored evolution, with an arbitrage relationship that no longer works: the effects of these “virtual” rates, detached from reality, could be dramatic for trillions of derivative products written on such references.
The financial crisis eventually put under scrutiny the effectiveness of such references for a dying interbank market, but the coup de grâce for this instable construction was struck by widespread suspicions that Libor/Euribor rates were being rigged, initially driven by greed and later used to downplay the intensity of funding stress on the banking system, and by a lot of evidence showing attempts to game the benchmark by the contributing banks.
The fixing system was definitely broken and had to be refixed. The Wheatley Review in September 2012 suggested reducing Libor fixings to only five currencies (GBP, EUR, JPY, CHF and USD), with minor tenors scrapped and quotations not only always verifiable, but also reflective of actual transactions and real-life bank borrowing costs [43]. This approach aims at phasing out the Libor system without generating any significant market disruption related to the switch to a new benchmark, but obviously it is not able to address the main problem: if the interbank money market dries up again or simply does not restart at a size that is significant there is no means to verify the quality of the quotations.
Sooner or later market participants will be forced to find some new benchmark to succeed Libor/Euribor. One candidate is the OIS rate, quoted on the same tenors required for Libor/Euribor: the reference rate for OIS is the only unsecured money market index calculated on actual transactions (i.e., the ON index which is based on Eonia, Fed Fund Effective Rate, Sonia, etc.). This feature supports the call for OIS rates as natural successors to Libor/Euribor. Daily fixings for Eonia swaps are already provided in the eurozone by the same contributing panel of Euribor, and the OIS market in the short term is very liquid, with operative prices and sizes always available and verifiable.
OIS rates already meet four of the five criteria required to be accepted as a Libor replacement by the Wheatley Review: to be resilient to stress and illiquidity, to have a liquid underlying market across multiple currencies, to avoid too much complexity, to have a measurable history to allow past comparison for pricing and risk models [95]. Only coverage of all maturities is missing, because liquidity is often inadequate for longer maturities of minor currencies.
Starting to use this rate as a new reference benchmark for OTC derivatives surely would help to improve market liquidity, combined with the circumstance that the OIS market is already growing on longer maturities because OIS rates have now become the standard for collateralized derivatives discounting. The main objection is that OIS rates may represent a fair proxy only for pure interest rate exposures, they do not reflect actual bank funding costs. This may be well and good, but since many banks currently are no longer able to fund themselves at Libor/Euribor flat, where is the great difference between calculating actual funding costs as spreads over Libor/Euribor or over OIS?
Investment banks acts procyclically, by increasing their liabilities by more than their assets have risen during booms and by doing the reverse during downturns. Investment banks' actions are driven by the risk models and economic capital measures adopted. In particular, banks will adjust assets and liabilities to ensure their total equity is proportional to the total value at risk (VaR) of their assets. For a given amount of equity, a lower VaR allows banks to expand their balance sheets: since this measure or risk is by definition countercyclical, lower during booms and higher during busts, the bank's efforts to control risk will likely lead to procyclical leverage.
Let us consider a boom scenario in which the assets held by financial players with procyclical leverage increase in price. This price increase will boost the equity as a proportion of total assets, with leverage falling. Because institutions have procyclical leverage, they will respond to this erosion by raising leverage upward. The easier way is to borrow more, then use these proceeds to buy more of the assets they already hold: this behaviour clearly reverses the normal demand response. Increased demand for assets leads to upward pressure on its prices, with potential circular feedback effects.
During downturns, the mechanism works in reverse: the net worth of institutions will fall faster than the rate at which the value of their assets decreases, by increasing de facto their leverage. Hence, they will attempt to reduce leverage quite drastically in some cases, as happened in 2008: they will try to sell some assets, then use the proceeds to pay down debt. Thus, a fall in the price of the assets can lead to an increase in the supply of the assets, overturning the normal supply response to a drop in asset price. This greater supply will exercise downward pressure on asset prices, by fuelling a negative feedback effect.
The massive recourse to collateralized lending and borrowing by financial institutions, especially by investment banks, as the main tool to manage their procyclical leverage, allows the balance sheet to expand and contract by amplifying, rather than counteracting, the credit cycle, and can distort in a number of ways the effects of the traditional measures of monetary policy based on money stock. A deeper analysis of the evolution of the stock of overall collateralized borrowing during the different phases of the economic cycle is therefore strongly suggested not only for financial players in order to better monitor the functioning of the money market and to capture the role played by the adjustment of institutions' balance sheets and the overall supply of liquidity, but also for policymakers in order to fine-tune the size and timing of their monetary measures.
5.4 THE ORIGINATE-TO-DISTRIBUTE BUSINESS MODEL
Over the last decade, the greatest change to impact the asset side of banks' balance sheets has undoubtedly been the development of credit risk transfer (CRT) techniques, often known as securitization. These techniques were developed in the US but quickly spread throughout the world thanks to the interaction between deregulation (which eliminates barriers between investment and commercial banking by fostering competition within the financial system), development in technology (via dramatic improvements in the storage, processing and pricing of financial data) and financial innovation (which makes markets more complete by satisfying more complex financing needs and more frequent requests for structured riskier investments with higher returns). Securitization can be defined as the process whereby individual bank loans or other formerly illiquid assets are bundled together into tradable securities that are sold within the secondary market to economic agents that have additional capacity to bear the risk of associated assets.
Over recent years, securitization activity has definitely changed the monitoring role played by banks, reducing their fundamental function of liquidity transformation. For instance, even if a project was illiquid, through securitization the underlying loan could still be sold to the market, providing banks with additional sources of financing and with the possibility to transfer the underlying credit risk. This reduced for banks the costly economic capital needed as a buffer against their risky lending activities, allowing them to reinvest freed-up resources into the economy. Moreover, the prices of ABSs are expected to transmit extra information to the market, with positive results for its efficiency.
As a result, banks have maintained a major role as originators of credit, while progressively losing importance in their function as primary holders of illiquid assets and weakening the impact of their maturity transformation: this has produced a fundamental shift in the business of banking from the traditional originate-to-hold strategies to the so-called originate-to-distribute (OTD) models, by which banks used to originate loans and then repackage the cash flows generated by these loans into ABSs, often via so-called SPVs/SIVs, and sell on the securities to investors or finance them through the ABCP issued by conduits.
As argued in [112], the OTD model had undoubtedly produced some advantages for the economy as a whole, because banks are actually able to transfer part of the credit risk in their loan portfolio and enhance the liquidity of their assets: this monetization of previous illiquid assets represents an additional source of funding to expand lending. In so doing, banks can maintain a given level of credit supply with a lower volume of capital, or a higher leverage ratio, by reducing the cost of financing for borrowers. Moreover, economic efficiency has been improved, with capital available to productive sectors that would otherwise have no access to; by increasing the liquidity of credit markets; by lowering the credit risk premium; by offering investors greater flexibility in terms of the supply of assets and hedging opportunities.
Unfortunately, a key condition for such a business model to work is that liquidity is permanently available at market prices for each participant in the process. In fact, the funding strategy of the SPV/SIV is based on short-term ABCP issuance through conduits, with the continuous rollover of funding over time.
The events of 2007 demonstrated that this hypothesis is not always verified in the current financial market, with significant drawbacks for the OTD model. Moreover, removing assets from balance sheets does not imply that banks are no longer exposed to the risks associated with them. First, other significant risks, such as reputational or pipeline risk, continue to threaten bank activity. Second, conduits and SPVs perform maturity transformation by financing long-term illiquid assets with short-term volatile liabilities, in much the same way as banks do, but they are far less well equipped than them to cope with credit deterioration and liquidity strains.
In fact, often these vehicles do not have capital requirements to fulfil, because they are not supervised by any authorities; furthermore, before the crisis banks had to set aside capital to support liquidity commitments to vehicles, but such commitments were treated as senior exposures, with lower capital requirements for shorter maturities and the consequent incentive to regulatory arbitrage. As stressed in the first chapter, so-called “constructive obligation” (i.e., the gap between the legal commitments of banks through liquidity support and credit enhancement and the actual level of implicit support they felt obliged to take in order to protect their reputation), emerged dramatically during the crisis when banking originators, who usually retain exposure to the first defaults on loans sold, recorded profit reduction and growing the balance sheet, lowering the amount of excess capital and liquidity available to back new lending, as they were forced to satisfy vehicles' calls for liquidity support.
The market efficiency of CRT techniques was undermined by the less accurate credit scrutinizing activity performed by originators as “delegated monitors” of their borrowers, since they were expected to transfer their credit risk to other investors. Moreover, even if rating agencies were fully transparent about their methodology, they carried an enormous conflict of interest resulting from the fact they are paid by issuers for providing a service to investors. Last but not least, most investors of ABS products were not fully aware that the rating assigned by agencies did not include liquidity risk, despite this being one of the principal risks to which holders of these products were exposed.
For corporate debt, there is supposed to exist a steady and consistent relationship between the rating, in terms of mean expected loss, and the variance of losses or defaults in a cyclical downturn, but CRT techniques broke this relationship and created securities with low expected loss but high variance of loss in the cycle: therefore, the rating no longer meant the same for both a corporate bond and an ABS product, because the latter has a higher volatility of loss than the former. In general, a firm is more resilient than a vehicle to economic shocks, because it is able to adjust its balance sheet to the new market conditions in a proper and timely manner.
In fact, ratings for structured products refer to the performance of a static pool instead of a dynamic corporation, rely more on quantitative models while corporate debt ratings also rely on analyst judgment, and are heavily based on a forecast of economic conditions.
Even if the recent financial crisis pushed banks and regulators to rethink the whole securitization process for unexpected effects on business sustainability and financial stability, the significant contribution made by securitization to liquefy the less liquid part of the asset side of the balance sheet for funding purposes should not be underestimated: hence, the main goal of these techniques is likely to be enhanced refinancing of these assets instead of the capital optimisation sought in the past.
5.5 THE LIQUIDITY FRAMEWORK
The most peculiar feature of liquidity risk, compared with other types of risks, is its strong interdependence with other risks that can affect bank's balance sheets. After having explored the funding and market component of liquidity risk in Chapter 2, it is of the outmost importance to analyse the factors that make up liquidity risk, which can rather be triggered or exacerbated by other financial and operating risks within the banking business.
Box 5.2. Securitization and the bank lending channel
Securitization has probably reduced the relevance of the bank lending channel of monetary policy transmission compared with the past when banks were less integrated in groups and less able to liquidate loans into secondary markets. According to [5], securitization has altered the bank characteristics traditionally used to identify shifts in loan supply.
The size indicator is now less significant because securitization activity can considerably reduce the amount of loans on banks' balance sheets. In response to monetary tightening, the credit channel works if the reduction in supplied loans is not counterbalanced by greater access by firms to capital markets (i.e., when bonds and loans are imperfect substitutes). But, through securitization, banks may obtain additional liquidity independently of their securities holdings and the standard liquidity indicator may be less informative than in the past. In this way, securitization strengthens bank capacity to supply new loans to households and firms for a given amount of funding. However, this capacity should not to taken for granted because it changes over time and is dependent on business cycle conditions as well as on a bank's risk situation.
By reducing capital requirements securitization also makes the standard capital-to-asset ratio a poor approximation of the relevant capital constraints faced by originators in this regard and allows for a positive net effect on loan supply. More broadly, securitization provides banks with additional flexibility to face changes in market conditions associated with monetary policy movements.
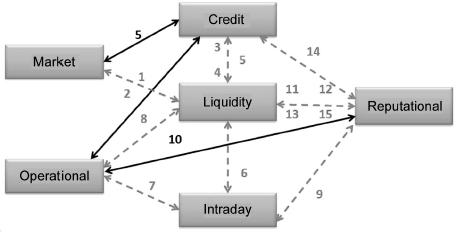
Figure 5.5. The web of risks. Dotted lines are links with intraday and liquidity risks
Source: Adapted from a graph of Vento and La Ganga [112]
These interrelationships define a sort of web of risks (some are shown in Figure 5.5), which have to be constantly monitored and updated by risk managers and treasurers in order to manage liquidity risk properly.
For example, strong links exist with both market and credit risk: adverse market conditions tend to create uncertainty about the value of assets in the liquidity management framework (1); margin calls on derivatives products implied by negative market developments also have repercussions on liquidity risk (2); credit risk often arises from a liquidity shortage when scheduled repayments fall due (3); credit worries can often require additional margins under collateral agreements with negative impacts on funding risk (4); and a rating downgrade below a specified notch can preclude access of a bank to the wholesale market (5). Interest rate and credit quality–related option risk can produce material effects on liquidity (e.g., when prevailing rates are low, loan prepayments and investment calls accelerate cash flows). On the other hand, cash flow projections may prove too high if prevailing rates rise.
Another significant block of interactions is provided by links among liquidity risk, operational risk and intraday risk. As far as intraday liquidity risk is concerned, severe disruptions in significant payment systems could affect money market conditions and increase liquidity risk (6); in addition, some operational risk can lead to a delay of other less essential payments, and might also push other institutions to delay their own settlements (7); and when there is significant disruption, operational risk can ignite liquidity risk because many banks could be forced to manage increased uncertainty about their intraday funding needs (8).
Last but not least, reputational risk can be one of the causes undermining confidence in a bank, and can easily generate liquidity and intraday risk (9), sometimes also linked to some operational problems (10). A bank's reputation for operating in a safe and sound manner is essential to attracting funds at a reasonable cost, as well as for retaining funds during crises (11). On the other hand, negative public opinion may push retail depositors, other funds providers and investors (12) to ask for greater compensation, such as higher rates (market liquidity risk) or collateral (funding liquidity risk), or conducting any other business with it: reputational risk is obviously more of an issue for banks that depend on unsecured, wholesale funding and for banks that sell or securitize loans (13). Reputational risk is likely to translate into augmented own credit risk, with a potential negative outlook and rating downgrades (14), or simply magnify the usual flowback of a bank's own issues from the secondary market (15).
Once identified all risks related to the bank model, specific metrics and limits for each type of risk have to be defined by top management in order to address the business strategy in the most efficient way. For liquidity risk this limit is commonly known as “liquidity risk tolerance” and has to be fixed directly by top management according to their risk appetite. It is important to define a measure so that it is easy to understand for people who are not practitioners, like a “survival horizon” for the short term and a “maximum cumulative mismatch” for the long term. It is also crucial that senior management are directly involved in developing policies and practices to manage liquidity risk in accordance with the defined risk tolerance, in order to avoid risk-prone behaviours led by budget figures that are not consistent with some assigned limits.
As suggested by the BCBS' Principles for Sound Liquidity Risk Management and Supervision [99], “senior management should continuously review information on the bank's liquidity developments and report to the board of directors on a regular basis. A bank's board of directors should review and approve strategy, policies and practices related to the management of liquidity at least annually and ensure that senior management manages liquidity risk effectively.” Top management being well aware of the liquidity risk generated by business activity is therefore one of the key drivers to ensure the governance and management of liquidity risk based on sound practices.
An effective liquidity framework (as stylized in Figure 5.6) needs intrinsic consistency among risk appetite level, performance measurement system and pricing process. In fact, the risk tolerance threshold can be used as input data to define the budget figures of all business units and the liquidity funding plan for the treasury department. In order to translate the risk appetite level into measures and processes that properly address business strategies, the role played by liquidity risk metrics is crucial. The term “metric” is used for a measure that facilitates quantification of some particular characteristic of a bank's liquidity position or risk.
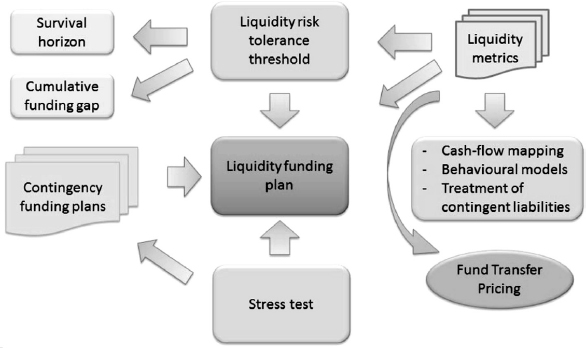
Figure 5.6. The liquidity framework
Different approaches to cash flow mapping, behaviour models, treatment of contingent liabilities, to name but a few, have relevant impacts not only on risk measurement, but also on pricing and the commercial strategies of some products. For instance, if deposits from medium and large corporate firms are considered less stable than those from retail customers, banks are likely to have more interest to attract and pay more than the latter, because they generate more value for liquidity metrics. Moreover, liquidity metrics, in their role as interpreter of the liquidity risk appetite in practical measures to address the bank's business, represent prerequisites to definition of a liquidity funding plan.
A liquidity funding plan aims at defining the funding strategy, in terms of timing, mix of instruments and funding channels, to support expected and ongoing business over at least one year, taking into account budget figures, funding expiring after a given period of time and expected market conditions, with the goal of optimizing the cost of funding on the entire term structure. Implementation of a liquidity funding plan has to be continuously monitored and timely adjusted, since liquidity is not always available and its lack can compromise strategic targets. A liquidity funding plan always has to be supported by specific contingency funding plans that should allow, under some acute stress scenarios tailor made for actual bank business (including the combination of idiosyncratic and market-related shocks), management of a potential liquidity crisis, without implementing procedures and/or employing instruments that, due to their intensity or manner of use, do not qualify as ordinary administration.
In order to properly address the activities that impact on the overall liquidity profile, each bank has to define an accurate system of fund transfer pricing (FTP), which allocates the relevant costs and benefits, both direct and indirect, related to liquidity risk to all business units. With such a system, business decisions are always forced to factor the liquidity component into the pricing, and the cost (benefit) of liquidity can be transferred ideally to business lines even at the trade level.
The FTP system is the transmission chain that communicates to all desks changes in the risk-tolerance threshold or in market funding spreads: it represents one of the key factors to building a consistent risk-adjusted performance measurement system. The FTP system should always be linked to the market and be representative of the real funding capacity of the firm: it is closely linked to liquidity metrics and a liquidity funding plan. One of the key features for a successful FTP system to achieve individual and aggregate targets is its “fairness”: rules have to be clear, well understood from the top to the bottom of the firm and clearly defined in formalized procedures, in order (i) to protect business lines from risks they are unable to control and manage; and (ii) to stop them from arbitraging the system. The mechanism should be designed to ensure that end users can understand the output and know how to use it in order to facilitate decisions that will ultimately impact the financial situation of the firm. Internal prices should percolate down to decision makers at the transaction level in order to ensure maximum impact. A constant dialogue between business lines and the functions responsible for calculation and application of the FTP system is strongly suggested. Business lines should understand the rationality of internal prices and the treasury needs to understand the rationale and funding implications of the transacted deal.
Ideally, the FTP system should be kept as simple as possible, with a strict distinction required between the function that fixes the rules to determine FTP daily values and the function (typically the treasury) that applies them. In order to work properly even under stressed conditions and very volatile phases it is strongly suggested to define some mechanisms to reduce excessive volatility of quotations in the very short term to avoid some drawbacks in customer relations, and to override values in order to address some strategic activities. In these cases modifications should always be consistent with the overall risk tolerance threshold and liquidity metrics, and adequately tracked by the performance measurement system.
In March 2010 the Confederation of European Banking Supervisors (CEBS) issued Guidelines on Liquidity Cost Benefit Allocation (CP 36) [7], in accordance with Recommendation 2 provided by the CEBS to the EC on liquidity risk management (CEBS 2008 147): “Institutions should have in place an adequate internal mechanism—supported where appropriate by a transfer pricing mechanism—which provides appropriate incentives regarding the contribution to liquidity risk of the different business activities. This mechanism should incorporate all costs of liquidity (from short to long-term, including contingent risk).”
The guidelines should help institutions to link their strategic direction with liquidity resource allocation. Using internal pricing mechanisms allows institutions to improve their process for pricing products, measuring performance, assessing new products and enhancing the tool for asset/liability management. This should be applicable to all significant business activities, both on and off balance sheet. It also serves to align the risk-taking incentives of individual business lines with the liquidity risk exposures that their activities create for the institution as a whole.
Some interesting points are provided by Guideline 2: the prices should be used for internal pricing of liquidity, performance measurement and the appraisal of new products or business for all significant activities, both on and off balance sheet: hence, discrepancies between pricing and performance measurement are not welcome. If management wish to incentivize certain behaviours, this should be subject to a separate approval and reporting process: therefore, exceptions have to be authorized and, consequently, monitored and evaluated in a different way.
The objectivity of internal prices should be maintained for the correct pricing and reporting of liquidity. Concerning to the treasury, “the area or responsible function ultimately charged with implementing the internal prices should be service-oriented and not have a profit target for this specific role. Equally, for larger institutions, personnel working within the area should not be set profit targets for this activity” [7]. Therefore, the treasury is not a profit centre for this activity, otherwise it could adjust prices according to its target, but in the meantime it cannot be a cost centre as well, which means the costs of each exception authorised by management do not have to be borne by the treasury.
Last but not least, Guideline 25 states: “The internal prices used should reflect the marginal cost of funding. The price should reflect the marginal cost over a homogenous product group as an average, but it should also reflect current costs. Funding already acquired (tapped) should already be taken into account in the prices of products sold (or being sold). In order to achieve a reliable marginal funding cost, an institution should be able to adjust transfer prices according to current demand for new funding, mainly, when calculating the contingent liquidity cost price. As the required size of the liquidity buffer (and its cost) changes with any new product sold, as well as any new funding tapped, an institution should ideally be able to recalculate the transfer price according to its expected balance sheet term structure (dynamic price setting)” [7].
5.6 STRESS-TESTING AND CONTINGENCY FUNDING PLAN
As previously stated, the liquidity risk appetite is analytically defined by the “risk tolerance threshold” that is applied to some specific measures (liquidity ratios, cumulative funding gaps and survival horizons): it represents the maximum level of risk that the bank is willing to accept. The quantification of risk tolerance presupposes that (i) a probability space can be defined that spans all material realizations of a stochastic variable; (ii) a probability distribution can be reasonably well approximated over the probability space. Thus, given a probability distribution of shocks that can generate liquidity risk, each bank could decide on the risk-bearing capacity that it wants to hold, in terms of the cumulative probability distribution of shocks it wants to survive (normally 99.9% since we are talking about the survival of a firm).
Unfortunately, the number of observable liquidity shocks and their institution-pecific nature, depending on the actual structure of the balance sheet, would attach high uncertainty to the definition of the probability space and the approximation of the probability distribution. Tail risks are likely to arise and have to be properly captured by specific stress tests as part of liquidity risk management.
Shocks are usually defined as certain specific scenarios that can be applied to a bank's cash flow distribution in order to perform stress tests. The scenarios are based on certain risk factors that, accurately modified, produce new values for expected cash flows mapped on the maturity ladder: both idiosyncratic and market-related scenarios have to be tailor made to fit the firm's business model, since they are mainly risk management tools—not simple regulatory requirements. This means that it is not enough to simply mimic severe past liquidity shocks but it is necessary to get scenario reviews focused on the changing nature of banks' liquidity risk exposure (e.g., taking into account new products, new markets, new funding sources or changes in counterparty behaviour).
Moreover, it is of the utmost importance to use combined market-related (systemic crisis) and idiosyncratic (own name crisis) stress scenarios since focusing on isolated risk factors implicitly assumes in too optimistic a way that (i) these risks are independent of each other; (ii) they have very low probability; and (iii) their combined probability is therefore negligible.
The risk factors used by banks for the idiosyncratic scenario often comprise rating downgrades, reduced access to wholesale funding (both secured and unsecured), reduction in the credit lines available and counterparty limits, increased haircuts and collateral calls, utilization of credit commitments, inability to draw down precommitted lines, currency redenomination risk and increase in demand for financial funding by entities within the group.
A list of market-related events can include a particular geographical context (central European liquidity crisis, global markets, emerging markets, local money market or retail deposit markets), the cause of the stress (subprime crisis, government crisis or unexpected change in monetary policy, sudden and deep recession, default of a primary market counterparty), the closure of key funding markets (senior and covered bond markets, unsecured and secured interbank markets, securitization market, disruption in CP and CD segments, dislocation in the forex swap market), a set of negative economic indicators (rise in bond yields, drop in stock prices, widening in credit spreads) and the perceived severity of stress. The correlation between some risk factors is easier to calibrate (i.e., causes linked to a particular context or financial indicators) and sometimes the task is more challenging. However, it is crucial not to consider these cases on a standalone basis, because liquidity tensions are often driven by different factors that work together and feed on each other.
From the computational point of view each bank should be able to run periodic simulations to manage stress-testing on certain specific and combined forecast scenarios (i.e., closure of forex market, severe retail outflow, etc.). The simulation engine should allow what-if scenarios to be run and calculate expected cash flows impacted by certain risk factors (new prepayments, new default probabilities, new rollover, new balance sheet growth, new haircuts, new market risk parameters, etc.): for every new simulation item a specific behaviour hypothesis should be defined so that they can be reused in a combined scenario.
For the largest banks, deeply involved in settlement and payment systems, it is crucial to monitor intraday liquidity risk as well. Intraday liquidity can be defined as “funds which can be accessed during the business day, usually to enable financial institutions to make payments in real-time” [101]. Intraday liquidity risk is therefore related to cases in which banks are not able to actively manage their intraday liquidity positions to meet payment and settlement obligations on a timely basis under both normal and stressed conditions, and thus contribute to the smooth functioning of payment and settlement systems. The elements relevant to intraday liquidity profiles can differ between banks depending on whether they access payment and settlement systems directly or indirectly, or whether or not they provide correspondent banking services and intraday credit facilities to other banks.
A continuous and updated stress test analysis is a prerequisite to implementing an effective contingency funding plan (CFP). This consists of defining and setting an infrastructure, in terms of actions and processes aimed at safeguarding the bank's asset value and guaranteeing the continuity of operations under certain conditions of extreme liquidity emergency. Its main goal is to keep the business franchise and to preserve customer relationships. It ensures (i) identification of early-warning signals and their ongoing monitoring; (ii) definition of procedures to be implemented in situations of liquidity stress; (iii) immediate lines of action; and (iv) intervention measures for the resolution of emergencies.
As already stated, the dangers of liquidity risk lie in its potential to be very severe despite its low probability: it can easily lead to serious disruption of a bank because the contingent liquidity risk is related to the situation of not having sufficient funds to meet sudden and unexpected short-term obligations. Rising uncertainty can affect both funding needs and sources. For instance, among the unforeseen increases in funding required are unexpected loan demand, unexpected credit drawdown, other commitment draws and some requirements for increased collateral pledging. Moreover, unforeseen decreases in the funding available can comprise unexpected deposit withdrawals, the evaporation of unused funding capacity and erosion of the market value of unencumbered, marketable assets.
The combination of early-warning procedures and advance preparation for liquidity perils that are very serious, despite their low probability, must fit together with the bank's liquidity management and stress-testing analysis. Funding crises almost always progress in stages: being prepared to enhance liquidity provisions quickly at the first sign of increased need is one of the most important best practices for liquidity risk management. It has to be pointed out that some remedies available to treasurers in the early stages of a funding difficulty may disappear if trouble progresses to a more severe stage, such as when new unsecured funding can only be raised in case of a minor funding problem, or when new secured borrowing is at an intermediate stage, or when the only recourse is CB refinancing as the crisis deepens.
Moreover, market access should not be overestimated even in the first phases of a funding problem, because wholesale counterparties, who are used to providing large amounts of funds, are very sensitive to rumours or bad news and tend to disappear at the first sign of idiosyncratic shock. In that case the bank can experience unavailability of new funding, no matter how much it is ready to pay: it is not a simple matter of cost, but of market capacity to absorb the new demand for funds when some channels are closed due to a single-name problem. Because new secured funding depends on collateral availability the key factor in the short term is once again to have a well-dimensioned pool of unencumbered highly liquid securities.
The CFP is a combination of measures defined by common sense: it has to be seen as a menu with many choices—not as a list of instructions. Several plans have to be developed for funding in multiple currencies: when markets are stressed or when the bank's rating is under pressure, it may be very difficult to transfer funds between currencies. Different kinds of crises obviously require different kinds of preparation. A CFP should be a “living plan” that needs to be periodically updated, in order to rely only on the actual funding strategies available in certain market situations. Advanced planning, though ambitious and challenging in its goal to face the unknown, is still invaluable at times when scenarios could be shown to be wrong and priorities could be quickly modified. Some rules of common sense should not be underestimated: for instance, previous positive experiences should not take precedence over contingency planning. As already stated, relying on market access can be logical only under normal or mildly disturbed funding conditions, even though some feedbacks provided by the financial industry to a BSC survey [65] surprisingly recorded huge confidence in interbank market functioning (see Figure 5.7). The ultimate goal is to buy time in a period of crisis: it can make the difference between survival and bankruptcy.
The CFP is a tool to manage outside firms' perceptions by minimizing reputational risk and ensuring goingconcern activity. Its scope is to limit excessive funding costs, to mitigate and control crisis contagion and escalation within the group, by preserving the business franchise. It is defined to answering the following basic calls: When? What for? How? Actually, a CFP must be activated whenever the liquidity position is threatened by market-related or firm-specific events. It has to meet current and future financial obligations at all times, in all currencies, and for all group companies, by addressing questions about consolidated and unconsolidated CFP elements; to sum up, it provides a guideline for all players within the firm in the event of a liquidity crisis by providing a clear escalation plan.
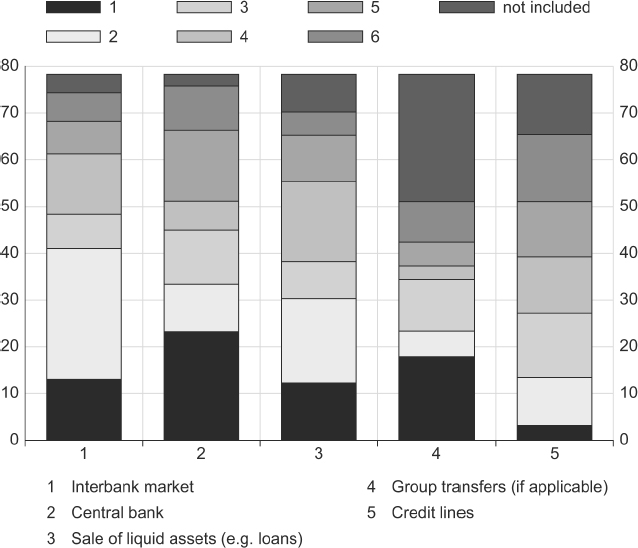
Figure 5.7. Idiosyncratic liquidity stress scenarios in funding sources. Distribution of importance (1 = most important to 6 = least important) of individual funding sources in the 78 idiosyncratic scenarios that were described by 67 banks (some banks run more than one idiosyncratic scenario)
Source: BSC Survey [65]
One of the key elements of a good CFP is to clearly identify who will make decisions about internal and external communications. A liquidity crisis is often related to a crisis in the firm's confidence, which can be easily further eroded by unclear or inconsistent communications. Prompt and proactive communications with major depositors, lenders and regulators have to be quickly activated. During a liquidity crisis a bank is likely to counter rumours, allay concerns of lenders, avoid unwanted regulatory attention: when material negative information about its situation becomes public, the bank should be prepared to immediately announce corrective actions that are being taken. This behaviour could help to mitigate market fears and demonstrate that top management are focused on problems as they arise.
The sources of funding and strains are, of course, strongly dependent on tension typology: among the strains most likely experienced are runs on many, if not all, irrevocable commitment lines on the asset side and evaporation of interbank and wholesale funding combined with a significant reduction in the core deposits of savings on the liability side. The activation of some potential liquidity sources is related to the severity and duration of liquidity: on the asset side the first line of defence (see Figure 5.8) is clearly provided by the liquidity buffer (i.e., unencumbered financial investments to monetize, followed by the squaring of trading positions and asset disposal). With more time, asset securitizations can be implemented in order to raise funds from the market or central bank through collateralized borrowing. Recourse to “the three S's” (i.e., syndication, sales and securitization) should not be overestimated because, in order to be effective, it has to be activated at the very first stage of the problem. Moreover, selling or transfer assets could lead to an increase in the average risk of the remaining assets, because the highest quality assets are likely to be sold. On the liability side there are tools like the issuance of covered bonds or debt bonds that can be used in the retail market or wholesale channels if still available; recourse to some form of wholesale funding (CD/CP) or secured funding, as already pointed out, depends on features of the incoming crisis.
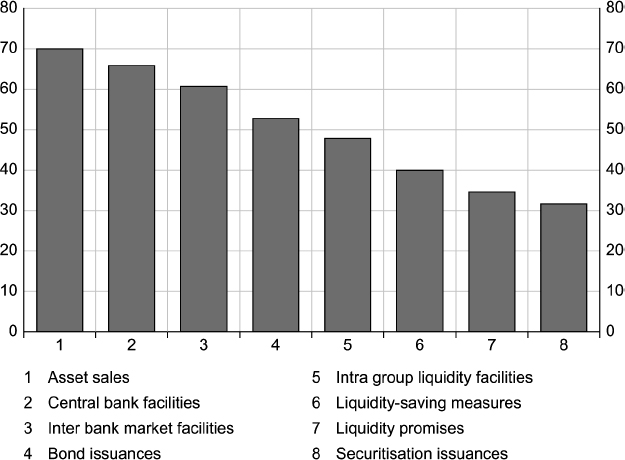
Figure 5.8. Sources of liquidity in CFPs. Which of these measures are included in your CFP?
Source: BSC Survey [65]
The CFP system of early-warning indicators is designed to provide a monitoring tool able to intercept the first signs of incoming liquidity tension or crisis. These indications are crucial because, in crisis situations, there could be very limited time to find the right processes to determine the severity and likely duration of the crisis, and to ascertain adequate funding needs and sources.
The values of early-warning indicators (both quantitative and qualitative) are often combined in order to identify several potential states of the crisis: they aim at defining the importance of the trigger, from the lowest level identified as “ongoing” (business as usual) to the highest one of “alarm”, which leads to activation of the CFP, because of a name-specific crisis or a stressed liquidity position. Other intermediate levels include “attention”, still defined as business as usual but with some captured stress (market or own name) and “alert”, which should intercept the first signs of a market-generalized crisis. During the “attention” phase the objective should be not only to limit potential escalation but to prepare for it as well; the “alert” phase calls for excessive funding costs to be avoided and sufficient funding ensured, with some slowdown of growth plans.
Box 5.4. The CEBS quantitative information set [98]
Short-term resilience (liquidity coverage ratio) to maturity mismatch and contingent liabilities takes the following into account:
- Liquidity buffer
- Size
- Composition (asset type, duration, currency)
- Contextual information (stress scenario, time horizon)
- Stress scenario (idiosyncratic, market related, combined)
- Time horizon (acute stress: 1 or 2 weeks; persistent stress: from 1 to 3 months)
- Stress indicators (bank specific, such as share price, financial index, CDS, senior unsecured and covered ASW spread, CDs and CP debt spread, ordinary savings interest rate, ECB financing quote)
- Counterbalancing capacity
- Asset liquidability
- Contingent funding sources
- Longer term resilience (balance sheet structure modification)
- Net stable funding ratio
- Ratio components (retail and wholesale funding, equity, illiquid assets, contingent liabilities, haircuts)
- Diversification of funding structure
- Wholesale funding ratio
- Funding counterparty concentration indicator
- Asset time to liquidability (securitization, sale)
- Net stable funding ratio
- Maturity ladder
- Contractual data and behaviour assumptions (rollover and reputational risk)
- Liquidity gap for time band
- Cumulative liquidity gap
- Currency liquidity mismatch
- CB refinancing dependency
- Current percentage of CB funding versus average percentage
- Current percentage versus country percentage
- Current percentage versus total percentage
- Illiquid assets:
- Non-marketable assets
- Non-maturing relatively non-marketable assets
- Haircuts to liquid assets
- Contingent liabilities (committed lines, financial guarantees)
- Derivatives (cash flows, margin calls, contingent liabilities related to securitization, due to performance or rating triggers or buybacks)
Early-warning indicators related to a firm-specific crisis are often variables constantly monitored by the bank in its daily activity, such as the trend of the spread (difference between the funding cost paid by the firm and the one paid by peers) paid for unsecured deposits, borrowed funding or asset securitisation, or retail deposit withdrawals. Alerts from wholesale funding can be provided by reducting the tenors potential lenders are willing to impose, or by requests for collateral or for smaller transaction sizes from lenders previously willing to provide unsecured funding or larger transaction amounts (did they fill the credit line or cut it?).
Other dangerous factors include a significant drop in stock prices (research has shown that in many cases idiosyncratic liquidity stress was preceded by a decline in the share price of the institution, particularly when it diverged from the general index for comparable financial firms, as occurred for Lehman); negative outlook or rating downgrade, especially if unexpected; increase in the use of committed lines from customers; market pressures to buy back its own obligations in the secondary market. Any violation of the liquidity risk limit or cases in which multiple measures of liquidity risk are approaching limits are obviously causes of concern.
Another stress indicator can be found in the credit spreads on the various debt products issued by an institution. The delta in CDS spreads and in bond yield spreads versus the yield on government debt (Treasuries) with the same maturity, or versus the swap yield on the same tenor, should normally provide the same indications, but they could diverge due to market liquidity. They may be used together or alternatively. Subordinated debt will be more sensitive than senior debt, but both may be used as indicators. As with equity prices, a comparison should be made with peers, based on a relevant index for the peer group (i.e., 5Y iTraxx financial senior).
Early-warning indicators for market-related shocks are often linked to some market quotations or figures, such as the weekly rollover of new issuances of CP/CD, or the spread between the 5Y ITraxx financial senior and government yield, or the spread between European core government bond yield and peripheral bond yield, in order to capture flight to quality in capital markets. Widening of the spread among repo rates for different asset classes can represent evidence of tensions or disruption for some market segments, as well as a huge gap between the unsecured ON rate and the refi rate fixed by the ECB. These quotations must always be monitored in combination with other measures that give some clue to the liquidity excess available on the market, such as the sum of “daily deposit facility” − “daily marginal lending” + “daily current account amounts” in the current environment under a full allotment regime defined by the ECB, or the allotted amount versus the benchmark for MRO in cases of competitive tenders. The spread between the 3-month Euribor versus the 3-month US Libor is a useful tool to monitor tension on the forex swap market, because this measure reacts very quickly to liquidity tensions driven by USD shortage for the whole market or some specific segments (i.e., European banks over the last two years).
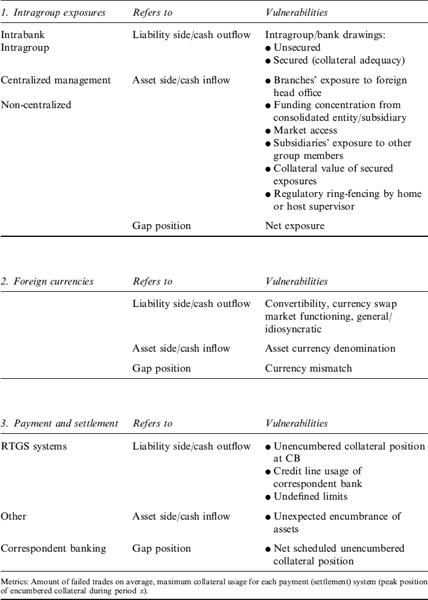
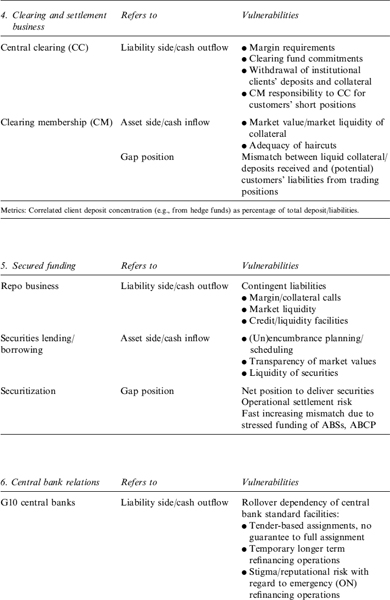
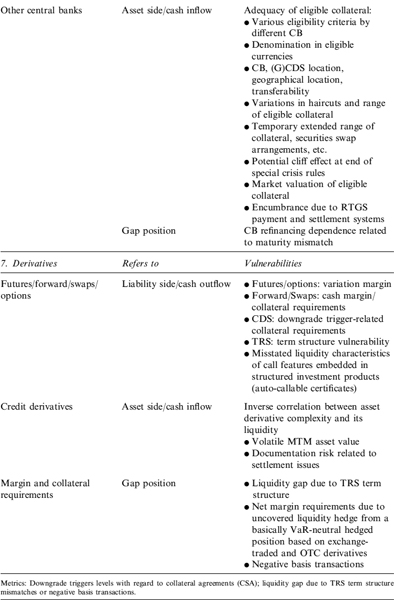
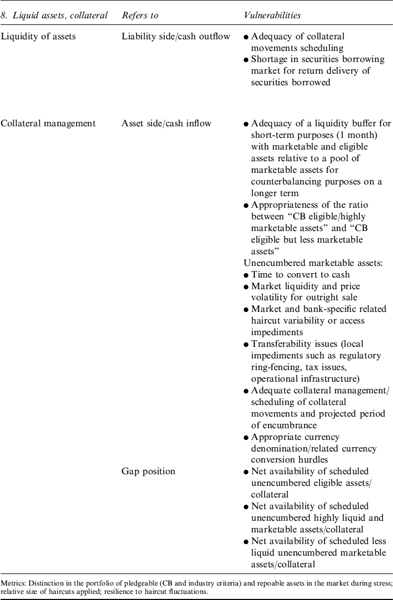
5.7 THE CEBS IDENTITY CARD
Although financial institutions are different for business models and activities, some common features can always be identified as crucial for liquidity risk monitoring and measurement. In 2009 the CEBS (now EBA) proposed the so-called “liquidity identity card” (hereafter “liquidity ID”, [98]), with the aim at enabling supervisors to gain a common understanding of the liquidity risk and resilience of a group and its entities (subsidiaries and branches) in both the short and longer term, given the specificities of the group's business and its risk tolerance. It represents up to now the most detailed public attempt to gather data in order to fill the information gap between financial players and regulators.
The liquidity ID provides qualitative and quantitative information on liquidity risk and liquidity risk management that can be used not only by regulators, but also by firms themselves to fully understand their overall liquidity risk profile. It is composed of two parts: the first part provides a common set of information (core ID), general and qualitative information regarding the liquidity strategy, cash pooling, the liquidity support provided by the parent company to all entities of the group in normal times, stress test scenarios, the liquidity buffer, the funding concentration, the liquidity policy, the obstacles to liquidity transfers and the CFP; the second part provides quantitative information concerning the liquidity buffer, the long-term funding ratio, diversification of the funding structure and the domestic quantitative ratio.
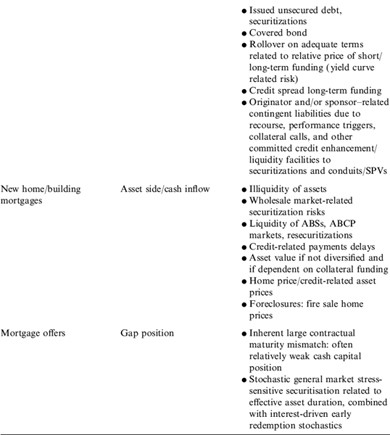
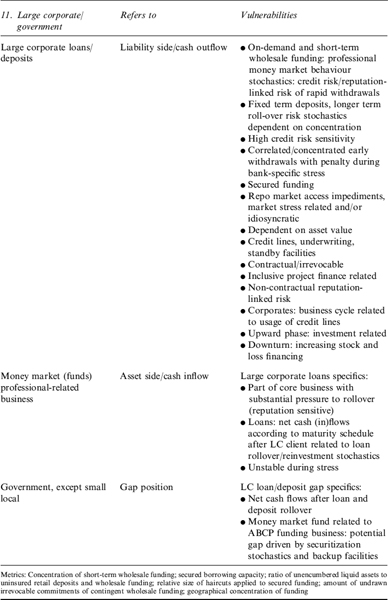
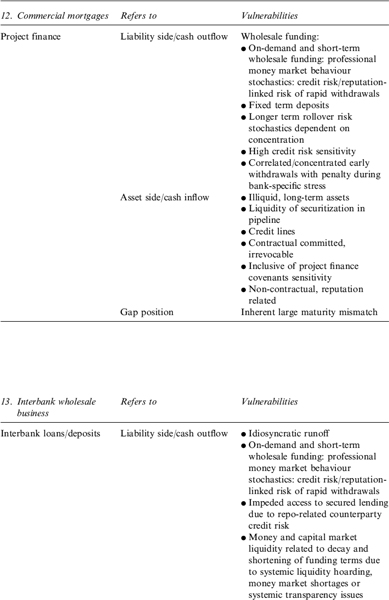
The most interesting part of the document is perhaps the so-called “additional à la carte information”, which deals with market indicators, a synthetic maturity ladder, a core funding ratio and examples of additional metrics for specific vulnerabilities, listed in the appendix (Section 5.9).
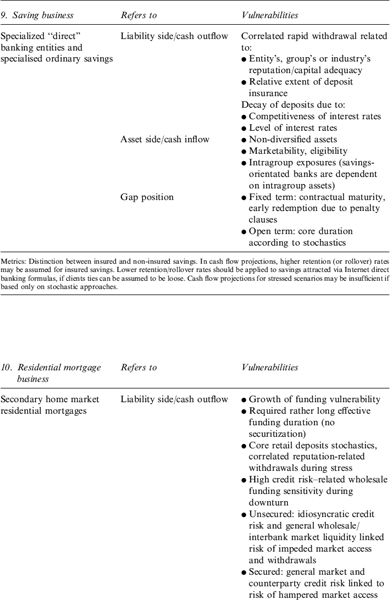
For this purpose illiquid assets are defined as:
- Haircuts to liquid assets (if available): the sum of all haircuts, whether derived from central bank policies or from internal policies, applied to the liquid, marketable, and CB-eligible assets that are taken into account when computing liquidity buffers.
- Contingent liabilities, including the maximum off-balance-sheet credit risk exposure according to IFRS 7 as included in paragraph 36(a): “the amount by class of instruments that best represents the entity's maximum exposure to credit risk at the end of the reporting period without taking account of any collateral held or any other credit enhancements (such as netting agreements that do not qualify for offset under IAS 32).” This definition includes the amount of undrawn loan commitments that are irrevocable over the life of the facility or are revocable only in response to a material adverse change. If the issuer cannot settle the loan commitment net in cash or another financial instrument, the maximum credit exposure is the full amount of the commitment. It also includes financial guarantees. In this case, maximum exposure to credit risk is the maximum amount the entity would have to pay if the guarantee is called on.
- For derivative contracts, the maximum credit risk exposure under IFRS 7 includes only the on-balance-sheet carrying fair value amount of the contract (if the resulting asset from derivatives is measured at fair value). In the context of Part II, an additional best estimate proxy amount of market risk related to potential off-balance-sheet liabilities may be agreed. This may also be the case for contingent liabilities related to securitization (e.g., due to performance triggers or buybacks) and any non-contractual reputation-related liability.
Retail funding includes SMEs with less sophisticated treasuries, and represents the most behaviourally stable component of funding as a whole. Wholesale funding is funding provided by professional credit risk–sensitive counterparties. It should include at least the following items:
- issued debt securities, both unsecured and secured (e.g., covered bonds);
- deposits and secured funding (e.g., repos) from credit institutions, other financial institutions and governments;
- secured and unsecured funding from central banks;
- deposits and secured funding from professional money market players with a professional treasury function, such as institutional investors and large corporations.
In the appendix (Section 5.9) we show the identity card as proposed by the CEBS in the annex of the aforementioned document.
5.8 CONCLUSIONS
This chapter terminates the first part of this book, whose goal was to show how liquidity risk may affect the business of a financial institution. Starting from a brief description of the causes that led to the crisis which has afflicted the financial industry over the last five years we have identified and analysed the three types of liquidity risk (and dangerous combinations of them).
From a macroeconomic point of view, focused on the attempts of regulators to address and monitor liquidity risk on the business of a bank, we moved to a micro-economic analysis with the aim of developing a comprehensive framework of sound management and supervision practices about liquidity risk, whose building blocks are represented by an articulate system of risk management, treasury tools, product pricing and performance measurement to warrant full consistency between liquidity risk-taking activities and the risk tolerance threshold defined for the firm.
It is now time to move from principles to the analysis of the tools used to manage liquidity risk effectively currently at the disposal of risk managers and treasurers.
5.9 APPENDIX: THE CEBS IDENTITY CARD ANNEX(CEBS [98])