
Machining scale
Workpiece grain size and surface integrity in micro end milling
A.R. Rodrigues and R.G. Jasinevicius, University of São Paulo, São Carlos, Brazil
Abstract
This chapter presents the need of adapting the workpiece grain size (GS) and specifying properly the cutting parameters when milling metallic materials with crystallographic structure at distinct scales mainly at micromilling. The effects of fine and coarse GS as well as milling scale and main cutting parameters on workpiece surface integrity are described and explained, such as burr formation, size effect, specific cutting energy, chip formation mechanisms, surface and subsurface microhardness, workpiece finishing and microstructure strain near machined surface.
Keywords
Micromilling; workpiece grain size; specific cutting energy; size effect; surface integrity
2.1 Introduction
Manufactured microcomponents were first presented in the 1960s by the watch industry. Considered as a strategic field in the 1970s, precision mechanics required miniaturization of equipment and devices. The 1980s was marked by the world growing of research on microtechnology, known as microelectromechanical systems (MEMS) in United States and as microsystems technology in Europe. In the 1990s, the technologies based upon chemical machining of silicon were broadly applied in the electronic industry (Arai, 2008; Ferreira & Fernandes, 2003). From the year 2000 to the present day, it is noticeable that research and applications are primarily focused on mechanical micromachining, with experimental and numerical studies based upon chip formation mechanism, scale or size effect, elimination or burrs attenuation, and machining of complex tridimensional microparts.
Today, the demand for miniaturized parts and products is rapidly increasing in several industrial segments, such as aeroespacial, biomedics, optics, electronics, communications, and automotive (Chen, Ni, Wang, & Jiang, 2012; Klocke, Gerschwiler, & Abouridouane, 2009). Among everyday products, inkjet printer heads, electronic auto injection sensors, magnetic disks heads, portable devices for cholesterol blood dosage, fiber optic connectors, and filters, as well as optical lens used in cameras for mobile phones, are just few examples of components or products that use micromachining technology to manufacture them (Ferreira & Fernandes, 2003; Lekkala et al., 2011).
Large-scale production of microcomponents in the coming years has been identified as a challenge. Chae, Park, and Freihet (2006) noticed that most manufacturing processed applied to microcomponents are based on semiconductor processing techniques, where silicon based materials are photoengraved by chemical etching or dry processing. However, these methods are considered slow, limited to some silicon based materials, restricted to planar geometries, and have higher production costs.
Micromachining processes most employed in the production of microcomponents are electrical discharge (micromolds), laser (microholes), ultrasound (micropenetration in brittle materials), photolithography (planar microwalls) and electrochemical (smooth microsurfaces on metals). These machining techniques are known as nonconventional machining processes, even though presenting higher costs and some limitations, they represent the most employed microcomponent fabrication processes (Masuzawa, 2000).
Mechanical micromachining (microcutting) may be considered a good alternative when creating miniaturized components with dimensions ranging from tens of micrometres to a few millimitres (Cardoso & Davim, 2010; Chae et al., 2006). According to Masuzawa (2000) and Weule, Hüntrup, and Tritschler (2001), several cutting operations may be employed in mechanical micromachining, such as drilling of microholes, milling of microchannels and molds (complex 3D geometries), and micropin turning.
The most attractive advantage of micromilling is the possibility to fabricate 3D microstructures made from different materials, characterized by high aspect ratio and geometrical complexity (Afazov, Ratchev, & Segal, 2012; Li et al., 2010). Furthermore, it can produce more complex geometry than that obtained by lithography, and it is potentially useful in combination with MEMS lithography based processing techniques. Micromilling is also important for the production of parts in mesoscale (parts in the order of 1 mm to 1 cm), which are too large for lithographic techniques but too small for many other traditional manufacturing techniques (Lee & Dornfeld, 2004). When machining micromolds, micromilling overcomes other machining processes such as electrical discharge and laser machining, since it presents a higher material removal rate, good compliance with dimensional tolerances, and better surface quality (Schmidt & Tritschler, 2004).
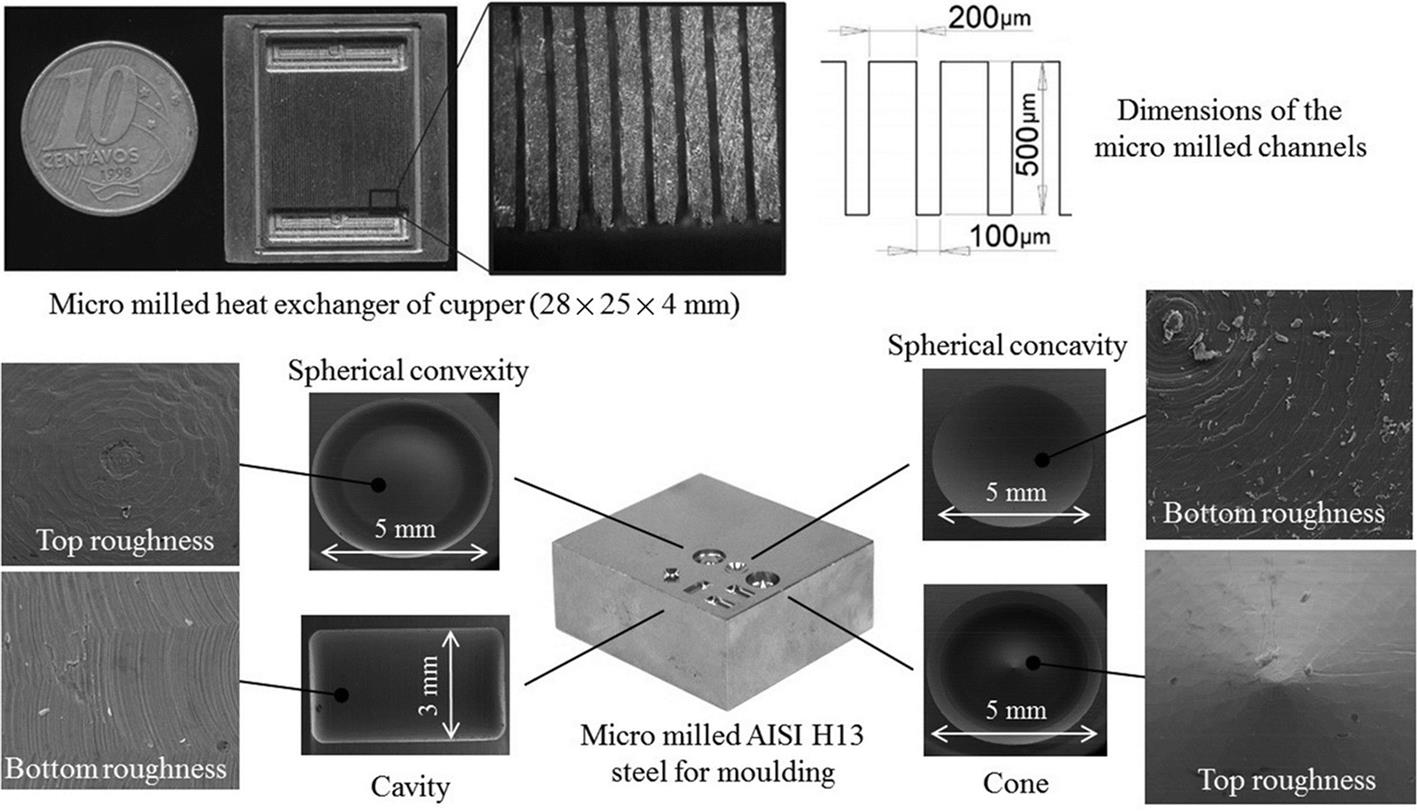
Accordingly, micromilling, often using cutting tools with diameters smaller than 1 mm, has become an important method for the manufacturing of complex microparts that require a variety of materials, shapes, and functional interfaces (Aramcharoen & Mativenga, 2009). Fig. 2.1 illustrates some microstructures milled at microscale for engineering applications.
Alting, Kimura, Hansen, and Bissaco (2003) defined micromachining as a process dealing with the development of products with functional characteristics, or that at least have a dimension in the micrometre scale. According to Masuzawa (2000), micro in micromachining indicates ‘micrometre’ and represents the range of 1 to 999 μm. Aramcharoen and Mativenga (2009) described machining in microscale, where the nominal cutting thickness ranges from namometres to a few micrometres. Dornfeld, Min, and Takeuchi (2006) and Câmara, Campos Rubio, Abrão, and Davim (2012) stated that mechanical micromachining uses cutting tools smaller than 1 mm, presenting a defined geometry cutting edge.
The definitions of micromachining reported in literature define the term as material removal processes in which the dimensions of the tool, component and cutting parameters are in the micrometre range (Simoneau, Ng, & Elbestawi, 2007).
However, the above proposed definition is somewhat generic or incomplete. Consequently, questions may arise such as: (1) How are micrometric ranges effectively set? (2) Which tool dimensions or products’ functional characteristics, smaller than 1 mm, can be classified as micrometric?
Thus, the definiton of microcutting should not consider only workpiece and/or tool dimensions (even lesser than 1 mm), but the cutting parameter ranges which affect effectively the chip removal mechanism. This could be considered a more coherent way of defining microachining based on the interaction scale from material removal mechanism.
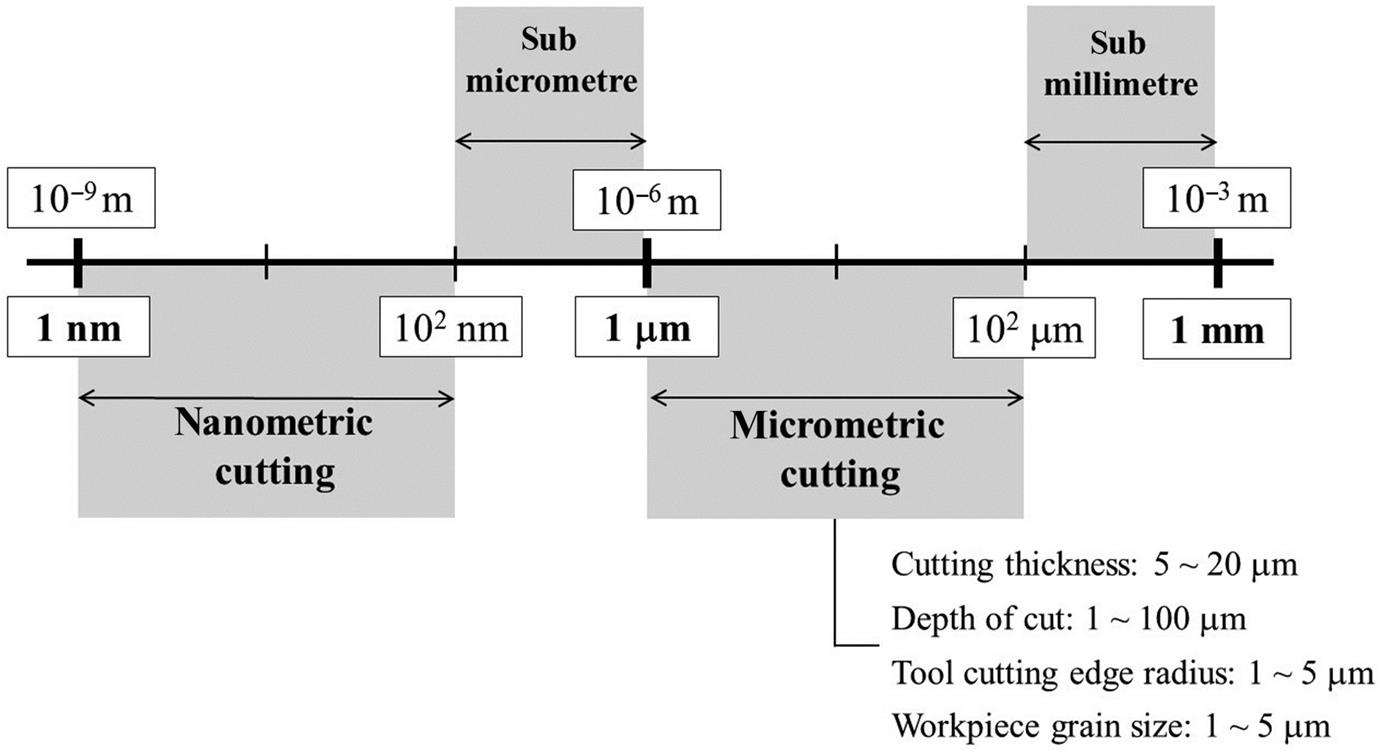
The cutting parameters effectively involved in microcutting such as tool feedrate f (or, equivalently, the nominal cutting thickness h) and the depth of cut ap are in the range of about 5 to 20 μm and 1 to 100 μm, respectively. Consequently, machining in the micrometre scale considers the typical area bounded by the chip cross section (Ac) ranging from 100 to 999 μm. These values are much larger than the tool edge radius which is typically smaller than 5 μm (Fig. 2.2). Thus, this order of magnitude implies that material removal process be governed by shear mechanism, reducing to a minimum the metal pressed into the machined surface due to ploughing mechanism and mitigating surface residual stresses. The concepts of minimum cutting thickness, size effect, and surface integrity will be discussed in the next sections.
Moreover, by assuming that the cutting parameters magnitude as the main factor to define micromachining, material microstructure should have a direct influence at the dimensions found in micromachining as well. In this case, the material is not considered continuous, homogeneous, and/or isotropic as in macromachining. These characteristics can only be achieved when the average grain size (GS) is reduced to match similar Ac/GS ratio found in conventional machining. During micromachining of conventional GS (some tens of square micrometres), the cutting tool portion interacting with material microstructure is sometimes smaller than the nominal GS. This means that the length of the tool cutting edge will cut within a crystal grain. In this case the tool–material interaction will be affected by factors such as grain boundaries, crystallographic orientation, and flaws and impurities, such as hard inclusions. Therefore, the microstructural scale of the workpiece material should be suitable to chip cross section dimensions. This will be better detailed in Section 2.4.
2.2 Specific cutting energy
During the machining process, the cutting power can be determined by directly multiplying the cutting force Fc by cutting speed vc. However, as many cutting parameters directly influence the amount of energy consumed, power is typically normalized by dividing it by the rate at which material is removed from the part, or the product of the uncut chip thickness h and width of cut w and cutting speed vc, as shown in Eq. (2.1).
(2.1)
By keeping cutting speed vc in the expression [W/(m3/s)], u can be understood as the energy per unit volume (King, 1986). This term is the power required from the machine tool spindle in Watt to remove 1 m3 of material per second (Kalpakjian & Schmid, 2000).
From the perspective of workpiece mechanical behavior, Shaw (1995) states that the specific cutting energy u is an intensive quantity that characterizes the cutting resistance offered by a material just as tensile stress and hardness characterize the strength and plastic deformation resistance of a material, respectively.
The specific cutting energy is a very useful concept not only for machining with tools that present defined and undefined geometry but also for forming processes (Shaw, 1995). In machining, cutting forces can be estimated that, in terms of machine tool design, determine the structural needs of machine, and in terms of fabrication process, influence the dimensional and geometric qualities of the finished product.
The specific cutting energy can also be used to estimate the power required in a machining operation of a given material (Ersoy & Atici, 2004). In this case, the engine efficiency should be considered in the calculations in order to take into account the inertia and frictional effects. High specific cutting energy values generate high heat transfer rates and high residual stresses in the part, which can lead to a poor surface integrity (Salmon, 1992). Low specific cutting energy levels generated during the process cause less damage to the part and indicate the quality and cutting tool efficiency (Ersoy & Atici, 2004). It is worth mentioning that, in the latter case, the chip cross section is larger than the cutting edge radius.
Thus, the goal should be to mitigate the specific cutting energy during machining. The specific cutting energy is also considered a good indicator of machinability index of materials and allows us to understand the entire cutting process (Polini & Turchetta, 2004).
The specific cutting pressure is defined as the ratio between the cutting force and the area of the chip cross section, which is analogous to the definition of specific cutting power, found in Eq. (2.1).
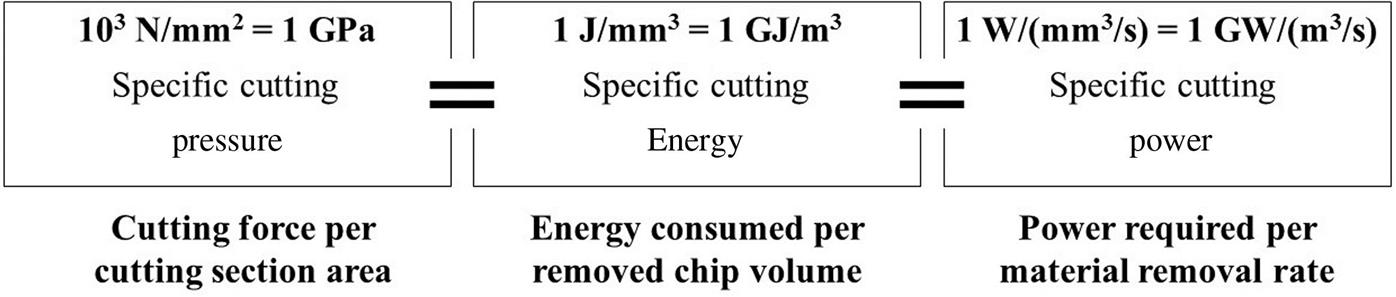
The terminology found in the literature does not provide standardization for the term specific cutting power. Power, energy, pressure, and specific cutting force are terms commonly found. In general, force or specific cutting pressure are used more in machining with defined geometry tools, while energy or specific cutting power are applied to processes with undefined geometry tools (typically abrasive). The most usual dimensional relationship between the various forms of specific cutting power, using the international system, are shown in Fig. 2.3.
Relying on the specific cutting energy concept, the plastic deformation and failure mechanisms inherent in machining processes can be better comprehended. Around ¾ of the total energy is associated with shear in the primary zone (in the direction of shear plane), and ¼ of the remainder stems from secondary shear zone (the interface between the chip and the rake surface of the cutting tool). According to Melo et al. (2003), the energy consumed in cutting is essentially converted into heat. Portions of this heat is transferred to the chip (90%), to workpiece (5%), and to the tool (5%), respectively.
The specific cutting energy can be divided into four parts: shear energy per unit volume, us; friction energy per unit volume, uf; kinetic energy per unit volume, um; and surface energy per unit volume, ua (Black, 1989; Shaw, 1984).
The energy per unit volume resulting from the shear process (us) can be estimated by replacing the cutting force and the cutting speed in Eq. (2.1) by the shear force and shear rate in the primary shear zone.
The energy per unit volume, due to the effect of friction (uf), is consumed by the friction of the chip on the cutting tool rake surface. The energy component may be determined by considering the chip flow rate on the tool rake surface and the frictional force at the chip-tool interface.
The kinetic energy per unit volume (um) required to accelerate the chip is often overlooked, but it becomes especially important when machining at high cutting speeds. This component is also responsible for changing the momentum that the chip suffers when passing through the shear plane. It can be obtained by the momentum force and the shear rate of the chip.
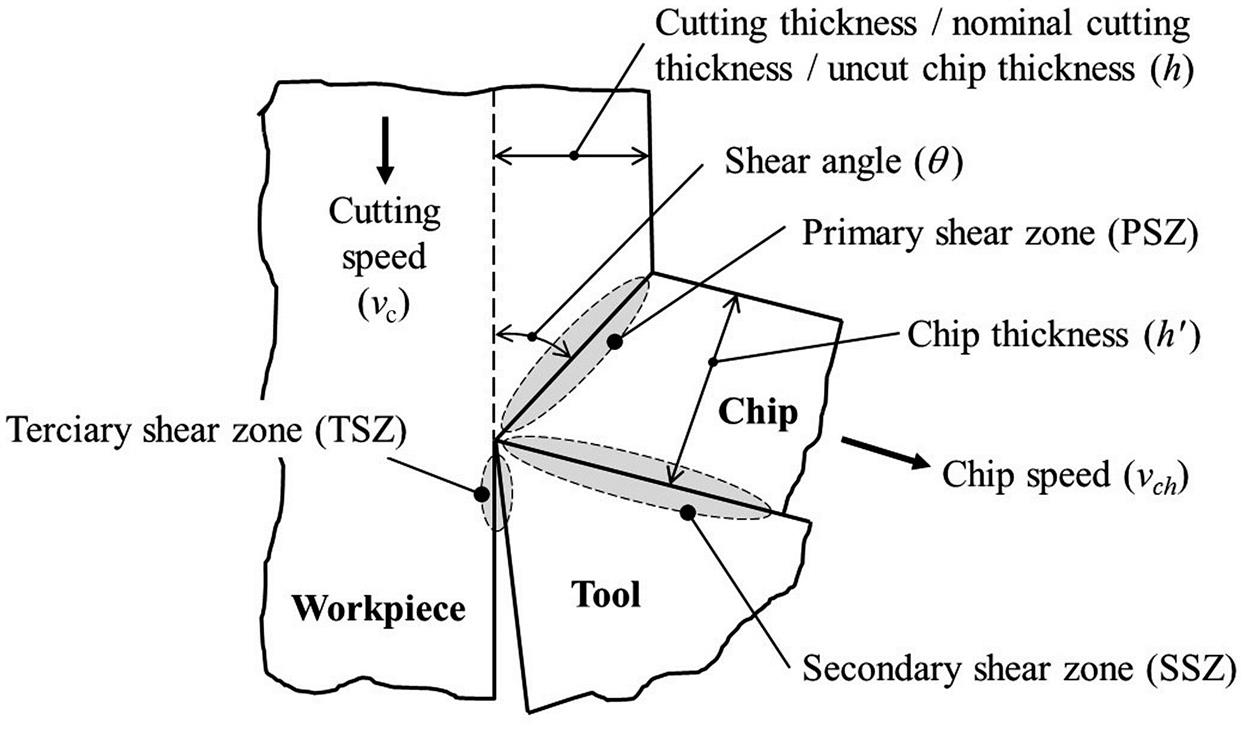
Finally, the energy per unit volume (ua) demanded to produce two new surfaces not machined is given by the ratio between the surface energy of the material being machined and the uncut chip thickness, h. The specific energy (ua) is required, because it is associated to the ionic bonds that support the formation of solid material, but this component is also generally neglected. In conclusion, for applications in macromachining with defined geometry tool in speeds below 900 m/min, the total energy per unit volume required for cutting material can be well approximated by the sum of the shear and frictional portions (us+uf). Fig. 2.4 shows the shear zones inherent to any cutting process.
According to Rodrigues (2005), several factors influence the behavior of specific cutting energy, including those arising from the workpiece material (hardness, shear stress, type of material, chemical composition, and microstructure), tool (substrate and coating, geometry, and wear), cutting conditions (machining process, operation, cutting parameters, and cutting fluid).
In general, the higher the material hardness, the greater its specific cutting energy, but similar hard materials may have different specific cutting energies due to differences in the microstructure and alloy chemical composition. Sulfur, boron, and lead tend to decrease specific cutting energy because they form low resistance coating during chip formation and act as a solid lubricant, reducing friction.
Materials’ tensile strength is directly related to the specific cutting energy, since the chip formation involves shear (i.e., shear deformation in the primary shear zone and friction at the chip-tool interface (secondary shear zone)). However, when machining a material with high shear strength, the specific cutting energy will not necessarily be higher, since its plasticity decreases.
The use of coated carbide tools along with the application of cutting fluid decrease the specific cutting energy, since the friction component is reduced. The specific cutting energy may also be affected by tool geometry. The use of more positive rake and back rake angles decrease the cutting force since they reduce the chip-tool contact length by increasing the shear angle.
Increasing depth of cut, feedrate, and cutting speed tend to reduce the specific cutting energy due to a higher cutting ratio (r=h/h’) and greater thermal softening of the workpiece, respectively. Among the cutting parameters used in machining, the most influential in specific cutting energy is the uncut chip thickness. Finally, finishing operations tend to raise the specific cutting energy due to removal of the smaller chip cross section and the geometry of the tool edge (in general, more rounded, as in abrasive processes). Further details can be found in Degarmo, Black, and Kohser (1997), Gorczyca (1987), Shaw (1984), Daves (1989), Chou and Song (2004), Cohen (1989), Boothroyd and Knight (1989), Kalpakjian and Schmid (2000), and Groover (2002).
Several mathematical models, derived from empirical tests carried out to determine the specific cutting energy with defined geometry cutting tools, have been proposed. Therefore, it is possible to find in the literature a compendium of specific cutting energy values for various materials, machining processes, and cutting conditions. However, the literature is still relatively scarce of tabulated specific cutting energy data in the microscale mechanical machining process. Table 2.1 presents data measured for metallic alloys, including ultrafine grain materials.
Table 2.1
Specific cutting energy data for some metallic alloys obtained by micro- and macro end milling (dry cutting)

All these models are based basically on the materials’ specific constants studied and cutting parameters, such as feedrate and depth of cut. Among the most known models proposed for conventional machining, Taylor, ASME, AWF, Hucks, Kronenberg (1966), Shaw (1995), and Kienzle (1952) are the most commonly found. The Kienzle model in Eq. (2.2) is one of the most widely used today, where the constants ks1 and z are, respectively, the specific material constant for chip cross section of 1 mm2, z is angular coefficient of the slope of the line, and both are obtained from di-logarithmic linearized plot of the specific cutting energy (u) versus uncut chip thickness (h). Corrections of the constants can be implemented to adapt the models to mechanical micromachining (Dib, 2013; Oliveira et al., 2015).
(2.2)
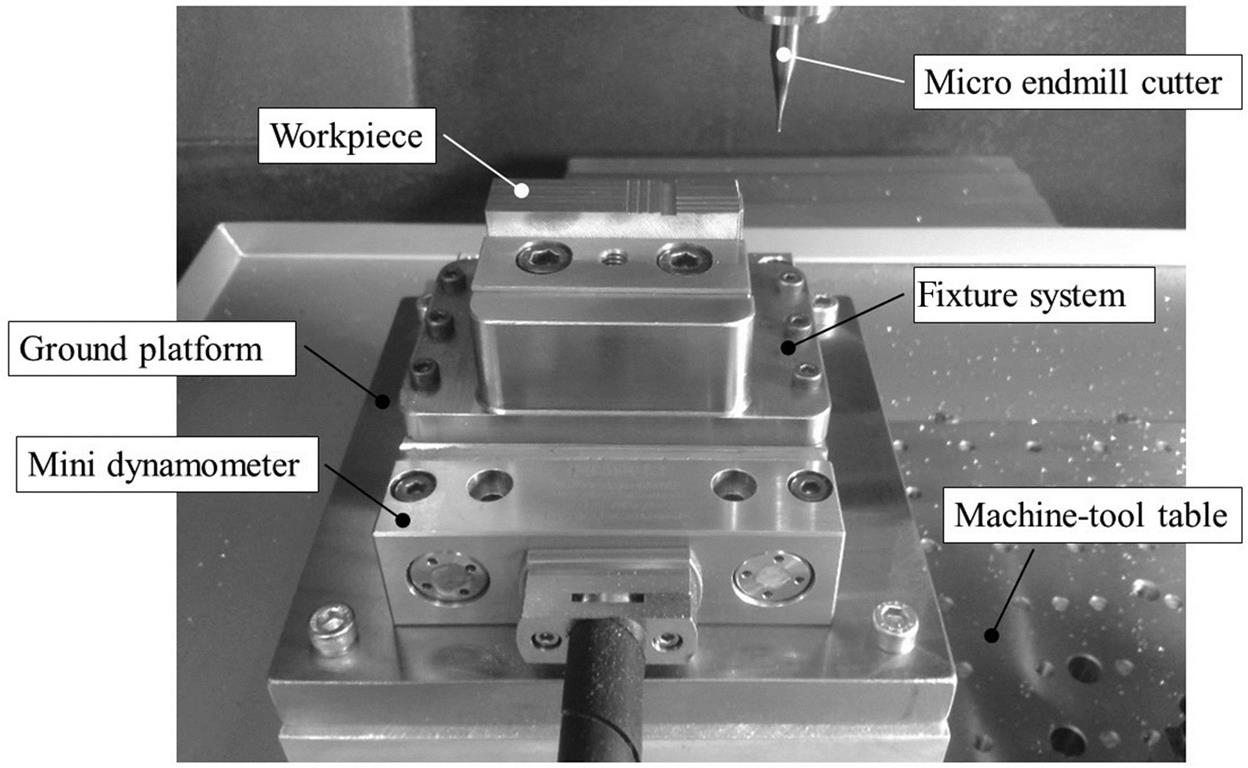
For mechanical micromachining processes, it is appropriate to employ specific piezoelectric dynamometers for small cutting force amplitudes, typically ranging between negative and positive 300 N, and higher sensitivity. A typical mini dynamometer commonly used for micromilling is shown in Fig. 2.5.
When the machining process generates a constant chip cross section, such as microturning and microdrilling, the cutting force signal is constant; and it is possible to determine the specific cutting pressure simply by the ratio of the cutting force and the area of the chip cross section (Ac=w·h=ap·f). However, in micromilling, the chip section is variable, so the cutting force signal presents a cyclical response. In this case, a good approach for the force or specific cutting pressure is to divide the average cutting force (RMS signal) by the average chip thickness (hm).
The magnitudes of cutting force during micromachining operation are in the range of some tenths of a Newton to levels lower than 100 N, because it depends upon thermo mechanical properties of workpiece material and cutting parameters. For example, the specific cutting energy value is similar to that achieved by abrasive grains, generally larger than 10 J/mm3 up to about 100 J/mm3, as will be seen in Section 2.3.
2.3 Size effect
The concept of size effect in machining operations is directly influenced by trade-off between material properties and cutting tool microgeometry. According to Saxena (2000), the size effect may be defined by the effect that nominal dimensions of the workpiece material cause to mechanical properties and manufacturing variables. In general, the mechanical properties affect material response at a different dimension scale. For example, in the field of mechanical testing, particularly the Charpy impact test, the average impact strength decreases with the specimen size, however the energy per unit volume increases. (Saxena, 2000).
In machining processes, the size effect theory has been formulated for the paradoxical result and inversely proportional between the uncut chip thickness (h) and the specific cutting energy (u). In other words, its proposal has emerged to explain the apparently antagonistic consequence, where reduced cutting thickness causes an increase in the cutting zone’s shear stress levels. This theory is based on the increase of yield stress due to the smaller probability of shear take place within very small volumes (Malkin, 1989).
According to Shaw (1996), an increase in u, resulting from the size effect, reflects the decreasing probability of finding microstructural defects in the shear plane. Schroeter (1999) explains the increase the specific cutting energy by the decrease in the number of dislocations with sliding capacity found with decreasing the cutting thickness.
Boothroyd and Knight (1989) formulated that the size effect arises due to the geometrical relationship between the tool cutting edge radius and cutting thickness or the uncut chip thickness. During machining, the resultant force of the cutting process is distributed over the areas where the tool is in contact with the workpiece (i.e., the rake surface and clearance face).
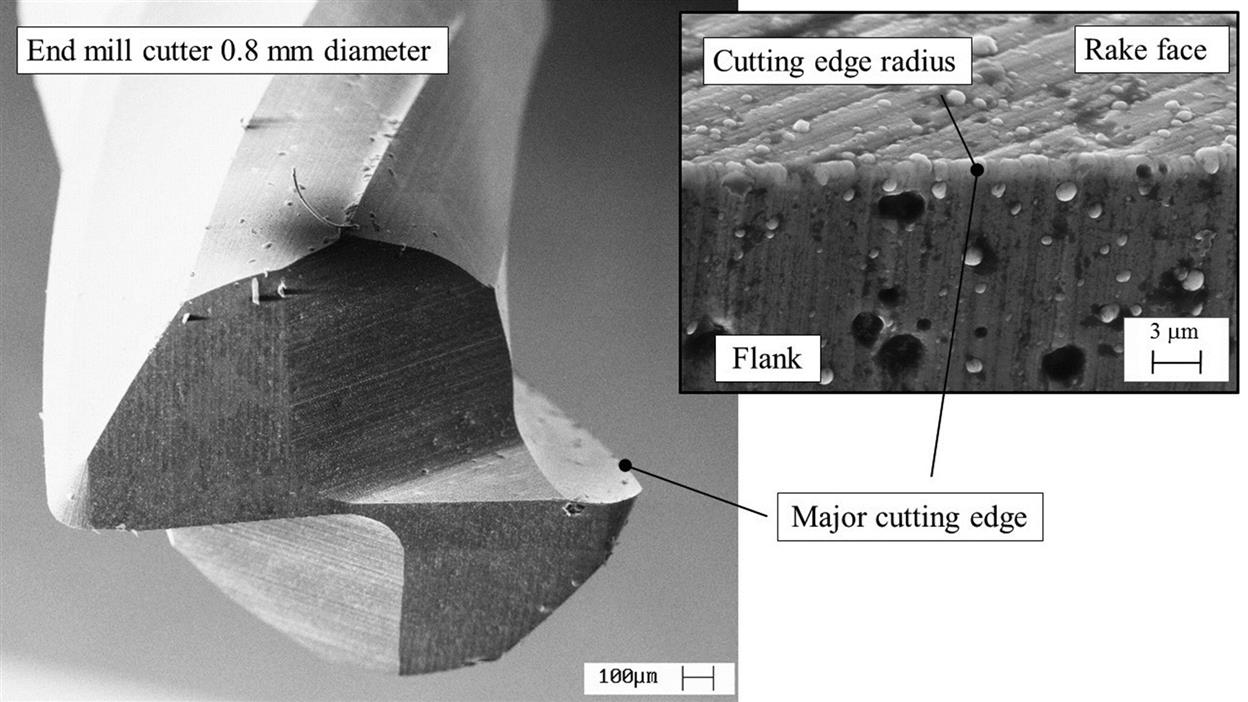
No cutting tool edge is perfectly sharp, as shown in Fig. 2.6. Measurements via scanning electron microscopy (SEM) show that microtools edge radii range from tenths of micrometres to about 5 μm. In the case of nano-machining (e.g., a diamond turning tool) the edge radius reaches a few tens of nanometres. Therefore, there is a tool fillet radius in this region that joins the rake and flank surfaces. In these areas, the action of a constant force is only responsible for deforming the workpiece material and does not contribute to chip removal. This force is called plowing or plowing force. Please, see tool cutting edge radius in an end mill cutter in Fig. 2.6.
For large magnitudes of uncut chip thickness (h), the resultant plowing deformation force acting on the tool edge rounding region is proportionally small compared to the total shear force. However, for small values of h, the deforming force is proportionately larger and cannot be neglected. With an increase in specific cutting energy, represented by the size effect, the deforming force is translated by the large ratio between the tool edge radius and cutting thickness. In this case, the removed chip volume is small when compared to the amount of deformation experienced by the workpiece. A typical size effect curve is shown in Fig. 2.7.

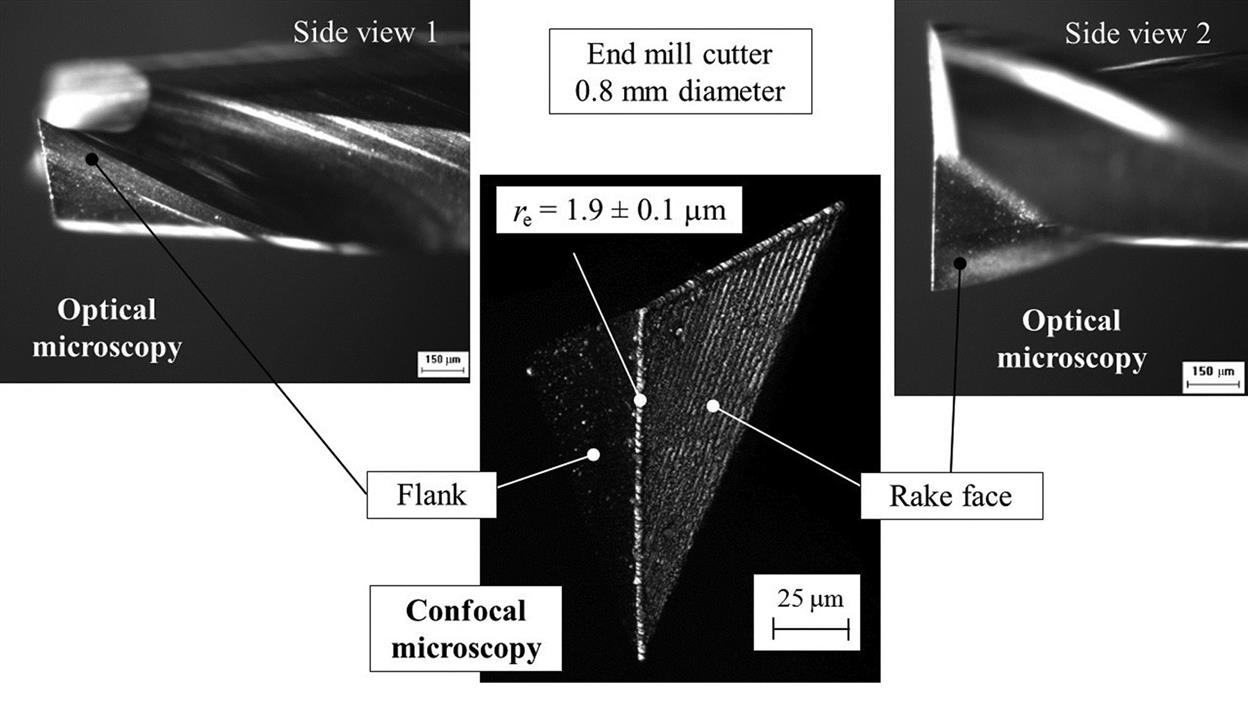
It is important mentioning that most of the tool manufacturers and suppliers for microscale mechanical machining do not provide any information on the values of edge radii. It is evident that the feedrate recommended for microtools (per revolution or per cutting edge) are likely large enough to be larger than the minimum cutting thickness, and consequently, larger than the tool edge radius. To measure the edge radius, it is important to employ a suitable optical system that has computational measurement and image processing tools. The most suitable equipment are the confocal microscopes and optical profilers, as they have great focal field, and allow to set accurately measurement plans. Fig. 2.8 shows how the cutting edge radius of end mill is measured by confocal optical profiler.
Shaw (1995) adds more accuracy to the size effect theory, considering metallurgical aspects in grinding processes. These data indicate that the resulting force between the abrasive particle and the workpiece material determines the size and orientation of the elastoplastic deformation zone on the workpiece, in the same direction of the resultant force. This mechanism can be better realized considering a single abrasive particle of finishing grinding, illustrating the size effect on the specific cutting energy, which is much higher in grinding than in turning operation.
Thus, in finishing grinding, a very small amount of material must be deformed under high specific energy to remove an effective chip volume. Consequently, specific cutting energy will be much higher than what would be achieved during machining with defined geometry tools. Table 2.2 brings a comparative of specific cutting energy values to defined and undefined geometry tools.
Table 2.2
Specific cutting energy for mild steel (Shaw, 1995)
| Machining process | h (μm) | u (J/mm3) |
| Defined geometry tool | 250 | 2.1 |
| Rough grinding | 25 | 13.8 |
| Finishing grinding | 1.25 | 68.9 |
By assuming grinding process a reference for finishing operations, the cutting thickness in relation to the tool cutting edge radius is so small that the chip formation model proposed by Merchant for orthogonal cutting becomes inappropriate. When the effective rake angle becomes extremely negative the chip formation mechanism may be similar to the extrusion process.
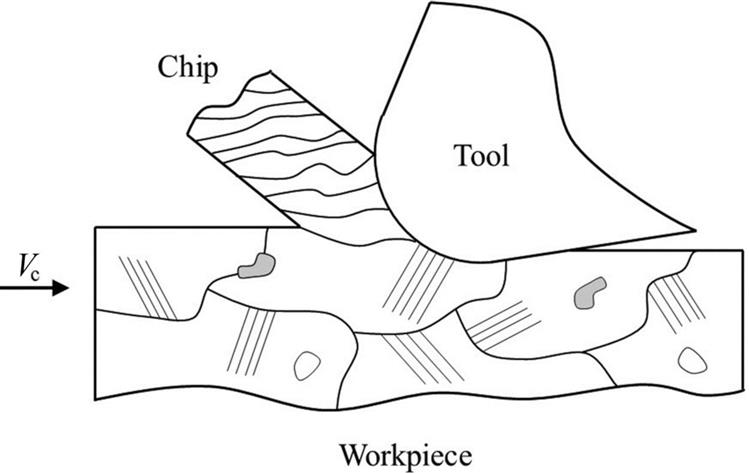
As mentioned in Section 2.2, the specific cutting energy levels in the microcutting with defined geometry tools are very similar to abrasive processes. The reason is that, even for nonabrasive machining, the edge radius of the tool is of the same order of magnitude as the cutting thickness, making the effective rake angle negative, similar to the grinding, and leading to chip formation in an extrusion mechanism. Fig. 2.9 illustrates this similar mechanism of chip formation.

When the volume of material removed decreases in micromachining, some issues take place such as the tool edge radius microgeometry, workpiece material GS, and crystallographic orientation effects; these are considered less influential in macrocutting and become more influential factors on the microcomponents’ dimensional precision and surface integrity (Brinksmeier, Riemer, & Twardy, 2010; Komatsu et al., 2012). Furthermore, from the perspective of the cutting tool, especially in micromilling, the low cutting speed and tool rigidity hinder proper chip formation (Kim, Bono, & Ni, 2002; Robinson & Jackson, 2005).
When cutting scale decreases, the cutting thickness may be compared to the radius of the tool cutting edge, as shown in Fig. 2.9. As a result, cutting can occur with a highly negative rake angle, and a small variation in cutting thickness can influence the cutting process and the chip formation (Malekian et al., 2012; Sooraj & Mathew, 2011). The relationship between the cutting thickness and the cutting edge radius defines the active mechanism of chip removal, which must occur by shearing and cutting of the material. The interaction between cutting thickness and tool cutting edge radius in micromachining can only promote deformation of the material, with no shear and material removal, which directly influences the final surface roughness (Yun et al., 2011). This process of elastoplastic deformation, to which the material is subjected, causes a substantial increase in the value of specific cutting energy.
Chae et al. (2006) and Aramcharoen and Mativenga (2009) presented the concept of minimum cutting thickness (hmin), whereby the chip will not form unless the uncut chip thickness (h) is greater than hmin. When the uncut chip thickness becomes smaller than hmin, as seen in Fig. 2.10, the material undergoes an elastoplastic sliding ocurring at the flank face and plowing due to the tool edge radius. As the uncut chip thickness becomes larger than hmin value, a compression of the part material ahead of the tool promotes shear in the primary shear zone (PSZ). and the whole uncut chip thickness is removed, forming the chip completely.

According to Jackson (2008) and Mian, Driver, & Mativenga (2011), there is an exponential increase in the specific cutting energy with decreasing chip thickness during micromachining. As previously mentioned, it is believed that this increase derives from the lower probability of detecting defects, such as grain boundaries and impurities, which act as stress concentrators in smaller volumes of material to be removed. Thus, the stress required to promote shearing of the material should be higher, causing an increase in specific cutting energy.
This phenomenon has a major impact on cutting forces, process stability, and surface finishing during machining in microscale (Liu, Devor, & Kapoor, 2004).
2.4 Workpiece microstructure scale
Policrystalline solids are composed of small crystals termed grains, which in turn are formed by repetition of the unit cell (i.e., the smallest tridimensional grouping of atoms representative of a given crystalline structure). During the material solidification nuclei are originated in aleatory positions and orientations within material volume which grow up to reach each other at adjacent ends named grain boundaries. These regions are characterized by significant crystallographic disarrangement (Callister, 2007). A pearlite microstructure with evidence of the grain boundaries is demonstrated in Fig. 2.11.

Materials’ mechanical property, such as Young Modulus, present different values because of its dependence on the grain crystallographic orientation. Thus, anisotropy can be defined as the directionality of a given material’s properties. Conversely, isotropic solids present properties which do not depend on a measurement direction (Dieter, 1988).
During the macroscale mechanical machining, the tool cutting edge cuts or removes a great amount of workpiece grains by means of intra- and intergranular fracture since the magnitude of the cutting parameters (e.g., tool feed and depth of cut) are much bigger than GS, even when compared with coarser grains (hundreds of micrometres). In this particular condition, grain boundaries, crystallographic orientations, or crystalline defects are minimized or absent, given that the amount of grains intercepted by tool cutting section area is large. In other words, the workpiece material behaves as continuous, homogeneous, and isotropic during machining because the interferences on dynamic of chip removal and on workpiece surface integrity do not take place.
When machining at microscale, micrometric dimensions of tool feed (f) and depth of cut (ap) can also produce a micrometric chip cross section area (Ac) depending on parameter amplitudes. This dimensional scale, resulting from cutting parameters, is strongly susceptible to the effects of GS, crystallographic orientations, grain boundaries, inclusions, and voids, which cause the material response to be heterogeneous, anisotropic, and discontinuous. Accordingly, undesirable effects can be minimized or eliminated by using material with a finer microstructure. Fig. 2.12 shows an inappropriate relation between the tool cutting edge radius and part GS.
On the other hand, microcutting applied to workpiece materials with coarser GS makes the chip formation and its removal significantly anisotropic and dependent on crystallographic orientations and grain boundaries, whereas finer or ultrafine grains restore isotropic behavior in the microcutting that is typically found in macrocutting. Fig. 2.13 presents a real case where microcutting has grain density (GD) (grains per cutting section area) equivalent to macrocutting.

According to ASTM E-112 standard, GS from 254 to 127 μm mean diameter (ASTM number 1 to 3) are coarse, 90 to 45 μm diameter (ASTM number 4 to 6) are intermediary, and 32 to 22 μm (ASTM number 7 to 8) are fine. Assis (2013) mentions that ultrafine GS are smaller than 5 μm in mean diameter (ASTM number 12 to 14). Fine GS cannot be completely suitable to microcut given that mean GS is still near or larger than cutting parameters related directly to chip formation process (e.g., chip cross sectional area). Therefore, some adjustment of the workpiece microstructure scale to the machining scale is necessary. According to Assis (2013), mean GS between 1 and 5 μm or smaller are sufficient to promote isotropic response for microcutting, so that workpiece material can behaves as a monophasic one (continuous and homogeneous). The difference between two workpiece GS can be seen in Fig. 2.14.

Workpiece GS can be refined by producing subgrain or grain through severe plastic deformation (SPD) at room temperature, strain-induced phase transformations, and dynamic recrystallization of ferrite at warm processing (Silva Neto & Balancin, 2007). Several routes have been developed for GS refinement mainly by using experimental simulations in laboratories. Xianghua et al. (2009) declare that most proposed techniques to refine GS are based on severe plastic deformation such as equal channel angular pressing (ECAP), accumulative roll-bonding (ARB), and severe torsional straining (STS).
Historically, the development of steels, with improved properties of strength and toughness, has been reached by cold rolling and postannealing, in order to produce refined grains. Despite these methods produce nanometric or submicrometric GS, these techniques are still not economically viable for mass production of ultrafine-grained steels because of the need for special devices to generate high deformations (Xianghua et al., 2009).
Nevertheless, the grain refinement processes used to produce downsized components (e.g., ECAP) can be highly useful for products that need some microcutting operation.
A disadvantage is that the techniques based on severe plastic deformation cause residual stresses inside workpiece material, even after a great percentage of internal energy is dissipated to the grain refine process. Thus, subsequent stress relief treatments are usually carried out to assure the practical application of the component (Park et al., 2000).
Several applications for this material grade have been addressed in the automotive industry regarding components for steering wheel, propulsion shaft, camshafts, crankshafts, dampers, universal joints, axles, impact bars, drive shafts, and gear racks. Micrograin aluminum-ferrous alloys are very attractive for applications in automotive and aeronautic industries (Stolyarov et al., 2003).
Ultrafine-grained materials besides being more convenient for microcutting applications, they have both higher strength and toughness. The strength inscrease is justified because the smaller the GS, the larger is the grain boundary area which creates barriers to the sliding of dislocations. The toughness increase, on the other hand, is due to the distribution of stress on the grain boundaries being more uniform (Hertzberg, 1995).
Another relevant issue is related to the elastoplastic deformation mechanism. In coarse grains, their available volume to dislocation movement is larger than that in fine grains, and larger plastic deformation is reached. In fine grains their restrict volume needs higher energy levels to deformation. Thus, elastoplastic responses of the workpiece material due to interaction with tool cutting edge are distinct in conventional cutting and mostly microcutting for which is added the size effect of the process.
2.5 Surface integrity
The term “surface integrity” was quoted by Field and Kahles for the first time in 1964. It is defined as the set of changes in the workpiece surface and subsurface caused by manufacturing process. Thus, the surface changes were initially classified by mechanical, metallurgical, and chemical, among other kinds of transformations. In 1971, at the 21st General Assembly of “College International pour la Recherche en Productique,” surface integrity officially became recognized as a research field (Becker, Santos, & Sales, 2005).
According to Field, Kahles, and Koster (1989), the knowledge of surface integrity describes and controls possible surface changes undergone by the part during its manufacturing process, including its effects on the properties and performance of materials in service. They also report the importance of studying the surface integrity citing as an example the fatigue failure, which usually has nucleated cracks close to or on the component surface.
For Chevrier et al. (2003) surface integrity measures the quality of the machined surface by interpreting the structure of the material surface and subsurface and by analyzing the influence of cutting parameters for variables such as residual stress, surface roughness and cutting force. Thus, the surface integrity can be studied as the structure shown in Fig. 2.15.
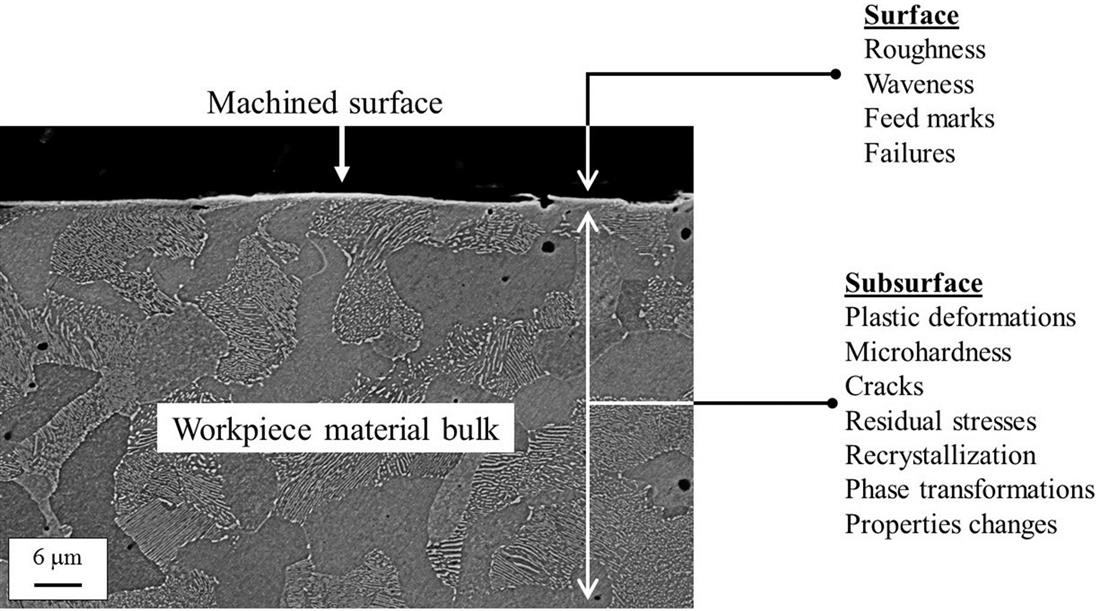
A complete characterization of surface integrity includes the two aforementioned sets and additional information on fatigue strength, besides results of mechanical testing, such as tensile, rupture stress, creep, and others.
The surface analysis of a part can be divided into four different levels: roughness, waviness, feed marks and flaws. The roughness can be understood as fine irregularities, with smaller spacing, resulting from the action inherent to the cutting process caused by the tool. They are usually measured on a small interval length, called “cut off” (sample roughness length) ranging from 0.25 to 2.5 mm. The waviness are surface irregularities whose spacing is greater than the “cutoff.” In general, chatter vibration, bending of the part or tool due to force or cutting temperature represents the sources and causes undesirable waviness.
Feed marks, as its name implies, indicates the relative motion relation between the workpiece and the tool during the machining process. They are marks that denote the predominant directions of surface irregularities. The flaws are unintended interruptions, unexpected and undesirable in the typical topography of the surface of a workpiece. Usually arise through defects in the workpiece material, such as inclusions, voids or cracks.
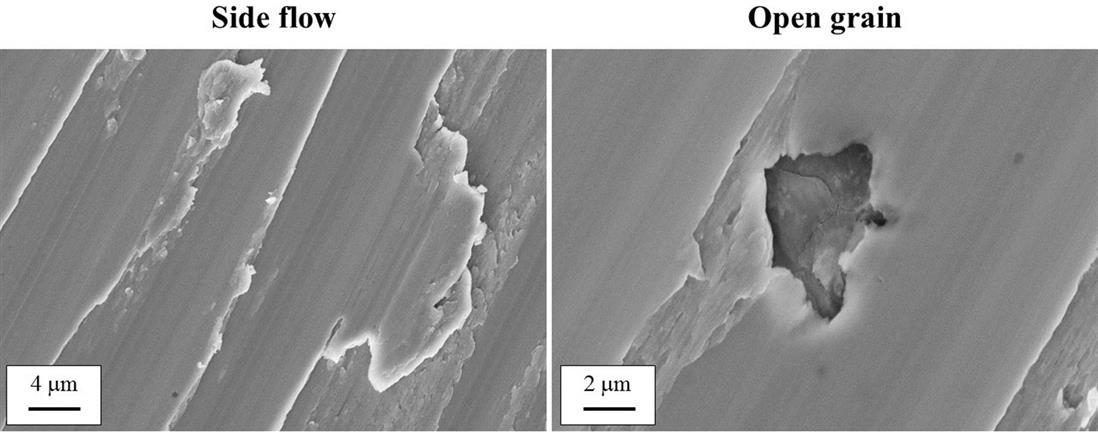
In relation to the topography of the machined surface, two very common changes observed in these evaluations are the phenomena known as material lateral flow and cavity opening (Becker et al., 2005). The material lateral flow, also known as “side flow” is the part material deformation in the opposite direction to the tool feed during chip formation (shear).
However, cavities or open grain as well known is characterized by the formation of cavities distributed over the surface and typically occurs in the machining of brittle materials. These phenomena can be observed in Fig. 2.16.
When concerning to subsurface analysis, the plastic deformation is a common alteration due to the machining process, especially in roughing operations, in which cutting parameters employed are more severe. Usually it can be identified by the appearance of elongated metallurgical structure of the component in the direction of the deformation flow. The plastically deformed burrs may be generated by built-up-edge fragments. Microhardness can be easily increased due to work hardening or more hard phases, or reduced, due to alterations in more ductile phases, depending on the temperature reached during machining. The macro or microcracks have a more latent occurrence when machining brittle materials, precisely because of the absence of plastic deformation capacity. The microcracks, in particular, are extremely harmful to fatigue properties and stress corrosion, as are the initiators elements of such mechanisms, and should therefore be avoided.
Residual stress may be one of the most common variables investigated within the list of indicators of surface integrity. Stress may occur in tension or compression, high or low magnitude, shallow or deep depth. The compressive stress, as typically occurs in finishing operations (grinding and turning) of hardened parts, it is considered beneficial for increasing fatigue life. According Field et al. (1989), the residual stresses tend to be compressive for milling processes.
Recrystallization can take place in the material microstructure within the outmost surface layer during machining operation, when the workpiece reaches temperatures above the recrystallization temperature, allowing the material to return to its original state before the deformation. Phase transformations happen when the temperatures developed in the machining exceed the levels compatible with the transformations. A more common example concerns the machining of hardened steels, wherein the fragile untempered martensite can result from the phase transformation. This hardened layer on the subsurface of the part is called white layer because it does not react to chemical etching used for the detection of the microstructure.
When using microcutting, the effect of the tool edge radius is more pronounced in both, to the chip formation mechanism and to surface integrity of the part. At microscale, particularly surface damage is more likely to be probed, especially when the microstructure scale is not in the same range of the cutting conditions (Rodrigues et al., 2012). Table 2.3 (Section 2.5.5) will summarize the main defects in the generation of surface via microcutting processes.
Table 2.3
Main defects and causes in micro cut surface (Assis, 2013)
| Surface damage | Main features | Some causes |
| Cavities | Discontinuities in the machined surface. | Due to the nature of the friction condition in the contact region of the workpiece with the cutting edge. |
| Debris | Discontinuities in the machined surface. | Crack nucleation and propagation in front of the cutting edge, with subsequent removal of material. |
| Dimples | Small depressions in the surface of the workpiece. | Formation and coalescence of microvoids along the path of the fracture process that involves a considerable level of localized plastic deformation. |
| Severe plastic flow | Material severely deformed with flow oriented toward the cutting direction. | Plastically deformed material, belongs to the latter part of the chip. |
| Incomplete chip formation | Material lateral flow on the workpiece surface. | It occurs mainly when the feed per tooth is smaller than the tool edge radius. |
| Grooves | Scratches or asperities along the workpiece surface due to the passage of the cutting edge. | This has its origin from the burnishing caused by the tool flank surface. |
| Grooves of micro chips | Deeper grooves than regular grooves formed by feedrate which is also parallel to the cutting direction. | Similar to the formation of grooves but with generation microburrs that may adhere to the surface of the part. |
| Chatter marks | Straight grooves parallel to each other and perpendicular to the cutting direction. | Related to the tool-workpiece with increased cutting speed and tool wear. |
| Prows | Small bumps on the machined surface. | Formed in machining with low cutting speed; it is associated with a Built-up-edge. |
| Burrs | Workpiece material portion shifted to the axial direction of the tool. | Side flow, plastic bending and tear of the workpiece material due to combination between cutting conditions (e.g., tool wear) and part properties (e.g., ductility). |
| Elastic recovery | Elevations unrelated to surface roughness, generated by the machining and/or dynamic effects of the machine tool. | Effect of different levels of resistance to deformation among crystal grain in the polycrystalline microstructure. |
| Material scraps | Material adhered to the surface of the part. | Originating in debris formation, cavities or voids. |
| Smeared material | Material plastically deformed in the opposite direction to the tool feed. | It arises due to the increased ratio between the feed force and the cutting force. |
| Steps | Subsequent sensitive undulations to severe plastic flows. | Its occurrence is related to the formation of severe plastic flow. |
| Cracks | Microcracks that penetrate into the workpiece surface. | Change in mechanical properties between the grains, residual stress and fatigue on the part surface. |
| Voids | Discontinuities in the machined surface. | Differences in yield strength between the phases of the microstructure. |
In the following subsections various results, from the literature, on the effect of workpiece material GS in the main surface integrity variables in micromilling operation will be presented and discussed. New tool edges were used for each cutting condition to eliminate possible tool wear effects on results of surface integrity. In order to improve the knowledge on these effects some results are also included for milling operation in macroscale and variation of cutting parameters for the purpose of comparison.
2.5.1 Burr formation
Fig. 2.17 shows the top view of micromilled channels in low carbon steel named COSAR 60 (similar to AISI 1016 with microadditions) with GS of 11 and 0.7 μm, employing cutting speed of 135 m/min without cutting fluid, 800 μm tool diameter and 5 μm cutting edge radius, 32 μm depth of cut, and feed per tooth of 0.5 μm/tooth (fz<re), 5 μm (fz=re) and 10 μm/tooth (fz>re). The arrows indicate the feed direction and tool rotation.
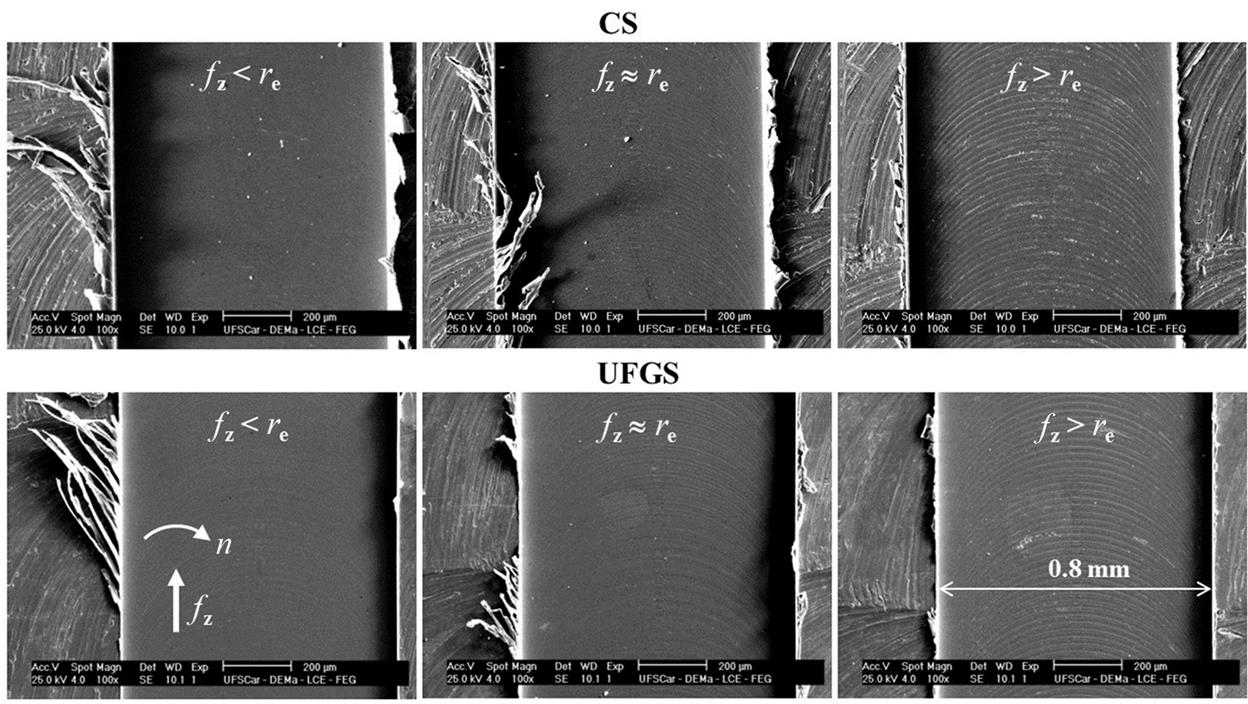
Based upon the Vogler et al. (2004), the minimum cutting thickness was not reached with the lowest tool feed (hmin≈1.5 μm), resulting in large burr in up-milling cut for both materials microstructures, but it is possible to observe that the surface finish of the channel bottom is better and more uniform, as well as the thickness of the needle burrs for the burr formed with the ultrafine grain steel (UFGS) which may be attributed to its microstructure with smaller GS. The thickness of the needle type burrs can be derived from the GS or part material grain clusters (Santos, 2016).
When the feed per tooth is increased to the similar size and larger than cutting edge radius, the size of burrs reduced, but this effect is more prominent in UFGS. The feed with the same size to the cutting edge radius is not rather sufficient to promote the reduction in burrs’ size, showing that the edge radius still exerted a deleterious effect on the chip formation, even for the UFGS. By overcoming the hmin and the tool edge radius, cutting thickness and consequently, chip cross section area were sufficient to form the chip and to attenuate burr formation, especially in UFGS, which presents lower plasticity than conventional steel (CS).
Micromilling tests to cut microchannels in AISI 1045 steel (12 μm and 43 μm ferrite and pearlite GS, respectively) were performed varying the end milling scale, i.e., macro and micromachining. The cutting speed used in the tests was vc=60 m/min, dry machining, with two different diameters of the cutter, i.e., 0.8 mm (micromilling) and 2.0 mm (macromilling) both with 2.7 μm edge radius. The feed per tooth and depth of cut were varied in order to verify the burr formation and the bottom finishing of the milled channel. The length machined by each tool was 13 mm. Figs. 2.18 and 2.19 show the workpiece microstructure and machined channels (Moreira, 2012).
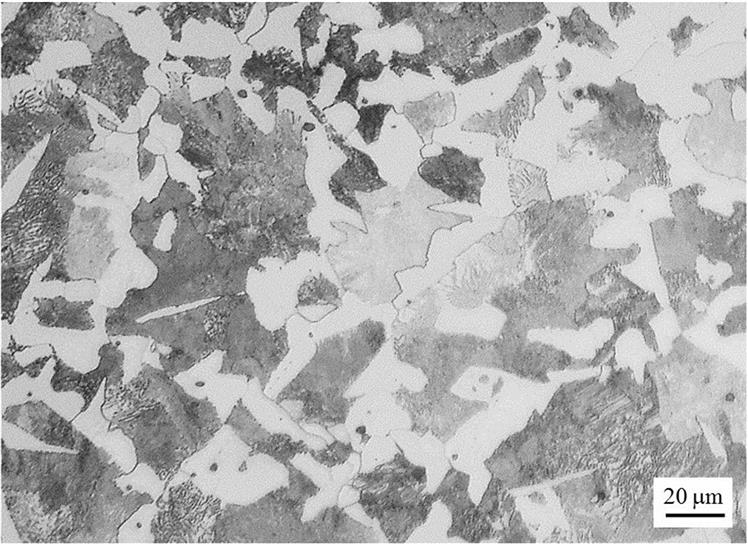
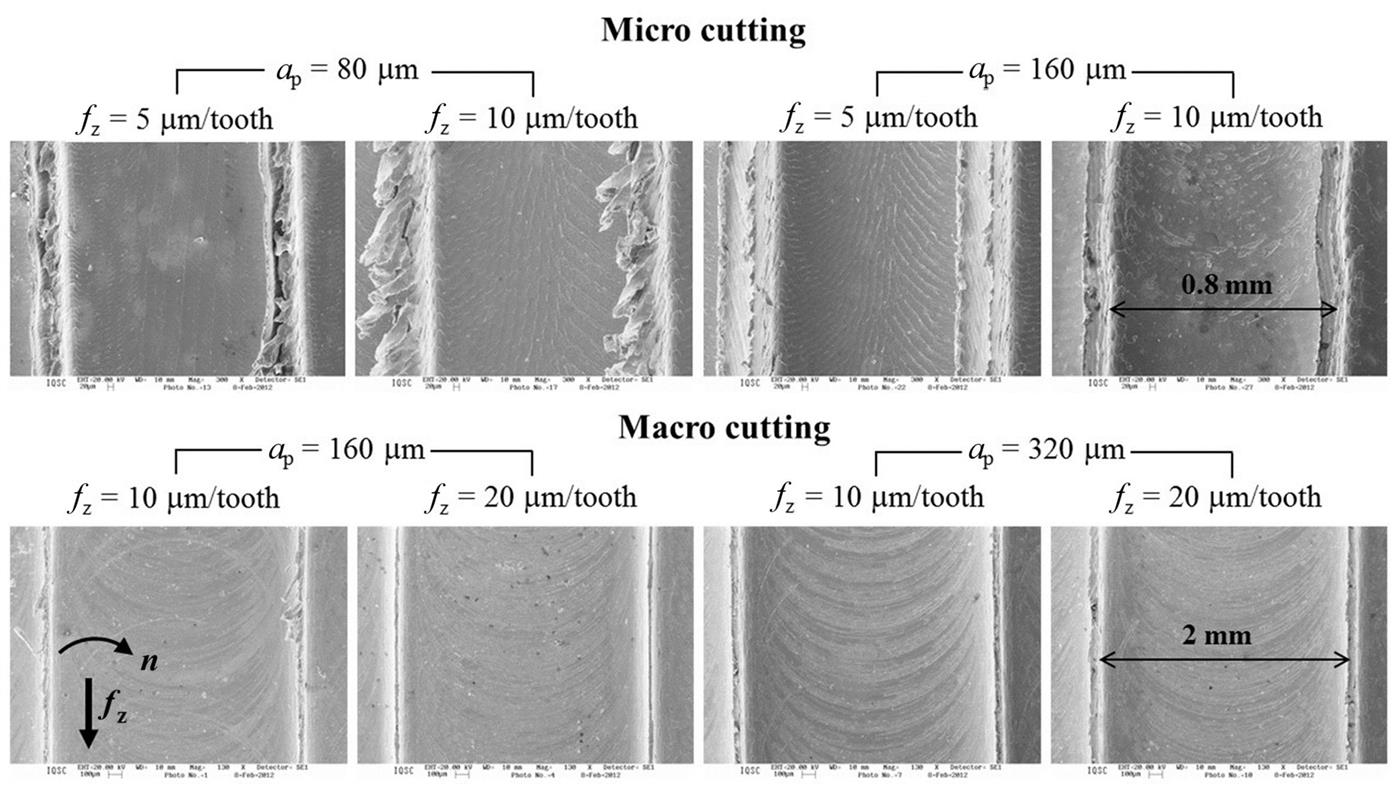
Fig. 2.19 shows that the larger diameter tool generated needle-like burrs when cutting the workpiece with the smallest feed per tooth and depth of cut, and very small burrs for higher feed and depth of cut. The condition of maximum feed per tooth and minimum depth of cut generated a burrs-free, since the microstructure scale was more compatible with machining condition, i.e., the GD (Grain Density) is 18 ferrite grains/mm2 and 1.4 pearlite grain/mm2. Moreover, the channel bottom topography presented well-defined feed marks.
In micromilling test, burrs formation was much more significant, particularly for smaller depth of cut. In this case, the microcutting in a workpiece of coarse microstructure amplified the anisotropic response, i.e., the GD was only 2.3 ferrite grains/mm2 and 0.2 pearlite grain/mm2. The anisotropic effect, in this case, is more clearly observed in the surface texture of the channel bottom as well as waviness through the tool path. When comparing the same cutting conditions for the two tool diameters, it appears that the macromilling generated better channels form and less finishing errors. The size effect of the geometric relationship between feed per tooth and edge radius of the tool is not decisive, feed per tooth was always larger than hmin and re. The results showed that there is a strong relationship between the tool diameter and GS related to burrs formation on the top of the walls generated during machining of channels. When comparing with former results it is possible to assert that microstructure has a strong effect on defect formation when the scale of the material removal process is decreased.
Lauro et al. (2014) developed a study of the effect of austenite GS (40 to 500 μm) in the channel surface finish and the formation of burrs at the micromilling AISI H13 Steel (45 HRC). It was used depth of cut of 25 μm, 0.5 mm cutter diameter, 2.77 μm edge radius, 77 m/min cutting speed and 1 μm/tooth feed per tooth. Fig. 2.20 presents both microstructures and micromilled channels.
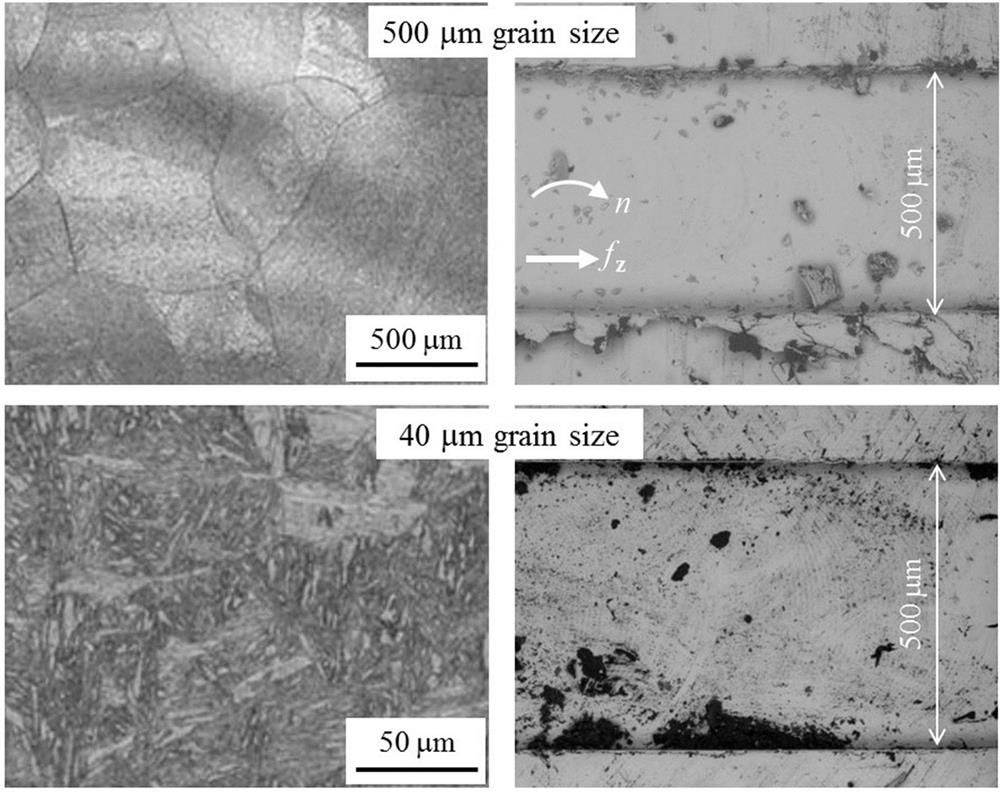
The results presented in Fig. 2.20 show that material with larger GS generated burrs of the primary type for down-milling, due to the adopted feed per tooth being close to the minimum cutting thickness (fz/re=0.36). This effect of cutting edge radius (size effect) in the material with finer grains was significantly mitigated since there was practically no burr formation even in the down-milling side where the generation of burr is more common, since the chip thickness decreases to zero.
Although both materials present high hardness values added to the size effect and anisotropy, large grains may experience higher strains, given that larger grains allows longer distances for dislocation movement, which favors the burr formation and maximize its size.
2.5.2 Chip formation
Assis (2013) conducted several macro- and micro-milling tests under dry cutting condition in COSAR steel UFGS (0.7 μm) and CS (11 μm) to evaluate the effect of GS and the ratio fz/re on chip formation. Macromilling adopted cutting speed vc=800 m/min, depth of cut ap=0.5 mm, radial depth of cut ae=2 mm, and two feed conditions 0.025 mm/tooth (fz=re) and 0.300 mm (fz>re), two flutes cutter with 16 mm diameter (PVD-TiN), re=25 μm. Micromilling adopted cutting speed vc=135 m/min, depth of cut ap=0.032 mm, radial depth of cut ae=0.130 mm, and two feed conditions 0.005 mm (fz=re) and 0.018 mm (fz>re), two flutes cutter with 0.8 mm diameter (PVD-TiN), re=5 μm. The machined lengths were 50 mm and 5.5 mm in macro- and micro-milling, respectively. Fig. 2.21 shows the chips produced by tests.
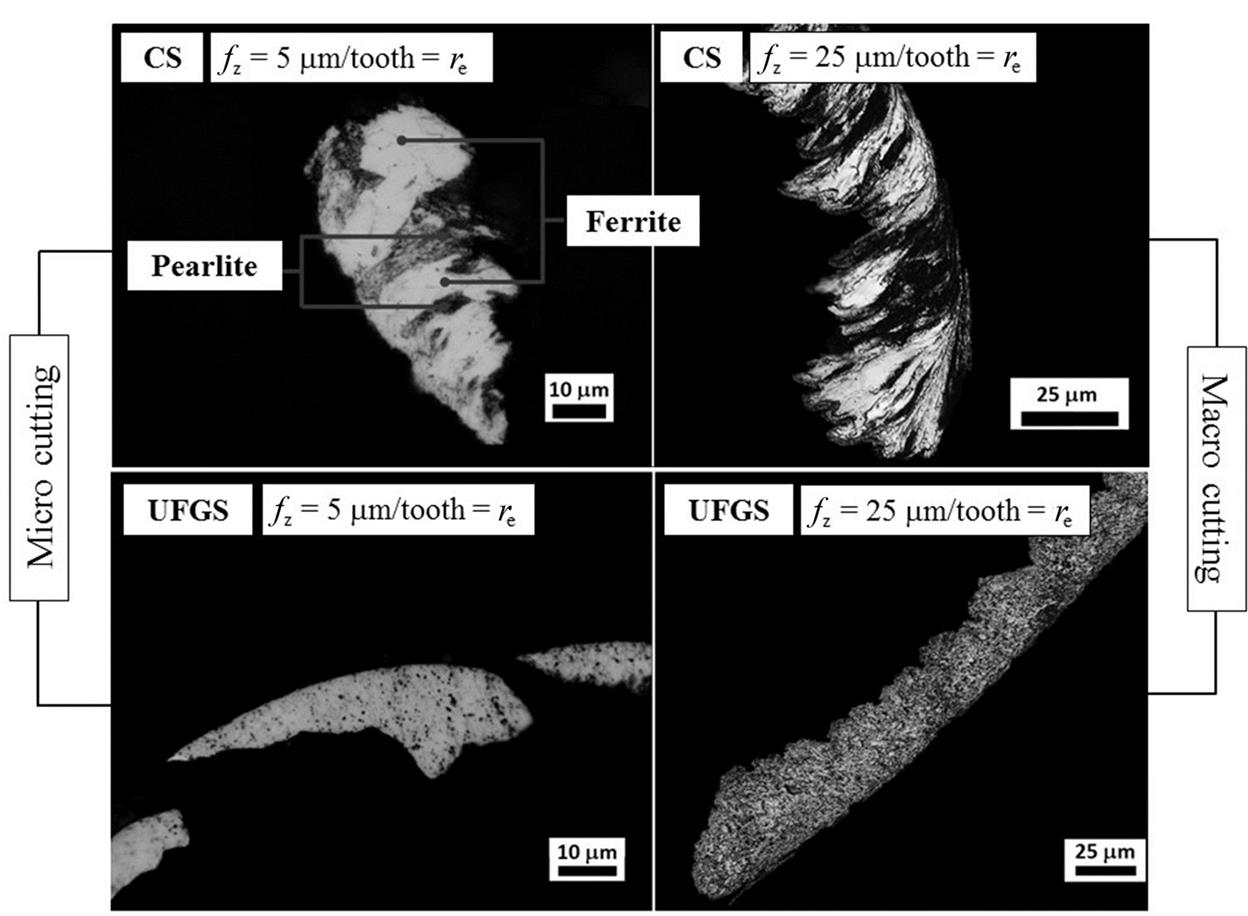
Images from optical microscope depicts the morphology of chip formed with fz≈re (micro- and macro-milling). The images show elongated ferrite grain between pearlite grains for the CS material. The change in chip formation mechanism in the CS sample has occurred due to the presence of a harder phase (pearlite) and more ductile (ferrite). When machining the UFGS sample, the chip revealed juxtaposition of lamellae, tendency to form segmented chip (serrated) and a little deformed microstructure due to the reduced GS microstructure and consequently, demanding higher energy amount to deform them. This formation process occurred despite of a more pronounced size scale, since the machining took place for fz=re condition.
By employing fz>re condition, both in the micro- and macro-milling, as shown in Fig. 2.22, it is possible to observe a pattern similar to the chip formation mechanism when the materials were milled with former cutting condition (fz=re). Only exception is made for the trend of segmenting for fz=re probably occurred due to the more significant effect of tool edge radius on the chip deformation of the UFGS material.
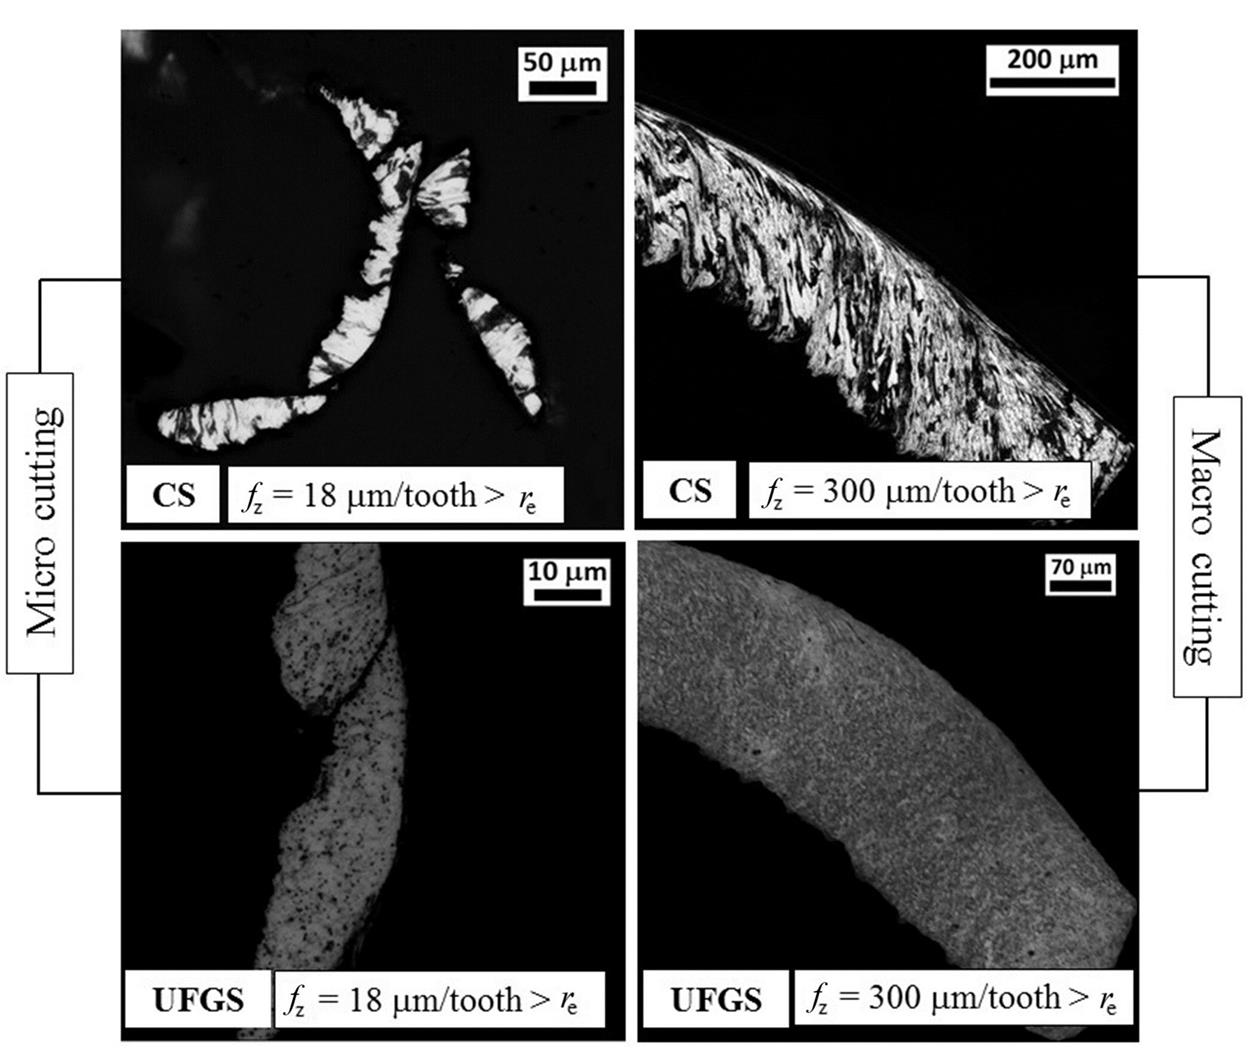
The chip formed in the micro and macroscales from the CS sample, using fz=re condition is called quasi-shear-extrusion and has been observed by Simoneau, Ng, and Elbestawi (2006). Fig. 2.23 shows in detail the ferrite grain extruded by two perlite grains (sheared deformation).

The formation of this type of chip has not observed in UFGS sample, as the metallurgical modification provided a homogeneous microstructure with the presence of a single phase (ferrite). The phenomenon did not occur in the machining fz>re for CS material due to mitigated size effect.
The relationship between feed per tooth and tool edge radius of 12:1 in macromachining and about 4:1 in micromachining shows that for this condition the microstructure behaves homogeneously during material removal, irrespective of the presence of a second phase (with difference in hardness). The homogeneous behavior of the microstructure can also be related to the GD already mentioned. Macromilling of the CS sample with fz=re=25 μm resulted in GD=45.5 ferrite grains/mm2, while micromilling of the UFGS part with fz=re=5 μm presented GD=162.8 ferrite grains/mm2. Besides, GD is only 0.7 ferrite grains/mm2 when milling CS material at microscale with fz=re=5 μm. These results show how the relationship between cutting and microstructure scales can become the chip removal mechanism anisotropic.
Finally, the microstructural uniformity of the chip with ultrafine grains can be beneficial to the cutting stability, whereas the cyclic extrusion of the ferrite phase in larger grains may cause some vibration during chip formation, which can affect the surface integrity of the machined part.
Figs. 2.24 and 2.25 show images of chips produced in macro- and micro-milling of AISI 1045 steel. Oliveira et al. (2015) showed that the chip formation mechanism depends on the machining scale, especially when associated with a microstructural scale of the workpiece not adjusted to machining in microscale. The machining conditions and the workpiece material were the same as shown in Fig. 2.19.
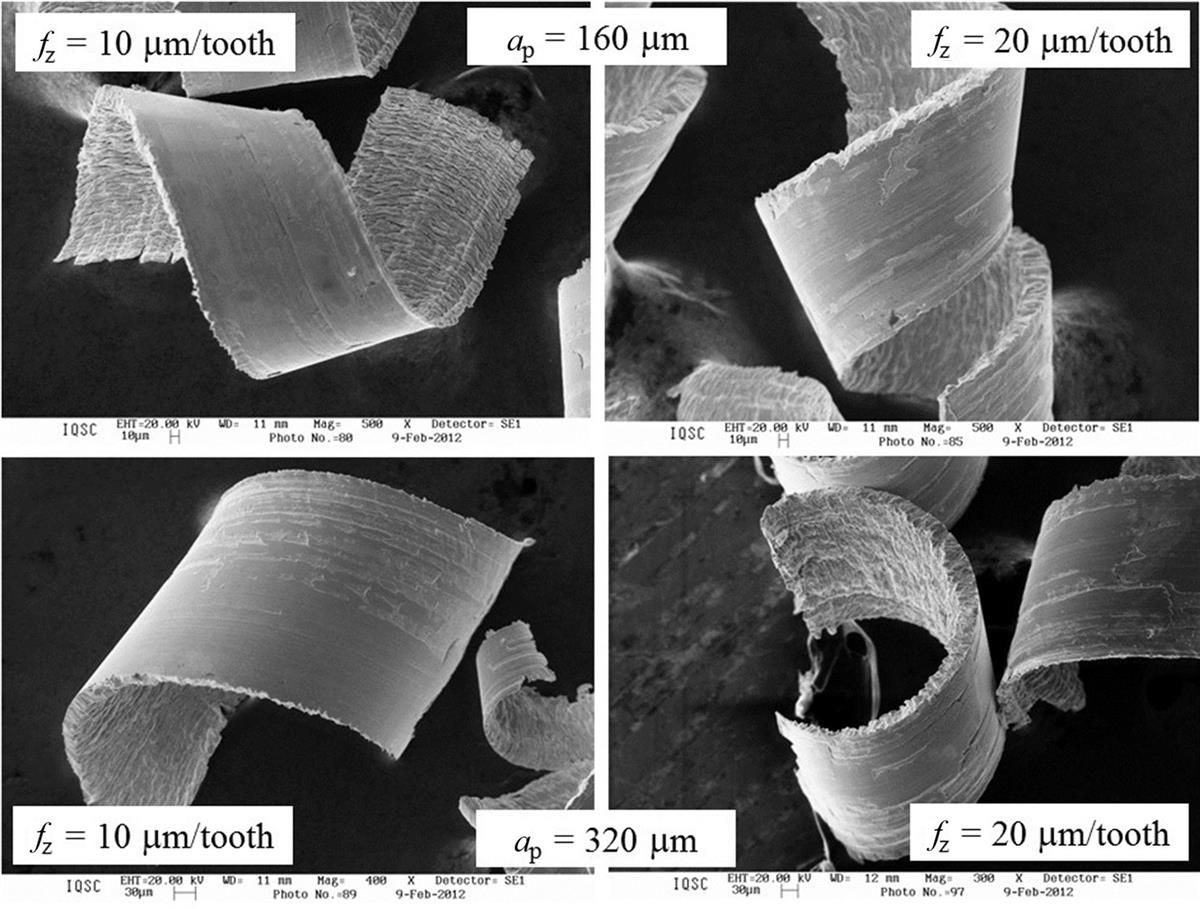
It is note that chips resulting from macromilling are helical for smaller ap/rε ratio and curved for larger ap/rε ratio. The chips presented a defined morphology from its formation, with fairly smooth part-tool interface and free surface with uniform shear fronts and lamellae.
However, Fig. 2.25 shows that the chips produced in micromilling are distinct from those formed in macromilling. This morphological difference stems from its distinctive deformation mechanism involved by tool geometry-part material.
The chips had round and thin ends, resulting from the interaction rε and ap, but the main difference lies in the chip segmentation into smaller lamellae characteristic lengths. During chip formation, there is an uneven deformation along its cross section, tending to open into a helicoidal and spliting apart in its thinnest portion. These deformations takes place in defined sections of the chip when its thickness becomes thinner around the tool cutting edge radius.
In conclusion, it can be seen that a reduction of workpiece material GS is key for micromachining process in order to have an isotropic, continuous and homogeneous, especially when analyzing the chip formation process, which reflects on the quality of micromachined product.
2.5.3 Roughness
Surface finish of microparts is one of the most important technical requirements for micromachining. Due to very small dimensions of some functional parts, subsequent finishing processes are more difficult to be performed. Therefore, the final roughness usually is achieved by microcutting process.
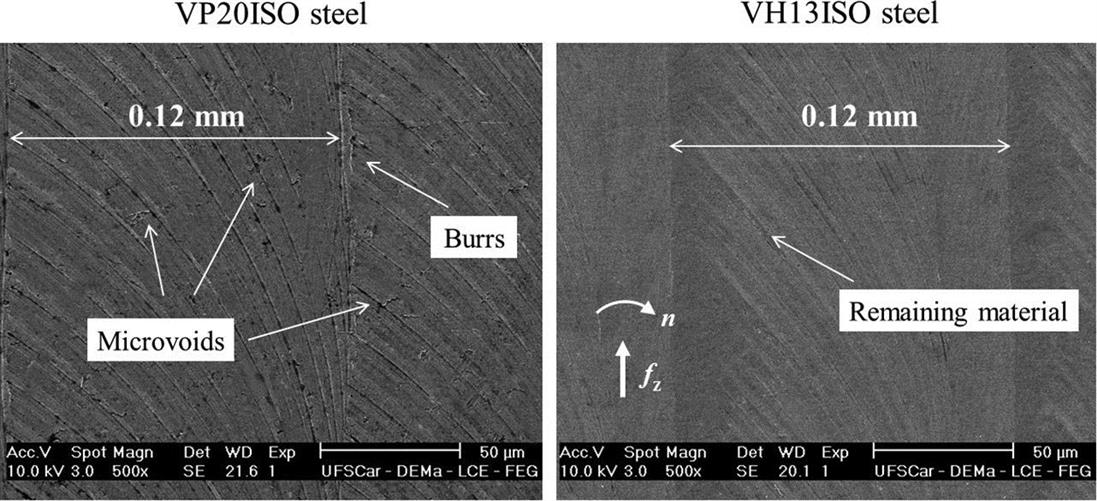
Bodziak et al. (2014) investigated the effect of microend milling process on surface integrity of tool steels used for molds and dies manufacturing. VP20ISO (30 HRC) and VH13ISO (45 HRC) steels with coarser GS (Fig. 2.26) were micromachined in dry condition by using endmill of 0.7 mm diameter, 2 flutes, tungsten carbide substrate, TiSiN coating, 10 μm/tooth feed per tooth, 60 μm depth of cut, 0.12 mm axial depth of cut, 70 and 60 m/min cutting speeds, respectively. The tool path was linear at transverse and longitudinal directions, with 35 mm long.
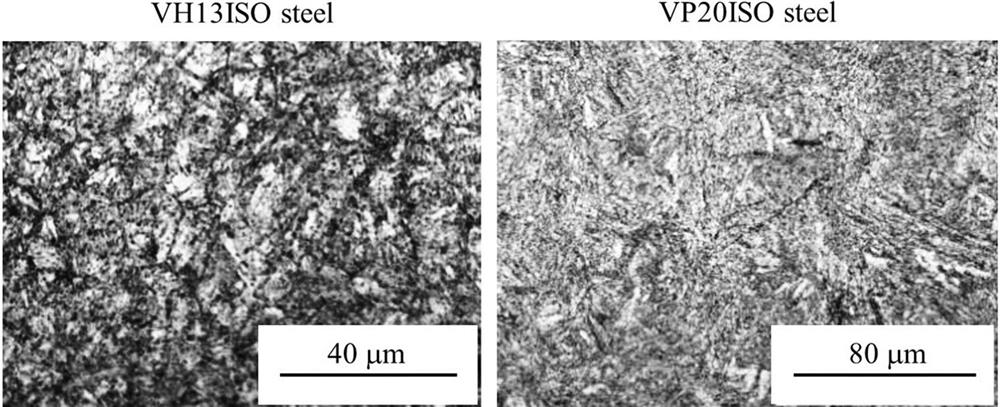
This microstructure is more difficult to be microcut due to the coarser austenitic GS that originated the martensitic microstructure which is formed by needles-like fine laths.
VP20ISO steel presented smaller Ra roughness values at transverse direction attributed to the smaller hardness and abrasiveness since VH13ISO steel contains greater chromium percentages as well as concentrations of silicon and vanadium. Additionally, the roughness values at transverse and longitudinal directions were distinct indicating the anisotropic effect, as seen in Fig. 2.27.
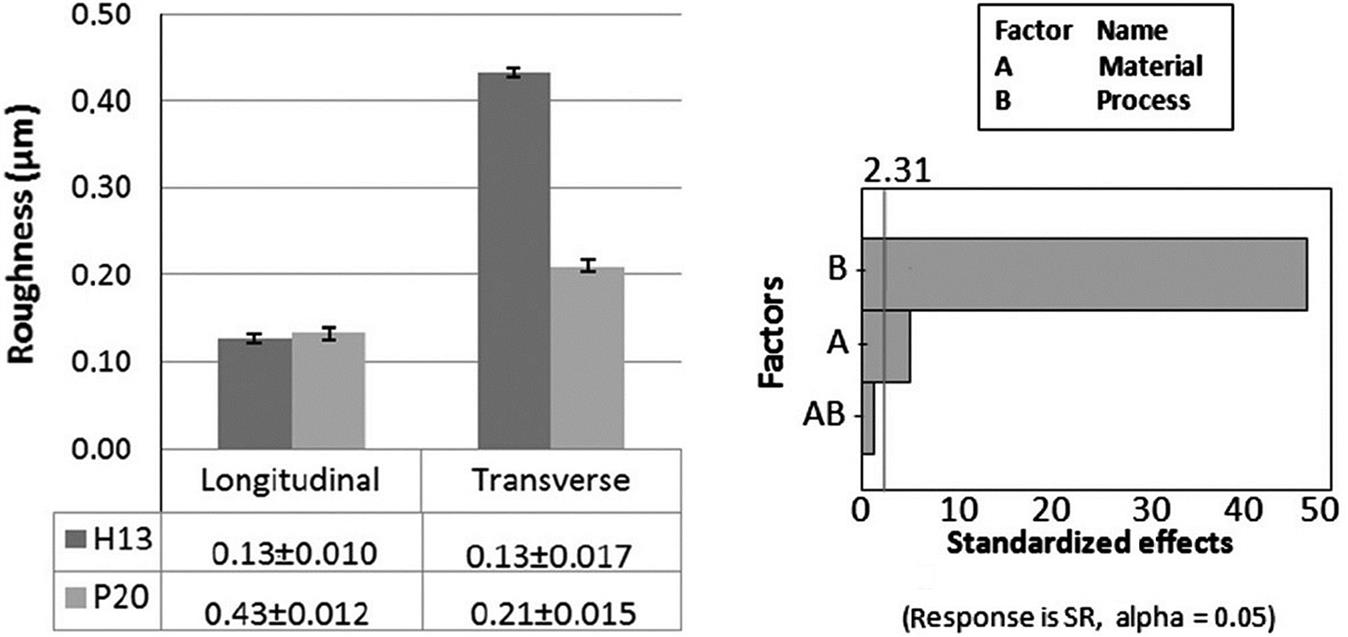
Despite roughness of VP20ISO steel is by about 50% smaller than that from VH13ISO steel, damages over machined topography were found because the size effect is more significant even if roughness value is very small. Fig. 2.28 shows that micromilled surface of VP20ISO steel presented burrs and protuding feed marks whereas VH13ISO steel did not produce any surface damages or flaws. These damages may be attributed the larger plastic deformation capacity presented by VP20ISO steel.
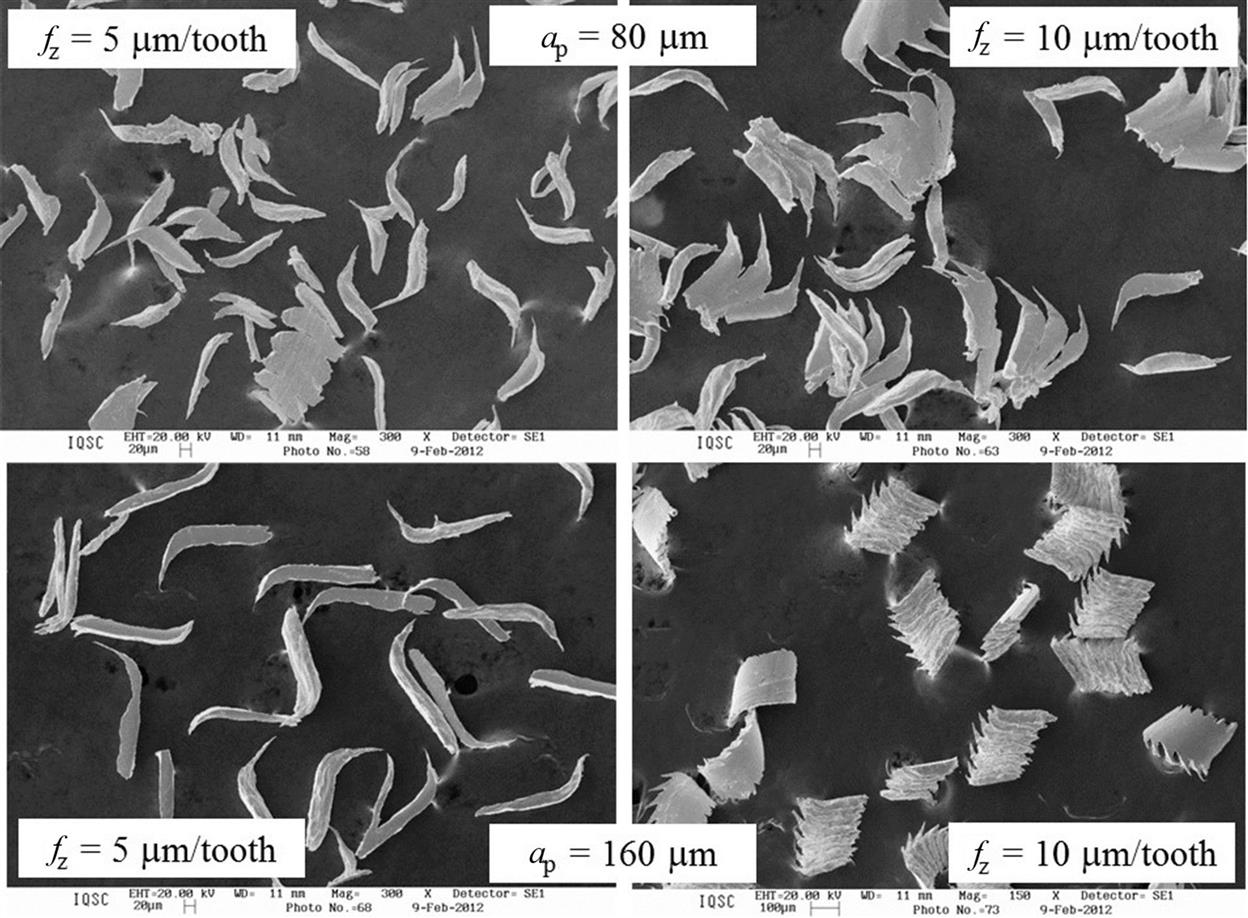
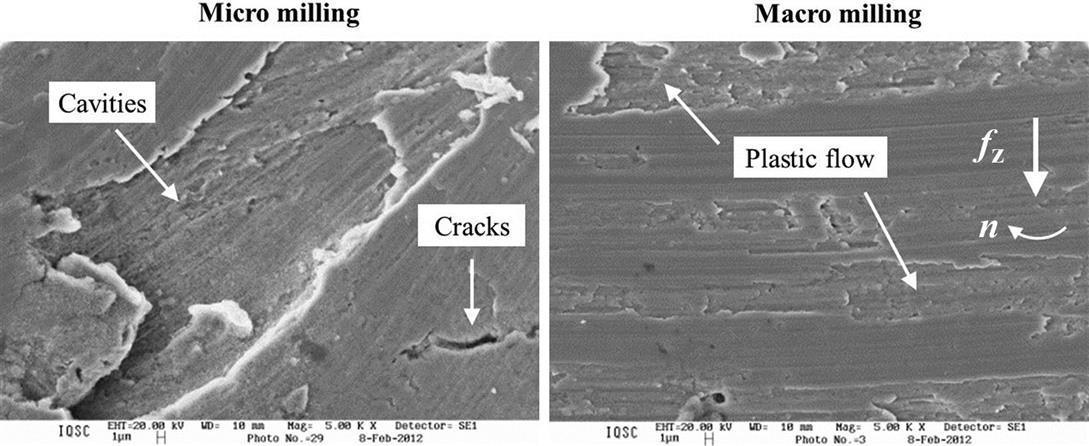
Similar results were found when milling the AISI 1045 steel at the same microcutting conditions presented in Fig. 2.19. Fig. 2.29 shows that microend milling caused more significant damages over cut surface than macroend milling when applying the same depth of cut and tool feed. The main identified damages were cracks and open grains which can be addressed to ferrite and pearlite grains.
Finally, Assis (2013) verified that smaller workpiece GS decreased the part roughness when feed per tooth was lesser, equal and greater than tool cutting edge radius size in microscale end milling (Fig. 2.30). The same cutting conditions presented in Fig. 2.21 were used except for cutting speed (25 m/min or 10,000 rpm).

In terms of qualitative roughness evaluation, damages found in micromilled surface such as grooves, smeared materials, prows and microvoids were identified mainly for larger GS (images highlighted in Fig. 2.30). These defects were probed for all feeds per tooth applied and they took place mainly in workpiece with low hardness (CS) due to anisotropy effect from material microstructure GS.
2.5.4 Microhardness
Surface and subsurface microhardness of the workpiece can also be affected depending on cutting parameters, part thermomechanical properties and tool cutting edge microgeometry. Fig. 2.31 shows the microhardness gradient measured beneath the piece surface after milling in dry condition COSAR 60 steel with 11 μm CS and 1.7 μm UFGS GS at macroscale cutting by using 25 mm tool diameter, 2 tungsten carbide inserts coated of Al2O3, 600 m/min cutting speed, 0.05 mm/tooth feed per tooth, 0.5 mm and 3.0 mm depths of cut, 19 mm radial depth of cut and 65 mm cutting length.
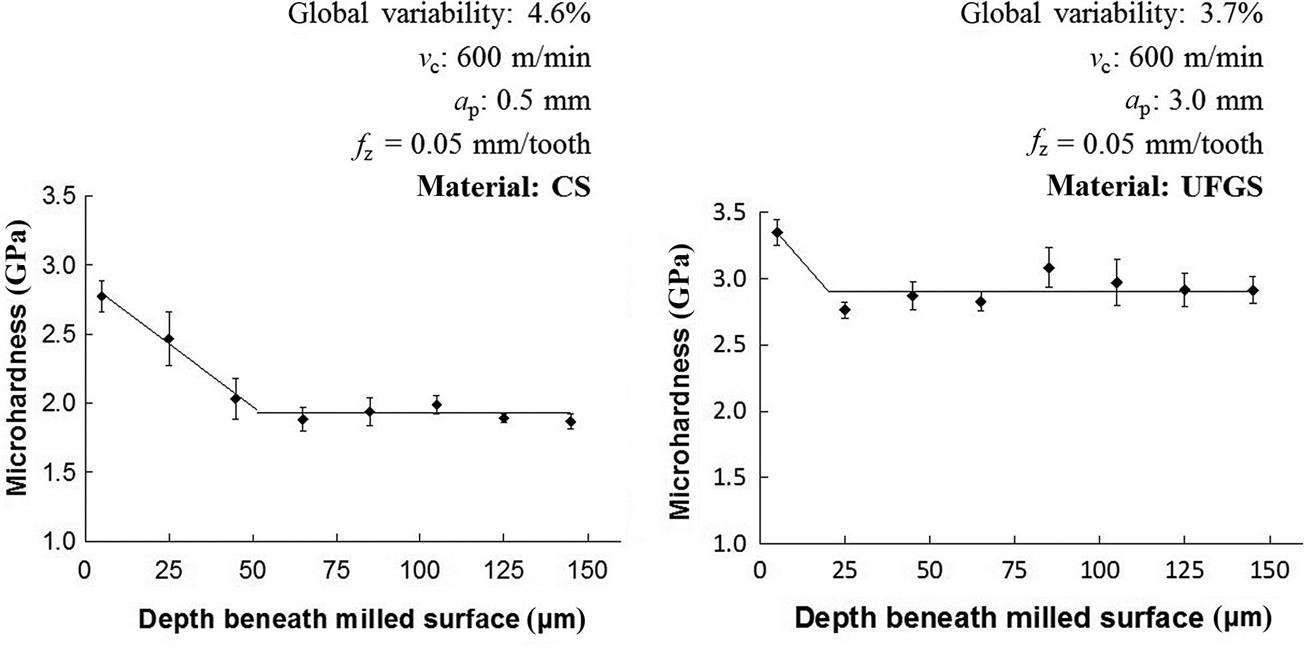
According to Rodrigues et al. (2012), despite the microhardness close to machined surface was higher for UFGS material, its relative increase from the bulk microhardness was lower. This result indicated that UFGS tends to sustain its bulk microhardness at low depth from the outmost surface. Even at high cutting speed, larger depth of cut and macroscale milling the material had a small increment of microhardness and a shallow affected layer. The CS material presented deeper hardened layer due to its plasticity especially at high cutting speed.
Assis (2013) has also investigated the influence of the workpiece GS and milling scale on part surface hardness. By considering the same workpiece materials and cutting conditions quoted in Fig. 2.17, the author obtained the results presented in Fig. 2.32.

It is observed that no microhardness variation was identified for CS material when micromilled. However, a small decrease (9%) of surface microhardness for UFGS material took place for both tool feeds. On the other hand, a microhardness increase of 54% and 38% for both CS and UFGS samples, respectively, when macromilling was applied with fz≈re. The squeezing effect of the tool cutting edge radius was more evident for macromilling. Under macromilling at higher tool feed condition, CS sample presented an increase of up to 25% in microhardeness while UFGS remained constant statistically. The greater strength of the UFGS material when compared to that of CS material hampers its cold hardening and favors its workpiece surface integrity. This work hardening of the CS material is justified by significant plastic deformation of its microstructure next to machined surface by analyzing Fig. 2.33.

2.5.5 Microstructural damages
The extension of surface and subsurface damages take place usually in macro machining processes around 150 μm below the machined surface. However the affected layer depth depends strongly on cutting conditions, machining process, tool geometry and thermomechanical response of the workpiece material. The depth of defects due to microcutting trends to be lower but the damages can extend because of the size effect. Additionally, as aforementioned in Section 2.5.3, low roughness generally lower than 1 μm Ra does not exclude occurrences of defects in the surface topography such as those shown in Table 2.3.
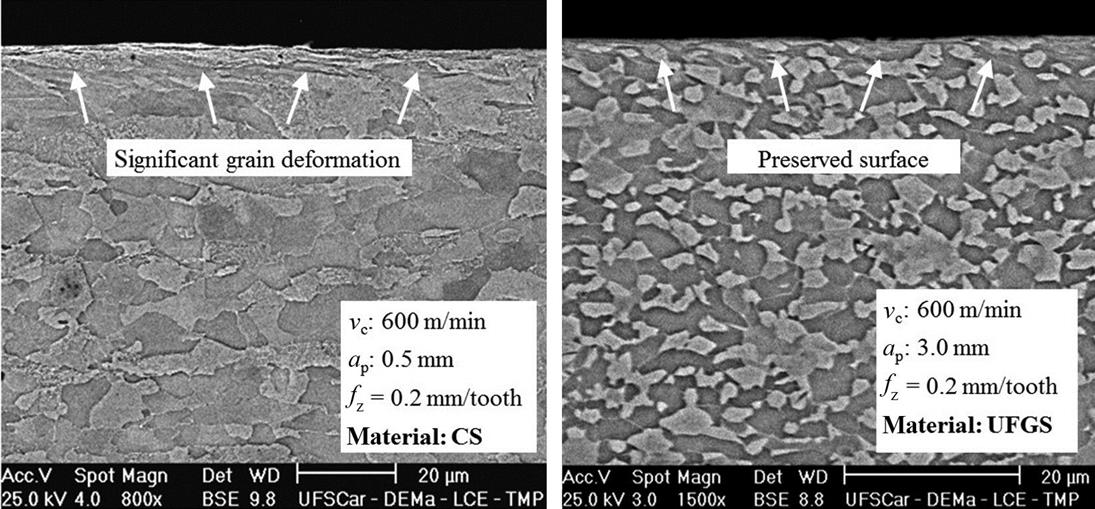
Assis (2013) has identified a few of defects depicted in Fig. 2.33 when milling at micro- and macroscale COSAR 60 CS and UFGS materials.
The machined surfaces of the UFGS material presented less microstructural alterations when compared to CS samples. Localized defects as microburrs and cavities were probed, however without presence of severe plastic deformations. Cavities and voids more significant in quantity and size were recurrent in the CS workpiece as well as a substantial plastic deformation of microstructure near cut surface.
These damages in CS material are resulted from distinct hardnesses of ferrite (softer) and pearlite (harder) when the tool cutting edge cut these phases during machining. Moreover, grain boundaries can nucleate cracks or concentrate hard particles which contribute to generate certain damages such as open grain, cavities and cracks. All defects were more pronounced when milling at microscale.
Similar results are shown in Fig. 2.34 when milling at macro- and micro-scale AISI 1045 steel by using machining condition presented in Fig. 2.19.
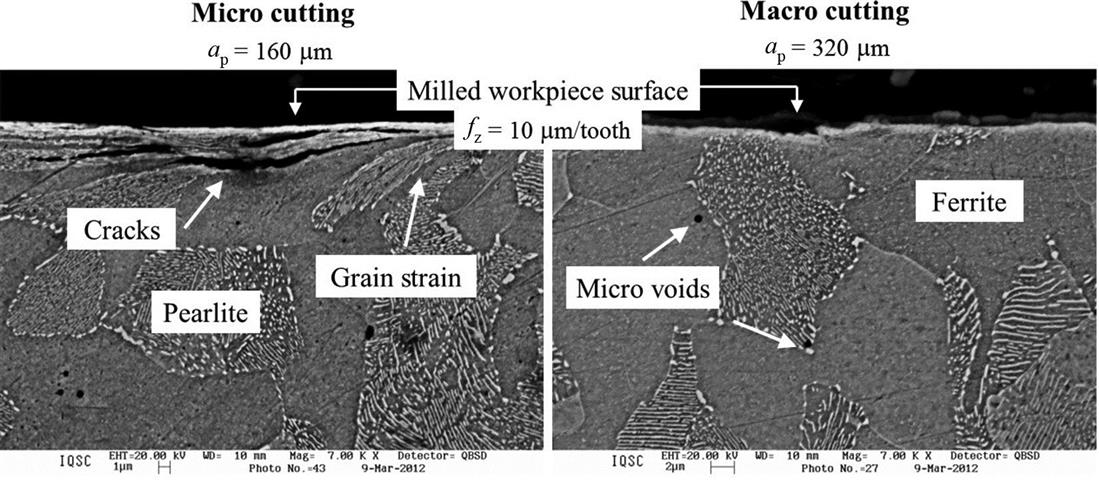
The microstructure below the micromilled surface was plastically deformed by work hardening in the direction of the tool feed as well as cracks were nucleated at the pearlite-ferrite interface by reaching aproximately 5 μm depth. Cementite structure were clearly extended in the feed direction. Cracks were produced by plastic deformation (cold hardening) inside and surface of the workpiece material. This surface integrity was strongly impaired due to greater specific cutting energy (size effect) related to the larger grain mainly of the pearlite (43 μm size). On the other hand, macromilling preserved the workpiece surface integrity even with twofold depth of cut. Both pearlite and ferrite were not deformed and cracks were not nucleated inside microstructure. Only located microburrs were identified.
Fig. 2.35 (Assis, 2013) shows equivalent behavior of surface defects for the same workpiece materials presented in Fig. 2.31.
CS microstructure was deformed more significantly near the milled surface. This plastic response is resulted from larger GS which allow more strain within grain. Additionally, higher cutting speed contributed with grain stretching given the major shear rate for which workpiece material was submitted during machining.
However, very shallow depth of plastic deformation was found in UFGS material even when applying larger depth of cut. The higher hardness reached by grain refinement imposed strain resistance and preserved the surface integrity of machined surface. The decrease of GS increases the grain boundary area which act like barriers, hindering dislocations movement and increasing the strain resistance of material. These results are in accordance with the microhardness behavior presented in Fig. 2.31.
Finally, Bodziak et al. (2014) found intense microstructural deformation near micromilled surface of the VP20ISO and VH13ISO steels even with higher hardness than that of AISI 1045 and COSAR 60 steels (Fig. 2.36).
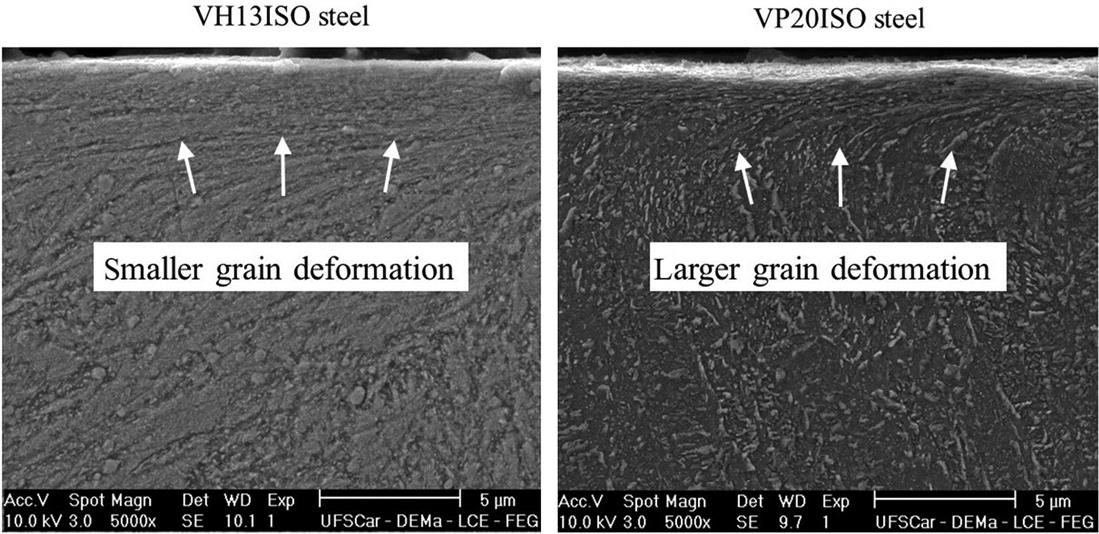
Despite the severe grain stretching other defects like cavities, cracks, voids and phase transformations were not observed. If reproduced in molds and dies machining, these functional surfaces will tend to increase the life time of the tooling once surface topography (skewness <0 and kurtosis <3) and residual stresses (compressive) are suitable. Fatigue mechanisms are greatly minimized under these surface topography conditions.
Plastic deformations were more meaningful in VP20ISO steel given its lower hardness, i.e., a certain higher ductility even with a martensitic microstructure.
2.5.6 Size effect
Fig. 2.37 shows the decrease of the specific cutting energy as a function of feed per tooth when milling slots in RSA 6061-T6 aluminum alloy at microscale cutting in transverse and longitudinal direction by using 2 flutes end mill cutter, tungsten carbide substrate, TiNAl coating, 2.7 μm cutting edge radius, 1 mm endmill diameter, 160 μm depth of cut, 60 m/min cutting speed, no cutting fluid and 13 mm cutting length.
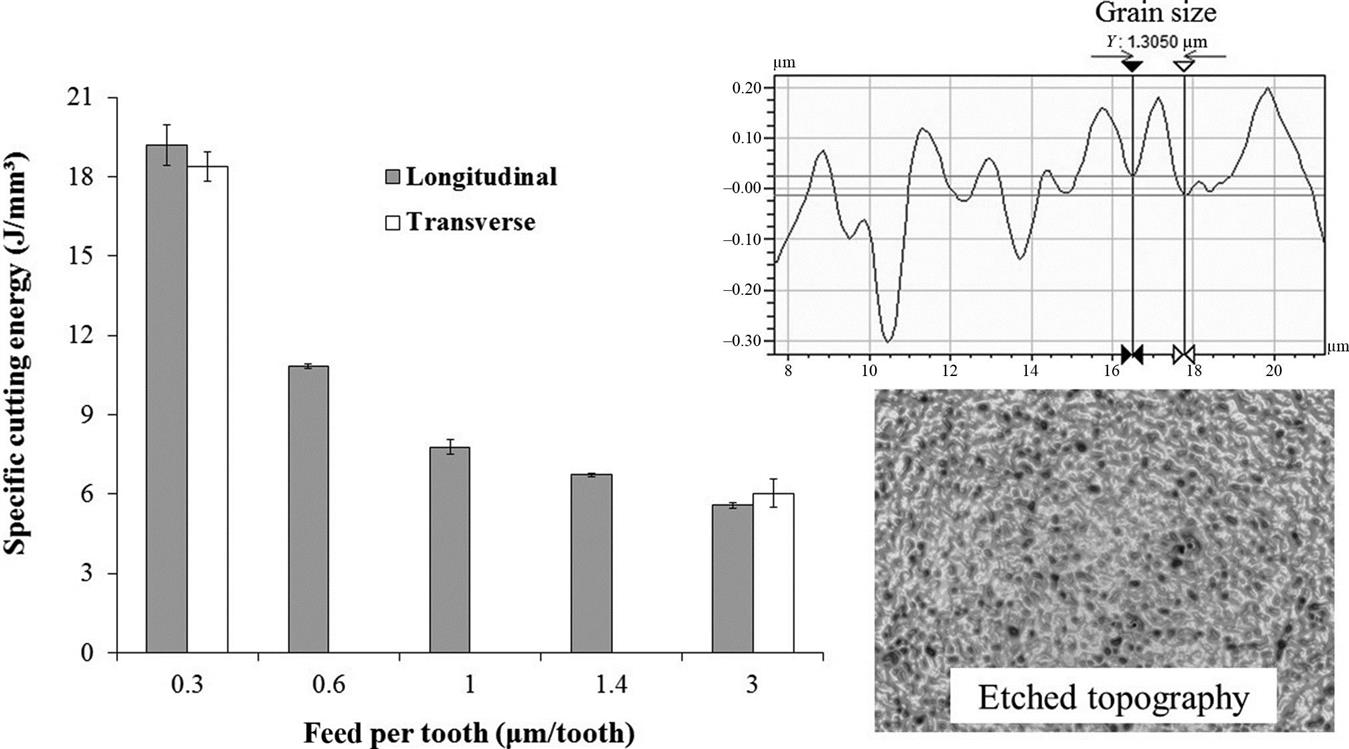
It is observed and statistically demonstrated that tool path direction regarding workpiece extruding direction did not influenced the specific cutting energy when larger and smaller tool feeds were used, respectively. When matching part microstructural and machining scales the chip removal process behaved as isotropic, continuous and homogeneous. In addition, specific cutting energy increases more significantly from 0.6 μm/tooth tool feed because minimum cutting thickness is around 0.68–0.89 μm/tooth according to Oliveira et al. (2015). When feed per tooth is smaller than the minimum cutting thickness elastoplastic deformations are more prominent over surface and subsurface instead of shear deformation.
Rigatti (2010) and Rigatti et al. (2013a) evaluated the relationship between workpiece GS and size effect by analyzing specific cutting energy when milling at macroscale cutting the same workpiece material and cutting conditions such as cited in Fig. 2.31. A full factorial design was implemented with 3 factors and 2 levels that is cutting speed (100 and 600 m/min), depth of cut (0.5 and 3.0 mm) and tool feed (0.05 and 0.2 mm/tooth). Radial depth of cut and cutting length were kept constant in 2.0 mm and 75 mm, respectively. Coolant and lubricant fluids were not considered.
Fig. 2.38 depicts the curves of the specific cutting energy as a function of feed speed for CS and UFGS materials. The results show that UFGS presents larger values of the specific cutting energy when compared to that for CS irrespective to feed speed used. With decrease of feed speed (equivalent to feed per tooth), the size effect is characterized by an inscrease of specific cutting energy for both workpiece materials. Low amplitude of model coefficient R2 is resulted from remaining martensite and bainite grains disperse on UFGS material matrix after thermomechanical process for grain refinement.

Although UFGS material having higher specific cutting energy, this material is less sensitive to size effect since the feed speed exponent is lower than that of CS. The multiplicative factor of the feed rate in the model equation is the specific energy to the feed speed of 1 mm/min.
Rigatti et al. (2013b) also evaluated the relationship between feed per tooth (fz) and GS of the workpiece material on cutting force, friction at the chip-tool interface and specific cutting energy under dry macromilling of CS (COSAR 60 with 11 μm GS), 700 m/min cutting speed, 500 μm depth of cut, 2 mm radial depth of cut, and 5, 11, 25, and 70 μm/tooth feed per tooth (fz). A two flute carbide endmill tool coated with PVD- TiNAl layer, 16 mm diameter and 25 μm edge radius was used in tests. Fig. 2.39 shows the main results.
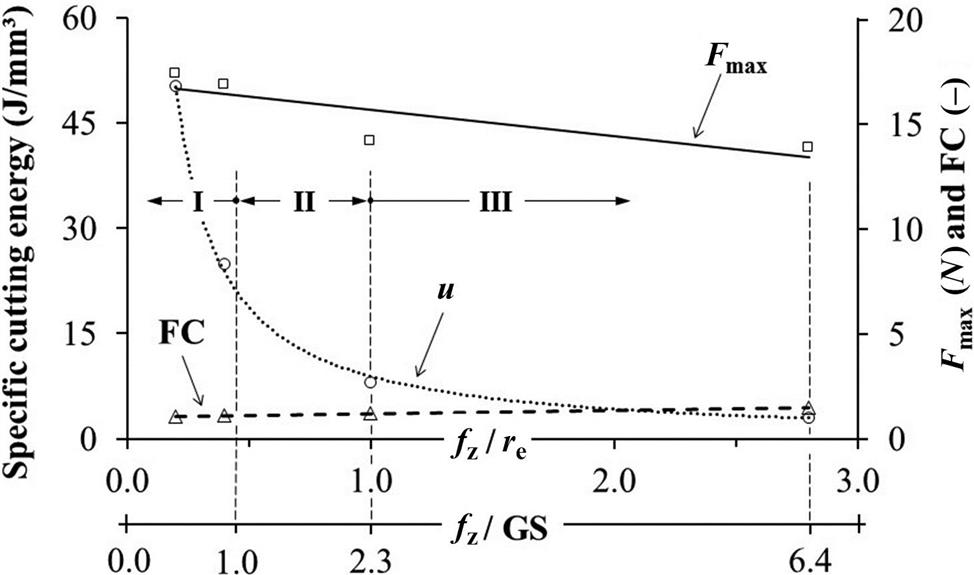
The graphic presents two x-axes (fz/re and fz/GS) and three intervals: In (I) the plowing is the main mechanism observed from tool–material interaction where the specific cutting energy increased 1531% for fz<GS, while friction coefficient on tool rake face decreased 39% and cutting force increased 25% because of an unbalance of force generated from the occurrence of plowing and shearing of material at the cutting edge. The interval (II) between fz/re=1 and fz/GS=1 is indicative of the transition from a plowing-dominated to a shearing-dominated regime, commonly known as the minimum cutting thickness (hmin). Finally, the shearing can be considered majority when fz/re>1 given the decrement of cutting force and specific cutting force.
Finally, Fig. 2.40 presents a comparison among characteristic size effect curves produced by different authors and cutting conditions when milling AISI 1045 steel at microscale cutting.
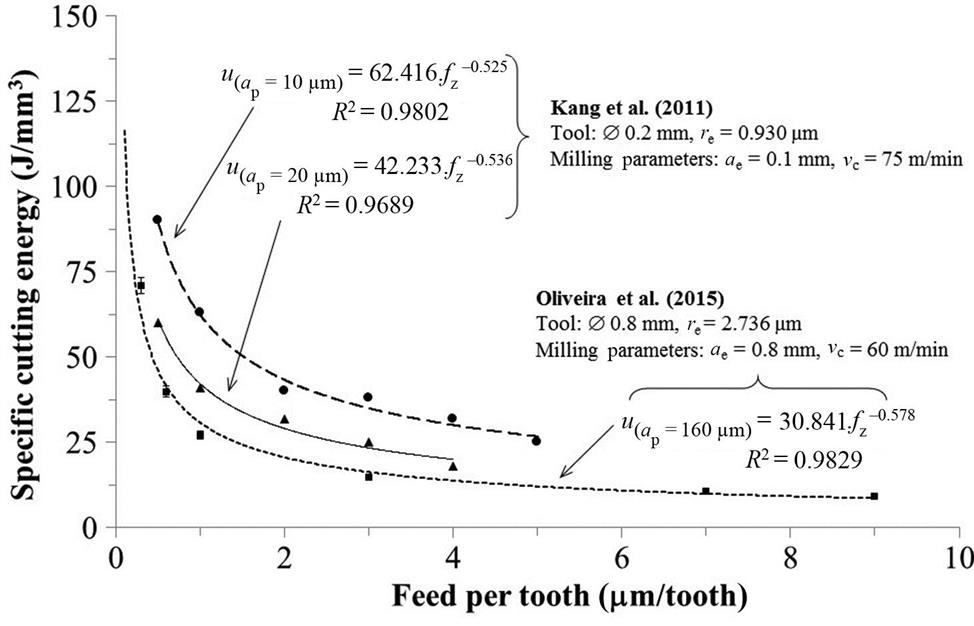
For larger feed per tooth, the specific energy lies approximately between 10 and 25 J/mm3. This magnitude is considered high for mechanical macromachining with defined geometry tool. For feed below 1 μm/tooth, the amplitudes range between 60 and 90 J/mm3, which are equivalent to values found for abrasive processes. This makes sense, because h/re near or less than the unit resemble chip removal dynamics in grinding, in which the abrasive grain is rounded and cutting thicknesses are of the same order of magnitude of its radius.
Even micromilling the same workpiece material, the amplitude difference between the curves lies mainly in the depth of cut parameter. Oliveira et al. (2015) estimated lower specific cutting energies, when choosing higher depth of cut values. Meanwhile, Kang, Kim, and Seo (2011) applied depths of cut 8 and 16 times smaller, which raised the specific cutting energy.
It is worth keeping in mind that in any mechanical material removal process, to minimize energy consumption by volume of chip removed is a goal, which is equivalent to minimize the pressure on the chip cross sectional area of the tool during chip formation predominant by shear strain. When tool feed, depth of cut and cutting speed are increased up to certain limits, the specific cutting energy decreases and productivity increases, which is beneficial, but also increases the forces on the tool, the roughness of the workpiece and the cutting temperature, since chip area increase as well as the shear rate. In micromachining, these effects can be harmful, given the low rigidity and high wear rates of microend mill cutters. Therefore, it is important to find a balance when choosing the cutting parameters in micromachining.
Moreover, it is not usual to proceed micromachining near or below the tool edge radius, since under these conditions there are prevalence of elastoplastic deformation of the workpiece instead of chip removal by shear strain mechanism.