PerformancePoint Server 2007 is the latest BI offering from Microsoft—part of the Office suite of applications—for planning, managing, and deploying BI throughout organizations. It is designed to monitor, analyze, and plan organizational business performance around budgeting and forecasting cycles and to manage performance management.
PerformancePoint Server 2007 enables information workers to seamlessly interact with key business applications and centrally author and disseminate information in real time. It removes obstacles introduced by non-automated processes, such as lack of visibility and delay in delivery of key decision-making data, prediction of future trends, manual collation of multiple Excel workbooks, and inflexible reporting. Additionally, PerformancePoint enables information workers to continue using those applications with which they are already familiar, such as Excel 2003 and Excel 2007, to author and update data. It also includes a server-based model to centrally manage roles and access to individual Excel worksheets and templates.
One question posed at a recent Microsoft BI conference was: When would you consider using PerformancePoint Server 2007 instead of Reporting Services? Two possible scenarios were suggested:
When you want a controlled and secured distributed Excel workbook-authoring environment
When you want the ability to provide greater flexibility when deploying scorecards and KPIs, including the ability to create reports against SharePoint lists, and to drill down into specific organization budget and forecasting sectors
In this section, we’ll highlight the main features and components of PerformancePoint Server 2007, describe how it works with SharePoint Server 2007, and help you understand how you can best work with the product to streamline budgeting, forecasting, and reporting throughout your organization.
More Info
Remember, the success of a PerformancePoint Server 2007 deployment rests on solid planning around an organization’s budgeting and forecasting, such as revenue and operating budgets. For further information and best practices for planning and reporting, see Best Practices in Planning and Management Reporting by David Axon (Wiley, 2003), available at http://www.amazon.com/gp/product/0471224081/102-8129517-3654545?ie=UTF8. For details on planning and architecting PerformancePoint Server 2007, see the Planning and Architecture Guide at http://technet.microsoft.com/library/bb838746.aspx. Also see the Deployment Guide at http://technet.microsoft.com/library/bb794637.aspx.
There are two main PerformancePoint components. One component comprises the budgeting and forecasting functionality, while the other comprises a Dashboard Designer for creating KPIs, scorecards, and reports. While each component performs a separate set of tasks, the two combine, or collaborate, to present and distribute information to key stakeholders and information workers throughout an organization.
The budgeting and forecasting component includes two planning applications—the Planning Administration Console (PAC) and the Planning Business Modeler (PBM)—which construct budgeting applications, application security (including user roles), user membership, user assignments, and business rules. Excel 2003 and Excel 2007 compliment the overall planning picture by allowing information workers to remotely author and centrally save budgeting and forecasting data based on their access as defined in the membership in the PAC and PBM.
The Dashboard Designer is the fusion of data sources, such as the data submitted to the central PerformancePoint database for an organizational budget or a SQL Server 2005 analysis services cube, and the Web front-end presentation, such as visual representation of a budgetary or forecasting period like KPIs and scorecards.
Figure 19-25 summarizes the overall functionality of PerformancePoint Server 2007 and the relationship with SharePoint Server 2007. The Dashboard Designer can act independently of the roles and assignments configured by the PAC and PBM and can be used to create dashboards, KPIs, and scorecards against multiple sources of data such as SQL Server 2005, Analysis Services, and ODBC.

Note
SQL Server 2005 Enterprise version is recommended for PerformancePoint Server 2007 deployments. See http://technet.microsoft.com/en-us/library/bb838707.aspx for further details and best practices for deploying and configuring SQL Server 2005 for PerformancePoint Server 2007.
The PAC is a Web-based tool for managing the framework for budgeting applications and is the initial configuration stage when implementing an organizational performance management solution in PerformancePoint Server 2007. The PAC is where you create Planning Server applications and model sites as well as configure auditing and overall reporting storage.
An application is a container for hosting model sites, data sources, dimensions (such as Account or Currency), user roles, and other administrative settings, such as auditing and workflow. When a new application is created in the PAC, two databases are created on the SQL Server 2005 database server: one for the application database and the other for the application staging database. Figure 19-26 shows the PAC Application Configuration page. The PAC includes a master user list that will be used for setting permissions throughout model sites and models.

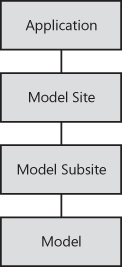
Model sites are hosted by a parent application and include a hierarchy of model subsites and models (cubes). When a model site is created, a database in SQL Server 2005 Analysis Services stores the models created under each model site. Figure 19-27 shows the hierarchy in constructing a PerformancePoint application.
Note
We refer to model sites. However, we are not referring to sites in the sense of Web sites or IIS. A site in the context of model sites is a SQL Server 2005 Analysis Services database and houses the subsequent models (cubes) created under each model site.
For instance, you may create a specific application to monitor company expenses and then create model sites and subsites under that application to define expenses by region and department. For large organizations, you may consider creating a separate application for monitoring expenses for each geography. Applications also form a physical security boundary based on user administration, as well as workflow and reporting. Figure 19-28 shows an example model site hierarchy.

SQL 2005 Server Reporting Services will need to be configured in native mode for the PerformancePoint Planning Server operational and business reports. If you have already configured Reporting Services in SharePoint Integrated mode, then you’ll need to create a separate instance of SQL 2005 Reporting Services and configure that instance in native mode. If you attempt to configure operational and business reports against a Reporting Services server that is configured in SharePoint Integrated mode, then you may receive the dialog box shown in Figure 19-29.

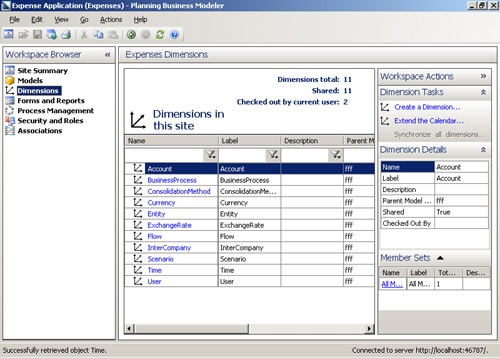
The PBM is a Windows tool that runs on the PerformancePoint server. It connects to the PerformancePoint Planning server to retrieve existing applications and model sites and is used to build and configure models within model sites. Figure 19-30 shows the initial page of the PBM connected to the Expenses model site.

The PBM includes a number of pre-populated dimensions and pre-defined model templates that you can use when creating new models within a model site, including stock scenario and time dimension types, as well as models that support assumptions. Figure 19-31 shows the default dimensions available when accessing a model site in the PBM. The option to create a new dimension is included under the Dimension Tasks pane.
Other configurations in the PBM include the following:
Defining model business rules
Managing form templates and reports submitted to the PerformancePoint Planning server
Process Management, which includes scheduling jobs and creating user assignments
Configuring Security and Roles and the current model site
Saving, deploying, and scheduling updates to models
The PerformancePoint add-in for Excel enables targeted users and information workers to update budget and forecasting data using Excel and submit data to the PerformancePoint Planning server for approval and update. Access to data is secured by the user roles and by the access defined back in the model site in the PBM, as are specific data rules.
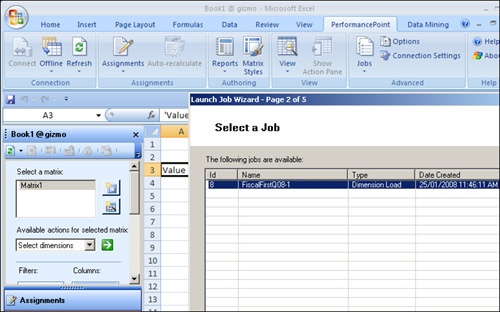
The add-in also allows administrators to create form (Excel) templates and reports for submission to the PerformancePoint Planning server. For example, an Excel template is created based on the business rules and dimensions created back in the model site, and the template is then deployed to a select group of users for data entry and subsequent data analysis. Figure 19-32 shows an Excel workbook with the PerformancePoint add-in for Excel active. The left pane is where user assignments are displayed for the current logged-in user as well as an authoring tab for creating wizard-based matrices and reports.
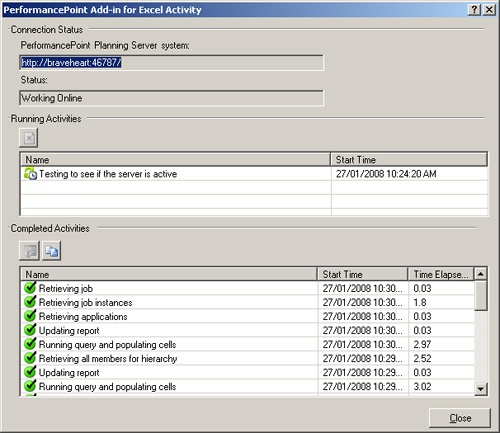
A data Connection Status dialog box, shown in Figure 19-33, shows the current connection status and completed activities for the current Excel workbook connection.
A key factor in deploying the PerformancePoint add-in for Excel is how you will deploy it. The add-in is a required client installation for those users who will be sent assignments and tasks from the PBM. One possible solution is to use Active Directory directory services group policy to selectively deploy the add-in to users.
Dashboard Designer: Presenting PerformancePoint Server 2007
PerformancePoint Dashboard Designer is a client-side tool for creating and managing dashboards, scorecards, KPIs, and reports and is included as part of the PerformancePoint Server 2007 installation. Dashboard Designer bridges the presentation gap between SQL Server 2005 Analysis Services and numerous other data sources, SharePoint Server 2007, and Windows SharePoint Services 3.0. For example, in the previous, section we provided an overview of how applications, site models, and models can be built and configured on PerformancePoint Server 2007. The logical next step would be to use Dashboard Designer to connect to the model’s data source, build KPIs and scorecards, and then publish an associated dashboard to a SharePoint site for visual representation.
Using Dashboard Designer, you can build an entire dashboard solution on Windows XP or Windows Vista. A Preview mode means there is no need for a server until you’re ready to deploy a dashboard to SharePoint, which makes Dashboard Designer ideal for demonstrations and proof of concepts. If you are using, or had previously used, Business Scorecard Manager 2005, an option to preview scorecards was not available; instead, you had to deploy a scorecard to a SharePoint site in order to preview it.
On the Companion Media
See the companion CD for dashboard planning worksheets, specifically the files titled "PerformancePoint_DashboardPlanningWorksheets."
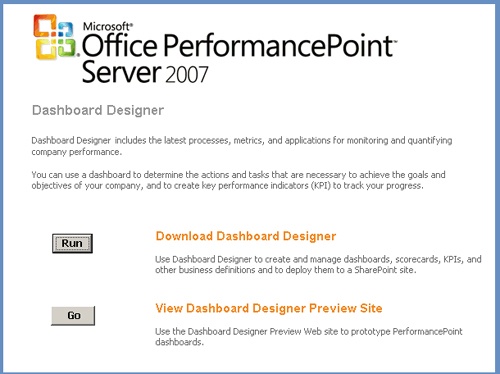
End-users will need to install the Dashboard Designer in order to view, edit, manage, publish, and deploy dashboards. The Dashboard Designer is deployed to end-users via the Monitoring Central Web site, which is configured at the time of installing PerformancePoint Server 2007 and typically accessed from http://server_name:40000/central/. Monitoring Central, shown in Figure 19-34, includes the option to download (run) the Dashboard Designer installation as well as a Preview option to view dashboards currently submitted for preview. The Dashboard Designer download, also referred to as a ClickOnce application, is installed on a per-user profile basis on the client machine.