
Dashboard Designer workspaces can be saved locally and ported to other clients and servers. Workspaces are saved in a .bswx file format, which is understood by Dashboard Designer. Any currently opened dashboards or dashboard items will be saved as part of the .bswx file. One stipulation in saving workspaces locally and porting to other servers is that the recipient user/server will need to ensure that any data source connections saved as part of the .bswx file are valid in terms of connection database server and administrative user rights included in the .bswx file.
On the Companion Media
When opening the sample .bswx workspaces that are installed as part of the PerformancePoint Server 2007 installation, you will need to adjust the server properties to include your own server URL and administrative user ID. We’ve added a sample guide to the book’s companion CD—see PerformancePoint_Monitoring_Samples.doc. See the "Additional Resources" section at the end of this chapter for more PerformancePoint Server 2007 resources.
If you do not save the workspace before closing it, content can be retrieved from the Monitoring Server the next time you launch and refresh the workspace (provided you’ve published any active content to the Monitoring Server). Figure 19-55 shows a dashboard refresh in operation within the Designer Dashboard workspace.
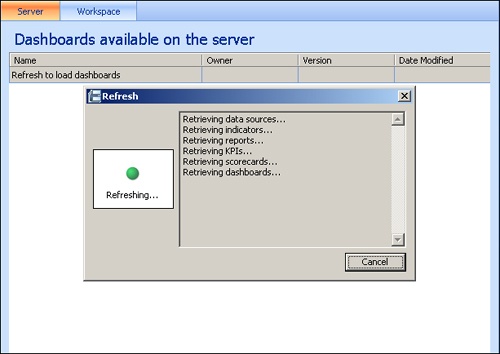
Figure 19-55. Dashboards being refreshed from the Monitoring Server and made available within a local Dashboard Designer
Note
Refreshing (retrieving) data from the Monitoring Server will overwrite any equivalent items within the workspace. For example, if you have items within a local Dashboard Designer workspace that you’ve edited and that haven’t been saved back to the Monitoring Server, then the Monitoring Server will overwrite those items when you next refresh from the server. Best practice is to always publish updated items back to the Monitoring Server to avoid having local workspace copies overwritten.
Behind the Microsoft Firewall: Microsoft’s Performance Management Solution
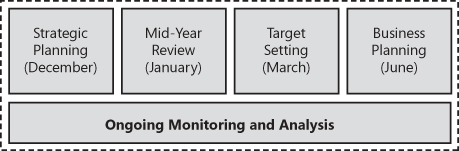
PerformancePoint Server 2007 has been in use at Microsoft for approximately two years. Some of the challenges faced by Microsoft before implementing PerformancePoint Server 2007 included disconnected processes and tools, inconsistent data definitions, overlapping accountability, and manual and inefficient data gathering. Added to this was the fact that data had to be accounted for across multiple geographies, including APAC, EMEA, and Americas. There was a requirement for ongoing monitoring and analysis, depicted in Figure 19-56, which shows Microsoft’s overall performance management process. This included a strategic plan with a three- to five-year outlook, including key investments and performance status at mid-year review.
The PerformancePoint Server 2007 deployment included a two-fold solution: a performance management solution for Microsoft Business Divisions and a planning and forecasting solution for Microsoft worldwide.
The performance management solution involved implementing PerformancePoint Server 2007 for scorecarding, drill down, and workflow; SharePoint for Web presentation; Excel Services for thin spreadsheets; and SQL Server 2005 for sound data. This resulted in consolidated and simplified processes, data sources, and reports; consistent and accurate data rules and data transformation; and a much-reduced business administrative overhead.
The existing planning and forecasting process faced challenges such as multiple legacy tools, offline modeling and manual reporting, and data transformation. This was addressed with a solution that included PerformancePoint Server 2007 for planning and forecasting, Excel for the end-user interface/tool, SharePoint for Web presentation, and SQL Server 2005 for sound and integrated data. This resulted in an integrated planning, forecasting, and reporting solution, including time-saving real-time delivery, one data model, and a single and consistent user experience, which cut back on training.
Chris Caren, General Manager, Microsoft Business Division