The topics of capacity planning and performance monitoring are presented together because much of the foundation is the same. Performance counters that are used for testing a farm’s capacity are also used to monitor the performance of the farm. In fact, some of the capacity planning metrics will help define the baseline used for performance monitoring. For example, we will show you how to test the capacity of your farm for Web requests using performance counters. We will then use those performance tests results to define the baseline for monitoring those servers for adequate performance. When possible, the correlation between counters used for capacity planning and performance monitoring will be detailed. In this chapter, you will be presented with best practices for the following:
Hardware and software boundaries
Planning using System Center Capacity Planner 2007
Testing using Visual Studio 2008
Monitoring using System Center Operations Manager 2007
Covering the technical details of each area is not possible in a Best Practices book, nor do we want to repeat what is already publicly available on the Web or in other Microsoft Press books. When necessary, you will be directed to the appropriate documentation for more information. Because every environment is different, this chapter will outline the high-level best practices for planning and monitoring. There will be some farm topology examples, but these are primarily used for examples on how to use available tools and not necessarily best practices on farm topologies.
We are often asked, "For n number of users, how many servers do I need?" The question really isn’t that simple and cannot be reduced to a one-sentence answer. Many factors affect a given server farm configuration’s ability to serve content and applications, and planning for a large deployment can be a very complex undertaking. There are five primary factors that affect a Microsoft Office SharePoint Server 2007 server farm’s performance, and it is important to understand the relationship between them.
User load
Traffic profiles
For a properly tuned Office SharePoint Server 2007 server farm, you must take all five areas of performance into account. Your software configuration greatly affects the load on your server and network hardware. The more customization of the native software, the greater your hardware needs will be. And the less substantial your hardware is, the better configured and less customized your solution must be. Finally, you need to understand how much traffic your solution will generate and what the traffic mix will be, such as reads, writes, and publishing actions. It is almost impossible to know what that mix will be in the beginning, so a best practice is monitoring your usage and refining your infrastructure as needed.
Installing a well-running SharePoint Server 2007 server farm isn’t as simple as just installing the software. SharePoint Server 2007 depends upon and requires a properly installed Windows Server 2003 or 2008 operating system. If you do not follow the best practices when installing the operating system, your attempts to fine-tune your SharePoint Server 2007 installation could be negated. For example, incorrectly configuring networking, Internet Information Services (IIS), or disk management could drastically reduce the performance of SharePoint Server 2007. Likewise, most of SharePoint Server 2007 content is contained in SQL Server databases. A poorly configured and maintained SQL Server instance reduces the effectiveness of your SharePoint Server 2007 installation. Be sure to address all of the foundational software requirements for SharePoint Server 2007 before attempting to plan for capacity and performance.
Additionally, you must correctly configure SharePoint Server 2007 and all of its components. Reference the online TechNet and MSDN content for correctly planning and configuring a SharePoint Server 2007 server farm. Incorrectly configuring many options, such as diagnostic logging, can greatly reduce the ability of your server farm to render content to users. Many times, poorly running server farms are the result of incorrect application configuration and not inadequate hardware. The best way to prevent a poorly designed farm is through adequate administrator, developer, power user, and end-user training in each of their respective areas. To concretize why training is a best practice, consider the following four examples:
Administrator. If a SharePoint Server 2007 farm administrator did not understand the implications of logging all events to the trace logs as Verbose, while also logging all event logs as Information, your server farm would perform poorly. Configuration changes such as this are hard to find and troubleshoot because they are not technically incorrect, but affect server farm performance.
Developer. If a SharePoint Server 2007 developer wrote a custom Web part that queried a data source real-time and displayed the results for every user, this would adversely affect page rendering. It is equally important that the developer profile her solution to fully understand the impact to the farm as a whole, i.e., SQL Server, WFE servers, third-party content source.
Site Collection Administrator. A site collection administrator creates 3,000 subsites to support a project. Because SharePoint Server 2007 performs very poorly with more than 2,000 subsites, the performance of these sites would drop substantially.
End User. A list and library best practice is having no more than 2,000 items in a view or folder. If a user were to upload more than 2,000 items in a single view, the list performance could be reduced by as much as 100 times!
Proper training, in conjunction with creating, maintaining, and monitoring your baseline configuration, is critical to the long-term success of your SharePoint Server 2007 implementation.
Note
The 2,000-item limitation, at a given level, applies universally to SharePoint Products and Technologies. You can download an in-depth white paper at http://technet2.microsoft.com/Office/en-us/library/6f03049f-5bfe-4807-b609-0e2d4a9ec3b51033.mspx for more information. There are exceptions, such as targeted programmatic access, and these are detailed in the white paper.
The level of application customization is usually proportional to the level of hardware required for your server farm. If you are not intimately familiar with the nuances of SharePoint Server 2007 customization, you should probably not customize in the beginning. Instead, investigate and use the native features to meet your requirements. We have seen many heavily customized SharePoint Server 2007 installations where much of the custom coding could have been accomplished through native functionality.
Customization isn’t just about writing custom Web parts, it may also be adding native Web parts such as the Content Query Web Part (CQWP) or Content Editor Web Part (CEWP). While the Web parts themselves will not affect server performance, the connections they make could substantially change server load and page rendering. For example, if you are querying a third-party data source using the CQWP and the connection is very slow, the resulting page rendering time might be quite long. No amount of additional SharePoint Server 2007 server hardware will fix this issue; only addressing the query content source bottleneck will improve page performance. Likewise, poorly developed and poorly conceptualized Web parts will adversely affect server performance. Always check custom Web parts in a test environment using Visual Studio 2008 Team Suite before production deployment.
Because SharePoint Server 2007 is a network-dependent application, your network infrastructure is critical to performance. Adequate wire speed for Intra-farm servers, switching, and hardware load-balancing are examples of components critical to most SharePoint Server 2007 installations.
More Info
Refer to TechNet for the latest in recommended and minimum server configurations: http://technet2.microsoft.com/Office/en-us/library/4d88c402-24f2-449b-86a6-6e7afcfec0cd1033.mspx
Be sure you have used at least the recommended hardware configurations for farm servers. Be aware that if you merely meet the minimum requirements, you may not be able to implement all of the features included with SharePoint Server 2007. The less substantial your hardware devices, whether server or network, the more carefully you must design, configure, and monitor your SharePoint Server 2007 server farm. Essentially, the less you plan, the more you buy. This might be perfectly acceptable in some instances. A real-world example is a custom Web part that doesn’t perform well, but it would take 200 hours for a developer to re-code. If that developer cost $150 an hour, then the cost to mend the Web part would be $30,000! Now, if adding two WFE servers addressed the problem without an impact to the SQL Server hardware, then that would most likely represent a cost savings. Obviously, you want your code to perform well, but sometimes additional hardware can provide a quick fix.
When planning for hardware, it is important to plan for high availability first and capacity second. Many times, the planning exercise for high availability negates the need for in-depth capacity planning. For example, many small- to medium-sized SharePoint Server 2007 installations will need at least two WFE servers to support high availability. Those two WFE servers, a clustered SQL Server instance, and a single application server are usually sufficient for several thousand users in an out-of-the-box configuration with limited customizations, and provide both high availability at the Web and database tiers and substantial client capacity. A best practice is testing your high availability server farm design against your desired capacity requirements using the SharePoint Capacity Modeling tool and Visual Studio 2008 Team Suite. You will often find your capacity requirements are already met. Lastly, don’t forget to plan for future growth. The user adoption rate is usually high when implementing SharePoint Server 2007, so a best practice is planning for a substantial increase in overall capacity.
When designing your SharePoint Server 2007 implementation, you should consider the limits of both the software and the hardware it is installed on. This section points out many areas where there are either software limitations or hardware limitations. You will find that many of the software limitations are really "boundaries." An example is the software boundary of 2,000 items in any list view. While you can most certainly have 2,001 items in a list view, 1,999 items would yield marginally better performance, and 500 items would be substantially better. In other words, don’t take the software or hardware boundaries discussed in this section as absolute values; instead, take them as recommendations.
More Info
See the article "Plan for software boundaries (Office SharePoint Server)" at http://technet2.microsoft.com/Office/en-us/library/6a13cd9f-4b44-40d6-85aa-c70a8e5c34fe1033.mspx for a full list of SharePoint Server 2007 software boundaries.
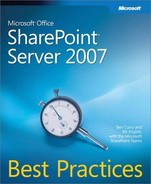
Software boundaries are either suggested limitations by Microsoft or are hard-coded limitations imposed by the product developers. Because some of these limitations are hard-coded into the product, adding additional servers to a SharePoint Server 2007 server farm will not always address the limitation. Likewise, database schema limitations, such as 2,000 items in a list view, are also not addressed by adding additional servers into the farm. Software boundaries should be considered the upper limits when designing and not an absolute limit. Figure 23-1 illustrates an example of this by showing the performance decrease using a flat library view as the total number of items increases. This is contrasted with Figure 23-2, which demonstrates the performance improvement using Indexed Views and Folders.

Plan to stay well beneath both hard-coded and recommended limits and monitor for exceeding these software boundary thresholds. Table 23-1 shows the most common guidelines for acceptable performance. While most of this information is accessible at http://technet.microsoft.com/SharepointServer, it is included here for your convenience.
Table 23-1. Guidelines for Acceptable Performance
Site object | Guideline | Notes | Impact scope |
|---|---|---|---|
Site collection | 50,000 per content database | Total farm throughput degrades as site collections increase. | Farm |
Web site | 250,000 per site collection | No more than 2,000 subsites under any single Web site. No more than 250,000 total sites in a single site collection. | Site collection |
List items | 5 million per list | The hard-coded limit is 5 million, but only if accessed programmatically. | List |
List view | 2,000 | You should have no more than 2,000 items in any list view. This can be accomplished via Folders or Views. See http://office.microsoft.com/en-us/sharepointtechnology/HA101736671033.aspx?pid=CH101215281033 for more information. | List view |
Document file size | 50 MB (2 GB max) | While you can have up to a 2-GB file upload size, server performance is directly relational to the file size. | Client file save |
Field type | 256 per list | This is a suggested software boundary. | List view |
Library columns | 2,000 | Suggested software boundary. | Library view |
List columns | 4,096 | Suggested software boundary. | List view |
Web parts | 50 per page | Suggested software boundary. Maybe less when using complex logic. | Page view |
People object | Guideline | Notes | Impact scope |
Users in groups | 2 million per Web site | Use Active Directory Universal Groups for sites with large user populations. | Site |
User profiles | 5 million per farm | Imported from Active Directory or other third-party source. | Farm |
Security principals | 2,000 per Web site | Use Active Directory Universal Groups if close to guidelines. | Site |
Search Object | Guideline | Notes | Impact scope |
Search index | One per SSP | Hard-coded limitation. | Farm |
SSPs | 20 per farm | Because an SSP can be associated with only one index, the maximum number of index servers is also 20. | Farm |
Indexed documents | 50 million per content index | While you can go past 50 million documents, it has not been tested. | Index / SSP |
Content sources | 500 per SSP | Hard-coded. | SSP |
Start addresses in a single content source | 500 per content source | Hard-coded. | Content source |
Alerts | 1 million | Tested limit. | SSP |
Scopes | 200 | Recommended. | Site |
Scope display groups | 25 | Recommended. | Site |
Crawl rules | 10,000 | Recommended. | SSP |
Keyword | 15,000 | Recommended. | Site |
Crawled properties | 500,000 | Discovered during crawl. Hard-coded. | SSP |
Managed properties | 100,000 | Hard-coded. No more than 100 crawled properties mapped to a single managed property. | SSP |
Authoritative pages | 200 per level | Hard-coded. | SSP |
Results removal | 100 | Maximum number of URLs that can be removed per operation. | SSP |
Crawl logs | 50 million items | Hard-coded. | SSP |
Logical architecture object | Guideline | Notes | Impact scope |
SSPs | 3 recommended, 20 maximum | After 3 SSPs in a farm, there is degradation in performance. The hard-coded maximum is 20 SSPs. | Farm |
Zones | 5 per farm | There are 5 hard-coded zones: Default, Internet, Intranet, Extranet, and Custom. | Farm |
Web application | 99 | Includes consuming child farms. | SSP |
Site collection | 50,000 per Web application | Hard-coded. | Web app |
Content database | 100 per Web app | Hard-coded. | Web app |
Site collection | 50,000 per content database | Hard-coded limit. Realistically, the number is much lower. | Content database |
Physical object | Guideline | Notes | Impact scope |
Index server | 1 per SSP | Usually one per farm. | SSP |
Excel Calculation Services | No limit | Monitor network traffic between servers. | Farm |
Query servers | No limit | Monitor network traffic between WFE servers, index server, and SQL Server for acceptable performance. | Farm |
Web servers per SQL Server instance | 8 WFE servers per SQL instance | Actual performance usually declines at 5 WFE servers per SQL Server instance. Dependent on server usage profile mix. | SQL Server instance |
As you can see in Table 23-1, there is much to consider when planning for a large or specialized SharePoint Server 2007 implementation. But most implementations will not approach the limitations, whether they are hard-coded limits or recommended limits.
More Info
For a detailed guide to content database sizing and more, please see the white paper "Performance recommendations for storage planning and monitoring" at http://technet2.microsoft.com/Office/en-us/library/ca472046-7d4a-4f17-92b1-c88a743a5e3c1033.mspx?mfr=true.
Hardware boundaries are the performance and capacity constraints imposed by the physical hardware itself. As an example, let’s look at the 50 million objects per index software boundary from Table 23-1. While the software allows for 50 million items, you must have the hardware to support the crawling, indexing, propagation, ranking, archiving, and other search functions related to that index. Additionally, you must have the network bandwidth between the index and query servers to propagate the index, bandwidth between the index server and content sources, and I/O available on the content sources themselves. The minimum server hardware for SharePoint Server 2007 will not support a 50 million item index; therefore, the server would be the boundary and not the software. But, just because the software boundary is well above your current or planned numbers, don’t assume you will have the hardware capacity for processing. A good example is supporting large lists (lists with over 2,000 items), seen in Figure 23-1 and Figure 23-2. Those statistics were gathered using a Web server with two dual-core Xeon 2.8 GHz, 64-bit processors and 4 GB RAM. Only a 32-bit system is required to install SharePoint Server 2007. So if you installed on the minimum recommended hardware, you could expect to see the performance of large lists decrease before the 2,000 item limit, and it would be even more important to index views or create folders. Basically, the closer you get to the software boundaries, the more robust your hardware solution must be. Otherwise, you will see performance degrading long before you reach the software boundaries.
More Info
For detailed information on large lists, see "Working with large lists in Office SharePoint Server 2007" at http://go.microsoft.com/fwlink/?LinkId=95450&clcid=0x409.
There are many places in your farm that could introduce a hardware boundary. First, your SQL Server hardware can often be the performance bottleneck in your farm, specifically the I/O subsystem. You should follow SQL Server implementation best practices, including a dedicated SQL Server instance when you begin to approach any of the software boundaries mentioned previously in this chapter. In fact, you may very well need multiple SQL Server instances to support hardware requirements on disk, CPU, or network between SharePoint Server 2007 server farm members and associated databases. Be aware that when SQL Server begins to bottleneck your SharePoint Server 2007 farm, it can also impact farm member servers such as WFE servers. Two examples are immediately relevant to this discussion. First, when performance decreases and a page doesn’t immediately render to a user, the users will often continually attempt to open the page, furthering the negative impact to your server farm. Second, when SQL Server bottlenecks, your WFE and application servers must queue user traffic while waiting for SQL Server to respond. Many times, these two events happen simultaneously, rendering your farm essentially inoperable. Basically, poor performance at any tier can cause a snowball effect and your farm performance could spiral downward at a rapid rate.
More Info
There is a SQL Server Performance Recommendations guide for SharePoint Server 2007 at http://office.microsoft.com/download/afile.aspx?AssetID=AM102509151033.
Using 64-bit hardware for your SharePoint Server 2007 implementations is the single best way to expand hardware boundaries. First, a 64-bit server allows for more data to flow through the bus and therefore reduces the possibility of I/O bottlenecking on your SharePoint Server 2007 servers. More importantly, a 64-bit server is capable of addressing up to 1 terabyte of RAM. Contrasted with the ability of a 32-bit Windows Server to directly address only 4 GB of memory, it makes the use of 64-bit hardware very compelling.
Note
Windows SharePoint Services 2.0 SP2 and Windows SharePoint Services 3.0 do not support the /3GB switch, as can be seen here http://support.microsoft.com/default.aspx?scid=kb;en-us;933560&sd=rss&spid=11373. Therefore, SharePoint Server 2007 does not support this either.
If you have a small or test scenario, you could use 32-bit hardware. But be careful testing custom code on hardware different than your production environment. If at all possible, MSF (Microsoft Solutions Framework) best practices dictate that your test environment should be identical to your production environment.
Capacity planning is a best practice, but performing this task has been very difficult until now. Microsoft has released a new version of their capacity planning tool named System Center Capacity Planner 2007. It was originally developed for designing medium to large Exchange Server 2007 deployments and is freely available via the Microsoft Download center. Recently, the Solution Accelerator team has released SharePoint Server 2007 and Windows SharePoint Services 3.0 models for creating and testing SharePoint Server 2007 farm architectures, including authenticated and anonymous user profiles, altering those users’ traffic mix, and adding users on up to ten WAN connections. There are many benefits to using this tool. Here are some examples:
Easy-to-use modeling wizard
Pre-configured client profiles including light read, heavy read, light publishing, average publishing, heavy publishing, light collaboration, average collaboration, and heavy collaboration
Pre-configured static server loads adjustable from 5 percent to 10 percent user concurrency
Pre-configured WAN links ranging from dial-up 56 k to OC3 (Optical Carrier 156 Mbps)
Commonly used server hardware combinations
Ability to add custom server hardware combinations
Ability to plan and model high availability on WFE servers and SQL Server
Simulate one to thousands of users on LAN and WAN connections
Create Storage Area Network (SAN) switches and storage frames
Export drawings to Office Visio 2007 and bill of materials to Office Excel 2007 formats
As this section will show, it is a very nice planning and pre-sales tool, but should not be considered sufficient design and preparation for most SharePoint Server 2007 implementations. Although it makes a nice tool to justify hardware costs to management and customers, there are few things it will not do:
Storage limitation of 2 terabytes
Indexing and backup/restore loads are static and meant for small to medium deployments
You cannot define SAN information during model creation; it must be done after creation
You cannot create custom WAN links
You cannot add multiple server farms for regional connectivity
The limitations will only apply to the largest deployments. If the limitations apply to your design, you should "get it close" with the capacity planning tool and use Visual Studio 2008 Team Suite for testing your actual implementation. To begin, you must have first loaded System Center Capacity Planner 2007 and added the SharePoint models to the tool. Figure 23-3 shows the farm creation screen.

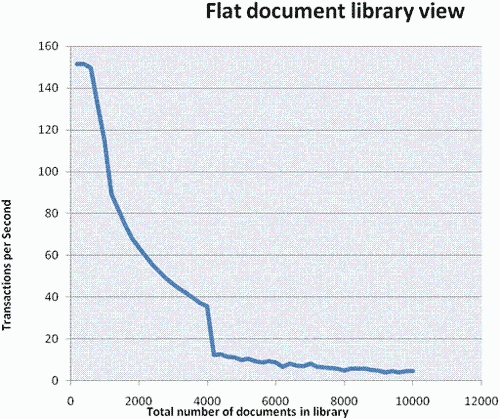
While you are creating the server farm model, you can specify either an Internet or intranet deployment. Selecting an Internet deployment allows you to include anonymous users in your design. When you select Customize Usage Profiles, you can specify the exact traffic mix for each type of user. Figure 23-4 shows the editing of what average collaboration means in your environment.
Unless you have performed detailed analysis of your current traffic, many of these settings will be guesses in the beginning. Once you have a test system in place and have captured enough traffic to have usable metrics, you can come back and redefine these for more accurate modeling.
After you have the initial farm created in the modeling wizard, you can continue to add branch office profiles. You can create all branch offices as the same profile, or create each one individually. You can create up to ten branch office profiles and define Site to Site or Shared WAN network topologies. Figure 23-5 shows an example of changing the network speeds and available bandwidth between two Shared WAN sites. Figure 23-6 shows changing the latency on a Site to Site connection.


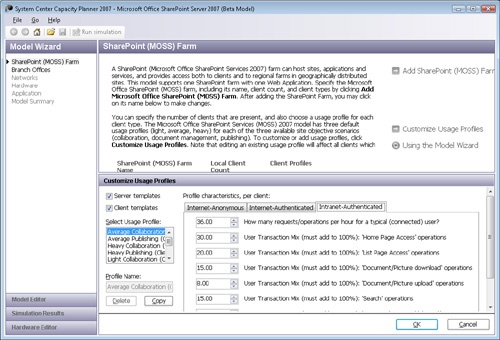
After you have finished your model, the tool will suggest hardware configurations for your deployment. You can export this hardware list to Microsoft Office Excel 2007 to give you a basic bill of materials for hardware purchasing. You can also hover over a server in the Site Topology screen to see the suggested hardware, as seen in Figure 23-7.
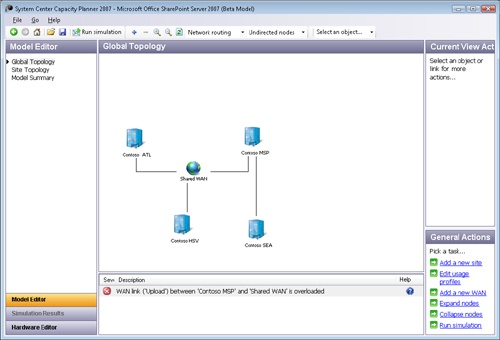
The last benefit of the tool is the ability to run a simulation based on your input. It can show you where hardware is insufficient, WAN links are overloaded, and much more. In fact, you can perform what-if analysis after you run the initial simulation by changing the configuration in the Hardware Editor and Model Editor windows. A common example is trying slower CPUs and changing the disk configuration, then re-running the simulator to see if those bottleneck. Figure 23-8 shows an example of the simulator output when one of the WAN links is overloaded.
Remember, the tool can only model what you have inputted. It cannot guess at your user count, WAN connections, WAN latency, and server hardware. If your hardware devices, including storage, CPU, SAN, and WAN are incorrectly configured in the tool, you will get unreliable simulation results. Once you have completed a thorough analysis with the Capacity Planning Tool, it is time to build an actual server farm and perform testing on your production hardware to see if it performs as expected.
On the Companion Media
On the CD, you will find SharePoint Capacity Planning Tool v1.0.msi, which will install the Windows SharePoint Services 3.0 and SharePoint Server 2007 capacity planning models. The installation instructions can be found in the accompanying SharePoint Capacity Planning ReadMe.txt file.
While the capacity planning tool gives you a good place to start designing and a baseline from which to purchase hardware, it cannot know all of the possible variables for a given SharePoint Server 2007 installation. Therefore, you need to test your farm architecture before deployment for production use. Additionally, you need to test all custom and third-party Web parts before deploying in a production environment. For this purpose, we use Visual Studio 2008 Team Suite (VSTS 2008). Much of this functionality was included in Visual Studio 2005 Team Center Testing Editions (VSTT), and if you were familiar with the older tool, the new one will be quite easy to learn. To adequately test the capacity of your new SharePoint Server 2007 server farm (also known as stress testing), you must have the Visual Studio Team System 2008 Team Suite. It provides the testing capabilities, performance statistics storage, and controller capabilities required to stress test a SharePoint Server 2007 server farm. The following lists some of the reasons we use VSTS 2008:
Baseline farm performance
Clearly see the impact of adding native Web parts, custom Web parts, and third-party Web parts on system performance
Test performance changes when adding and removing servers from a farm
Test any major configuration change in the farm, such as search and indexing
More Info
If you have never used a Visual Studio Testing Rig, browse to http://msdn2.microsoft.com/en-us/vsts2008/bb872413.aspx for an excellent how-to video by Richard Hundhausen.
You need to have a complete SharePoint Server 2007 server farm built for accurate results when using VSTS 2008 testing tools. You should build your server farm according to your preliminary design architecture. You may also want to populate your server farm with test data. There are several ways to do this, the easiest being to populate the sites and lists manually. If you need to create hundreds or even thousands of sites, lists, and items, you should consider using an automated tool that will create test data and, more importantly, remove your test data when you are finished.
More Info
The leading data population tool at the time this book was written was the SharePoint 2007 Test Data Population Tool, at http://www.codeplex.com/sptdatapop. If all you need is collaboration test data, the Windows SharePoint Services 3.0 Test Data Population Tool (http://www.codeplex.com/sptdatapop/Release/ProjectReleases.aspx?ReleaseId=1141) is an easier and more reliable tool to use. Refer to http://technet2.microsoft.com/Office/en-us/library/301ed832-95da-4251-b266-7be6288f7ea01033.mspx for detailed usage information.
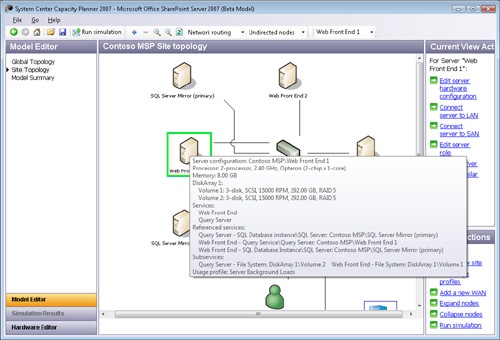
Because testing SharePoint Server 2007 server farms with VSTS 2008 isn’t widely understood and a critical best practice for deployment, a walkthrough is included here. For the tests described in this section, all sites, lists, libraries, and content therein were created and uploaded manually. If you follow the recommendations in the software boundaries section of this chapter, you should not need to create hundreds and thousands of sites, lists, and objects to adequately test most SharePoint Server 2007 deployments. The following scenario has two WFE servers that are load balanced, both hosting the search query server role, and one application server hosting Central Administration and search index role. Figure 23-9 shows a graphical representation of our scenario farm.
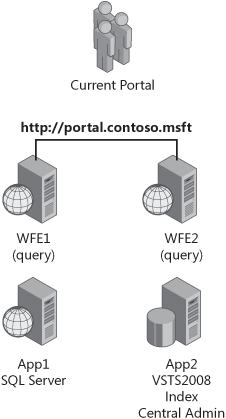
Figure 23-9. There are four servers in the test farm, with two running as WFE servers, one indexing server, and one SQL Server instance.
To begin building your test rig, you must install VSTS 2008 on a workstation or server that has direct access to all members of the SharePoint Server 2007 server farm. You will create a test project, create a test list, and then collect metrics on various client actions such as page loads and querying. While testing using VSTS 2008 can be quite elegant and complex, it doesn’t have to be. This scenario only covers the basics of stress testing a SharePoint Server 2007 server farm. Begin by creating a new VSTS 2008 Test Project, as seen in Figure 23-10.

After you have created the project, you next want to begin recording Web tests. Keep in mind that the end goal of this scenario is testing the capacity of your server farm for real-world client actions such as file downloads, search queries, page rendering, list creation, and in-browser editing of a publishing site. You have two options when recording Web tests: create one large test that includes all of your users’ actions, or create many individual tests. The latter is what you will do here as it allows you to change the transaction mix so that you can run multiple test scenarios from a single set of Web tests. From the Solution Explorer, add a new Web test, as seen in Figure 23-11.

After you have added a new Web test, a browser window will open allowing you to record a Web action. Browse directly to a page to begin the recording. After each record is completed, rename the Web test to match the transaction, such as Portal Home Page.webtest. You will see later why this is important. Continue to record transactions such as file uploads, querying using different terms, editing a page, and so forth. For the scenario in this section, we have recorded the following transactions, each being an individual Web test:
Browse to the portal home page
Edit portal home page and publish
Manage a document library
Upload a document
Execute a query
You can now execute each of these Web tests individually and see results such as total time and request time. If you are only looking to see something simple, like the impact a Web part has on page rendering, then a single Web test would suffice. Simply run the test on the page before adding the Web part. Note the results. This would be considered your page performance baseline. Then, add the Web part to the page and re-run the test. You should easily be able to see the difference in page load times. If you require more in-depth analysis you must create a load test.
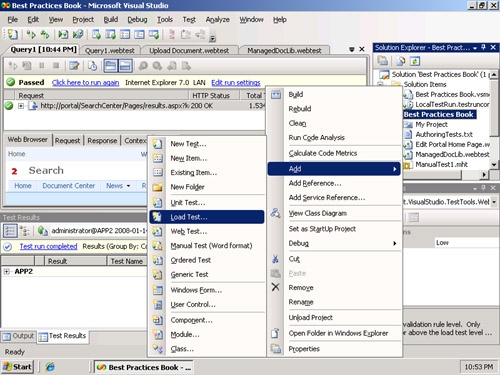
If you need to see the impact a Web test has on a server by hundreds or thousands of users, you need to create a load test. Choose Add -> Load Test from the Solution Explorer, as seen in Figure 23-12.
You should name the test something easy to recognize and decide whether you will include think times, use a constant or step loading pattern, and select a test mix model. Refer to your VSTS 2008 documentation for detailed information. When selecting your test mix, you can now add one or many of the individual Web tests previously recorded and select the transaction distribution, as seen in Figure 23-13. This is why you should name each individual test something easy to recognize.
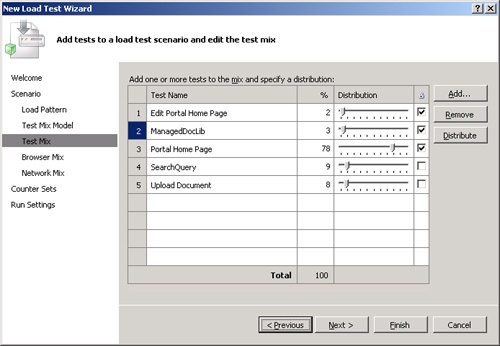
Figure 23-13. Add the previously recorded Web test and select the distribution of those transactions.
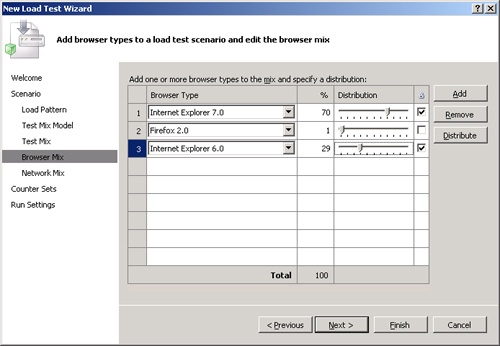
Next, you should select the browser mix supported by SharePoint Server 2007, which includes Internet Explorer 7.0, Internet Explorer 6.0, and Firefox 2.0, as seen in Figure 23-14. Be aware other browser types can be selected, but are not supported by SharePoint Server 2007.
Note
Using a combination of Web test, load tests, and browser types, you can test client changes such as migrating from Internet Explorer 6.0 to Internet Explorer 7.0.
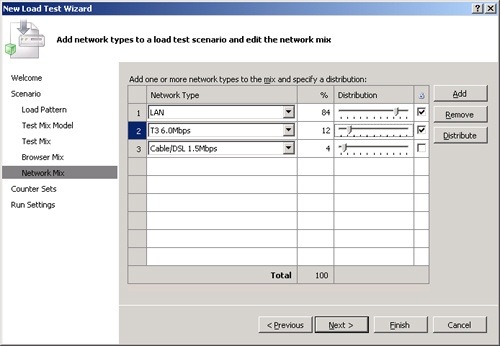
The next screen will take you to the network mix. Be cautious before moving forward. If you simply want to test the impact of adding and removing features such as Web parts, you should leave the default to 100% LAN. This is the most accurate way to determine the impact of an added feature. If you want to model the impact to your server farm to ready for production deployment, then choose the network types and distribution to match your environment. We have selected a distribution of 84% LAN, 12% T3, and 4% Cable for our test scenario, as seen in Figure 23-15.
To accurately monitor the load on all servers in your farm, be sure to add all servers in the farm to the Counter Sets screen. For this scenario, we have added both WFE servers in our farm with IIS and .NET counters, and APP1 server with SQL counters.
Note
Be sure to space the counter interval to a reasonable value such as every 15 seconds. Monitoring at a too-frequent interval will overload the testing rig and skew test results.
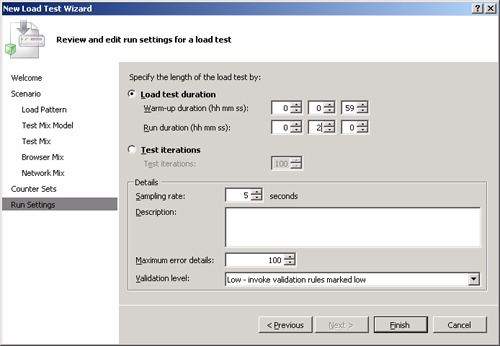
This should give us an overall view of our farm as we add users to the load. Last, we need to define the run settings. In Figure 23-16, you can see that we have a warm-up time of 59 seconds so we get a valid test and don’t get erroneous information due to an event, such as JIT compiling. We have also defined the test duration as 2 minutes.
Once you have built your load test, you now need to run the test. While the test is in progress, you will see a graph with key indicators such as user load, request/second, and errors/second. You also see any threshold violations, as seen in Figure 23-17.

There isn’t room in this chapter to discuss every possible metric that can be captured via VSTS 2008 testing. You can create custom counter sets that track any of the performance counters, including those installed with SharePoint Server 2007. You can test your farm for 100 or 100,000 users, depending on your needs. Be aware that accurate testing of more than a few hundred users requires the use of multiple VSTS 2008 Team Suite Agents to represent the actual load from these test users.