
SPECIAL OPPORTUNITIES
One of the funny things about the stock market is that every time one
person buys, another sells, and both think they are astute.
—WILLIAM FEATHER
Every once in a while, Mr. Market offers special opportunities for buying or selling stocks. Remember, Mr. Market is not an all-wise impartial judge who tells us what things are really worth. Mr. Market spouts prices that are sometimes reasonable and sometimes foolish. Value investors who can distinguish the reasonable from the foolish can take advantage of Mr. Market’s foolishness.
This is not easy. Yes, Mr. Market makes mistakes, but market prices that seem baffling to you and me may not be mistakes. It is easy to be lured by the promise of easy money. (I know from personal experience!) It takes willpower to step back and ask the pertinent questions:
1.Is this information from a reliable source? Ignore hot tips from auto mechanics about environmental companies.
2.Is it illegal insider information? Don’t do time for doing a crime.
3.Why isn’t it already embedded in the market price? Don’t others know? Are others confused?
MASSIVELY CONFUSED INVESTORS
Stocks are identified by ticker symbols that were originally created to speed up the transmission of trading reports on ticker tape machines. Actively traded stocks were given single-letter ticker symbols; for example, the Atchison, Topeka, and Santa Fe Railway (A) and American Telephone and Telegraph (T). Today, New York Stock Exchange stocks have one to three letters plus additional characters that can be used to identify the type of security; for example, Citigroup (C), General Electric (GE), and Berkshire class A (BRK.A). Ticker symbols are usually abbreviations of a company’s name, and companies sometimes become known by these abbreviations: GE, IBM, 3M.
Companies choose their ticker symbols, though exchanges can reject a choice that is offensive, misleading, or duplicates another company’s symbol. In practice, the company’s choice is almost always honored. One notable exception was Furr’s/Bishop’s Inc., which applied for the symbol FBI, but was rejected because this is the well-known acronym for the Federal Bureau of Investigation. In a perfectly efficient market, this shouldn’t have mattered, but apparently the ticker-approvers thought it did.
The efficient market hypothesis says that investors cannot use public information to beat the market. A stock’s ticker symbol is no secret and it would be surprising if a stock’s performance were related to its ticker symbol. Surely, savvy investors focus on a company’s profitability, not its ticker symbol!
Investors are not always savvy. After Charles Lindbergh’s historic 1927 flight from New York to Paris, there was a surge in the price of airline stocks including Seaboard Air Line Railroad, even though Seaboard was a railroad whose name “Air Line” referred to its long stretches of straight track.
In his Harvard economics PhD thesis, Michael S. Rashes reported several instances where investors were confused about ticker symbols. Two completely different firms, Massmutual Corporate Investors (traded on the NYSE with the ticker symbol MCI) and MCI Communications (traded on the NASDAQ with the ticker symbol MCIC), exhibited a strong correlation in their prices, apparently because investors who wanted to invest in MCI Communications mistakenly bought Massmutual stock. Rashes wrote an article about this and other examples using the wonderful title, “Massively Confused Investors Making Conspicuously Ignorant Choices.”
Rashes also found that Transcontinental Realty Investors (TCI) was mistaken for Tele-Communications Inc., causing TCI’s price to be affected by news about the possible takeover of Tele-Communications by Bell Atlantic and later AT&T. Similarly, Castle Convertible Fund, a mutual fund with the ticker symbol CVF, briefly fell 32 percent after the Financial Times published a report of impending losses for the Czech Value Fund, which it abbreviated as CVF. A 1998 Barron’s article was bullish on the Morgan Stanley Asia Pacific Fund, but the ticker symbol was misprinted as APB, rather than APF. The ticker symbol APB belongs to the Barings Asia Pacific Fund, which opened up 30 percent the first trading day after the Barron’s article appeared.
In 1999, AppNet Systems filed for an initial public offering (IPO) under the ticker symbol APPN, which was currently being used by Appian Technology. In the two days following the filing (when it was not yet possible to trade AppNet stock), 7.3 million shares of Appian Technology stock were traded (compared to 200 shares the day before AppNet’s IPO filing) and the price increased by 142,757 percent. During the initial public offering of Ticketmaster Online-CitySearch using the ticker symbol TCMS, shares of Temco Service Industries, whose ticker symbol was and had previously been TCMS, rose from $28.875 to $65 before investors realized their mistake and the price plunged to $25.50. When online retailer Amazon had an IPO in 1997 using the ticker symbol AMZN, a company called Amazon Natural Treasures, which had been using the ticker symbol AMZN before Amazon went public (and switched to AZNT afterward), rose from $1 a share to $3 and then fell back to $1 after investors realized their mistake.
The Pokémon GO smartphone game burst on the scene in the summer of 2016. Users can find various Poké items superimposed on a map of their own actual geographic location and can capture wild Pokémon by throwing Poké Balls at them. Pokémon GO was an inexplicable success, quickly downloaded by more than 100 million people. Seemingly everywhere, kids were walking around with their faces glued to their smartphones. Some were hit by cars. Dozens of adults crashed their cars while playing and driving, including one person who slammed into a police car. (I won’t make any jokes about the Darwin Awards for people who voluntarily improve the gene pool.)
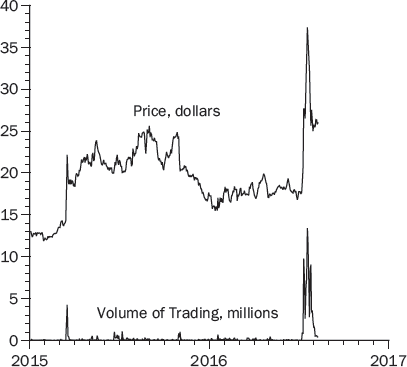
Pokémon GO was developed by Niantic, a Google spin-off, using Google Maps. Nintendo had invested in Niantic, and Figure 15-1 shows that during a two-week period (July 5 to July 18), Nintendo’s stock more than doubled, from $17.63 to $37.37, while daily trading volume surged from 26,000 shares to more than 13 million. Investors evidently had not spent much time investigating the extent of Nintendo’s investment and the effect it might have on Nintendo’s profits. On July 24, Nintendo issued a statement saying it had only a 13 percent interest in Niantic. Nintendo stock promptly plummeted 18 percent, the maximum allowed on the Tokyo stock exchange.
Commentators blamed the run-up and subsequent crash on “retail investors” who had not done their homework. I’m pretty sure that more than a few professional investors hadn’t done their homework, either. If the much-maligned small investors had pushed Nintendo’s stock price higher than the pros thought appropriate, the pros would have sold heavily, keeping the price from doubling.
Yes, these are isolated examples of massively confused investors. They don’t demonstrate that the stock market is completely nuts, but they do make one wonder about the assertion that Mr. Market never makes a mistake.
GOING AGAINST THE FLOW
Chapter 9 includes a discussion of a study I did (with two colleagues) of professional forecasts of corporate earnings. We found that the most optimistic predictions tended to be too optimistic and the most pessimistic predictions tended to be too pessimistic. One consequence was that, on average, stocks with pessimistic earnings forecasts outperformed stocks with optimistic forecasts.
In August 2015, I had $100,000 to invest and decided to test this strategy with real money. I had access to a pretty comprehensive database of real-time corporate-earnings forecasts made by professionals who are paid a lot of money to make these forecasts. I restricted my analysis to companies with forecasts from at least twenty-five analysts to ensure that the companies were prominent, highly visible, and closely scrutinized. Any systematic inaccuracies could not be explained away as careless guesses about unimportant companies. I used the median prediction to reduce the influence of outliers.
I had planned to divide the $100,000 evenly among the ten companies with the most pessimistic forecasts. All ten turned out to be in the energy sector. So, I bought a diversified portfolio of energy-related companies by investing $100,000 in Vanguard Energy Fund on August 19, 2015.
An all-energy portfolio, by itself, is not very diversified. True diversification would involve stocks from many sectors of the economy. Not to worry. I didn’t own any energy stocks in the rest of my portfolio.
This was a challenging test of a contrarian strategy. It is not easy to invest in stocks that others loathe—especially stocks in an industry that others shun. My wife repeated the dire warnings she read about the energy sector and advised me not to throw away money on these stocks. This fortified my resolve. I remembered the advice to be greedy when others are fearful, and there was certainly a lot of fear about energy stocks. It was probably true that their earnings for the next few years would be dismal, but I also suspected that Mr. Market may have overreacted. I know that value investors look for good companies at bargain prices—not bad companies at bargain prices—but I also know that bargains can be found among bad companies.
The first few months were not pretty. Five months in, the S&P 500 was down 11 percent and my Vanguard Energy Fund was down 24 percent. This was another test of contrarian temperament. Let’s take a moment for a pop quiz: When prices plunge, is a contrarian-investor’s first reaction to:
a.Sell everything in order to contain the damage.
b.Buy more at even better prices.
The correct answer is (b), following the adage, “If you like a stock at $100, you will love it at $75.” In this case, I didn’t buy more, but I didn’t bail out, either.
I was happy to see energy rebound. Figure 15-2 shows the one-year return, from August 19, 2015, to August 19, 2016, on the Vanguard Energy Fund and the S&P 500. The return on the S&P 500 was 5.0 percent; the return on the energy fund was 12.4 percent.

In practice, a strategy based on earnings forecasts is difficult for most people to implement because they don’t have access to the database I used. However, there are some useful lessons.
As lesson one, this story is yet more tangible proof that contrarian strategies can pay off. Don’t be afraid to invest in stocks that others hate; that’s just another reason the stocks may be cheap. In fact, if a stock is inexpensive relative to its earnings and dividends, it is usually because other investors don’t like something about the stock.
This principle is true not only of stocks, but also bonds, real estate, and other investments. For example, low-rated bonds with a substantial risk of default are called junk bonds. John Kenneth Galbraith, an illustrious Harvard professor, wrote that “anyone who buys a junk bond known as a junk bond deserves on the whole to lose.” Why would any rational investor buy a junk bond when it is clearly labeled a junk bond? Because everything has a price. As long as a bond has some chance of paying some interest, somebody will pay some price for it. The price will be low and the potential yield high, but there will be a buyer. That is why junk bonds are also known euphemistically as high-yield bonds—they must offer high yields to persuade investors to hold them.
During the savings and loan crisis in the 1980s, some S&Ls bought junk because they were buying it with other people’s money—their federally insured deposits. S&Ls were willing to borrow from their depositors at 5 to 10 percent interest to invest in junk bonds promising 15 to 20 percent returns because the profits, if any, would go to the S&L and the losses would be covered by federal deposit insurance. Heads, the S&L wins. Tails, the federal government loses.
As it turned out, up until the end of 1989, junk bonds were profitable for thrifts. A 1989 General Accounting Office report found that junk had not contributed to the S&L crisis up to that point and that junk bonds had, in fact, been one of the S&L industry’s most profitable investments.
However, the years surveyed in this report had been recession free. Concerned about potential future defaults and recognizing the one-sided bets S&Ls were making with federally insured deposits, the 1989 Financial Institutions Reform, Recovery, and Enforcement Act (FIRREA) prohibited thrifts from buying additional junk bonds and gave them five years to sell their current holdings. As FIRREA neared completion, some thrifts made substantial last-minute junk purchases. One industry analyst said that these thrifts “realized this was their last window of opportunity, so they jumped in. It was a case of speeding up at the yellow light.” During the last forty days before FIRREA was enacted, ten of these hot-rod thrifts bought a total of more than $1 billion in junk bonds, increasing their holdings by 19 percent.
In retrospect, their timing couldn’t have been worse. With further purchases prohibited and sales mandated, FIRREA created an excess supply of junk. Coupled with Drexel-Burnham’s bankruptcy, the junk bond market collapsed, as prices fell some 10 to 15 percent in the first three months after FIRREA’s prohibition went into effect. The same industry analyst quoted previously continued the analogy: “After they got to the [yellow] light, the market went over the cliff.”
This is yet again an example of how market prices need not equal the best estimate of the value of an investment. Junk bonds were not more likely to default after FIRREA passed. The intrinsic value of their anticipated cash flow was unchanged, yet market prices collapsed because thrift institutions could no longer hold junk. It is as if prohibiting pension funds from buying Coca-Cola stock somehow changed the intrinsic value of Coke stock.
Trust Company of the West (TCW) recognized that the drop in junk prices was not warranted. Wall Street was having a sale on junk bonds and TCW loaded up. It turned out to be a spectacular investment. After the junk collapse, junk bond prices nearly doubled over the next three years—which is yet another example of the first lesson to be learned from my energy investment: A contrarian strategy can be wise, not foolish.
A second lesson from my energy investment is: don’t panic if Mr. Market doesn’t like your investment. The tax benefits from harvesting losses is a good reason to sell stocks that have gone down in price. Selling because you fear prices may fall further is not a good reason. If anything, falling prices may be a persuasive reason to buy more.
The third lesson is a reminder that contrarian investors need to have the temperament to buy stocks that others hate and resolve not to panic if prices fall.
AT&T CANADA
When AT&T acquired the Canadian telephone company Metronet (renamed AT&T Canada) in June 1999, foreigners were not allowed to own more than 33 percent of a Canadian company; so AT&T bought 31 percent of the shares and agreed to buy the remaining 69 percent by June 2003, either for itself or for resale to a Canadian company. AT&T agreed to a floor on the buyout price starting at $37.50 Canadian dollars in June 2000, with the floor rising by 17 percent a year to $60 in June 2003. To prevent an infinite stalling strategy, AT&T also agreed that if it had not purchased the remaining 69 percent by July 2003, it would sell AT&T Canada and pay whatever was needed to ensure that AT&T Canada shareholders got at least their preset floor.
At the time of the acquisition in June 1999, AT&T Canada stock was selling for $84.01. AT&T had big plans for making the company even more valuable, so the floor price did not seem like a big deal. However, AT&T Canada floundered, losing $325 million in 2000 and $456 million in 2001, and its stock price fell below the floor in May 2001. I saw a story about this unusual situation in October 2001. Since the floor was guaranteed to increase by 17 percent a year, it seemed like a guaranteed annual return of 17 percent.
I did a little research and found that some hedge funds had noticed this quirky situation, too, and their lawyers had concluded that about the only way AT&T could get out of the contract was to declare bankruptcy, which seemed unlikely since they had far more assets than the cost of fulfilling their AT&T Canada commitment. The only real uncertainty for American investors (like me) was that the buyout price was in Canadian dollars and I live my life using U.S. dollars. If the value of the U.S. dollar were to drop relative to the Canadian dollar, my annual return would be less than 17 percent. Of course, if the U.S. dollar were to appreciate, my annual return would be more than 17 percent. I figured that the U.S. dollar was as likely to appreciate as depreciate, so I was looking at an expected annual return of 17 percent. I also figured that AT&T knew that the cost of fulfilling this contract was rising by 17 percent a year, so it would buy the shares as soon as possible.
This was definitely not a value play. AT&T Canada was a mess. It was losing money and paid no dividends—not the honey that attracts value investors. Still, it seemed to be a unique opportunity. I bought shares in October 2001 at a price equal to the current floor price and, a year later, in October 2002, AT&T fulfilled its contractual obligation by purchasing the remaining 69 percent stake at the prevailing floor price. I had my 17 percent return.
LEHMAN BROTHERS
Henry, Emanuel, and Mayer Lehman, the sons of a Bavarian cattle merchant, immigrated to Montgomery, Alabama, in the 1840s. They started a dry-goods store in 1844 that evolved into a cotton-trading business and, eventually, the fourth-largest U.S. investment bank in 2002—named, appropriately enough, Lehman Brothers.
Between 2002 and 2007, Lehman invested heavily in mortgages made to so-called subprime borrowers who would not normally qualify for mortgages. At the time, many investment banks bundled mortgages into mortgage-backed securities. Traditionally, home buyers borrowed money from a local bank and paid off their mortgage over, say, thirty years. A mortgage-backed security is a collection of mortgages purchased from banks and resold to investors, with the monthly mortgage payments passed through to the owners of the mortgage-backed security.
In theory, mortgage-backed securities allow insurance companies, pension funds, and other investors to make home loans part of their portfolios. They also channel more money to mortgage lending because every time a bank makes a mortgage loan and sells it, the bank gets more money for more mortgage loans.
In practice, local banks are best able to evaluate the strength of the local real estate market and the creditworthiness of borrowers, and they have a clear incentive to do so when they are going to hold a mortgage for thirty years. If the borrower defaults, the bank is stuck with the bad loan. However, if the mortgage is sold to someone else, it is no longer the bank’s problem; so the bank doesn’t have as much incentive to scrutinize loans carefully. Banks made profits based on the number of mortgages they originated, not on the monthly mortgage payments.
This problem was exacerbated by the creation of national mortgage brokers who have little knowledge of local real estate markets and no personal knowledge of loan applicants. Their compensation is based on making mortgages, and making mortgages is what they did, including NINJA loans to applicants with No Income, No Job, and No Assets. At the first sign of trouble, the borrower disappears like a Ninja in the night. Too many mortgage loans were made (often at initially low teaser rates) to people who had no realistic chance of making the mortgage payments. Too many mortgage brokers got rich selling NINJA loans to unsuspecting investors.
Somehow, these mortgage-backed bundles of subprime loans were rated AAA, and naive investors bought them. The idea must have been that the odds were low that every NINJA loan would default. But if NINJA borrowers were counting on home prices rising and selling their homes before the teaser loan rates expired, most NINJA borrowers would be in trouble if home prices stopped rising.
Not only that, but investment banks created collateralized debt obligations (CDOs), which are bundles of mortgage-backed securities sliced into so-called tranches. Investors who bought the lowest (“junior”) tranches received a disproportionate share of the interest and coupons from the underlying mortgages, but were the first to lose their income if borrowers defaulted. Investors who bought the highest (“senior”) tranches received less interest and coupons, but were the last to be affected if borrowers defaulted.
As if that weren’t complicated enough, investment banks created CDOs-squared, which are CDOs backed by the tranches of other CDOs. A junior CDO-squared consisted of junior tranches from several CDOs. In theory, this offered more diversification than a junior tranche from a single CDO. In practice, if falling home prices caused one junior CDO to crash, most would.
The legal documents were thousands of pages long, read by few, and understood by fewer. Many investors ignored the sound advice, “Don’t invest in something you don’t understand.”
Lehman created a lot of CDOs and ended up holding a lot of the junior tranches. We don’t know if this was because Lehman couldn’t offload the junior tranches to other investors or if Lehman thought junior tranches were a profitable investment. Lehman was highly leveraged, borrowing billions of dollars to invest billions of dollars. When the profits on their investments were larger than the interest on the loans used to finance these investments, Lehman’s employees and stock holders made a lot of money. Lehman’s CEO, Richard Fuld, was paid $485 million between 2000 and 2007.
It is wise advice to expect the unexpected. Lehman expected the expected until the unexpected happened. Home prices stopped rising and started falling. Strapped borrowers couldn’t make their mortgage payments and couldn’t sell their homes for enough money to pay off their mortgages. Home builders stopped building and ripples from unemployed construction workers spread through the economy. Many borrowers lost their jobs and then their homes. Lehman started losing lots of money on its highly leveraged CDOs.
Lehman was also heavily involved with credit default swaps. In a credit default swap (CDS), one party pays a fee to pass the risk of a loan or bond default on to someone else. For example, a pension fund might own a bond issued by a corporation or foreign government and be concerned that the borrower may default. The pension fund buys a CDS from a third party, which agrees to buy the bond from the pension fund at face value if the borrower defaults.
The pension fund has purchased default insurance. In theory, the third party that sold the insurance is acting like all sensible insurance companies. It has assessed the chances of default and determined that the expected value of the cost is less than the fee. If it is a large, financially secure institution with a diversified portfolio of credit default swaps, it assumes that it will be little affected by an occasional default. It will be in a world of trouble, however, if some macroeconomic event, like a global recession, causes a wave of defaults—just like insurance companies operating in Chicago were bankrupted by the Great Chicago Fire of 1871.
A lot of institutions didn’t use credit default swaps for insurance, but for speculation. A hedge fund might buy billions of dollars of credit default swaps on bonds it doesn’t own, which is an unhedged bet that the borrowers will default. Lehman had, in fact, purchased $250 billion in CDS contracts on bonds it didn’t own. Ironically, $400 billion in CDS contracts had been created by investors who wanted to bet for and against Lehman’s bankruptcy.
The U.S. Treasury and Federal Reserve have often operated under the assumption that some companies are “too big to fail,” meaning that because of the interconnected nature of the financial system, the failure of a large company will have ripple effects that cripple the economy. If a large bank fails, it won’t be able to repay its loans from other banks. If these other banks can’t collect their loans, they may go bankrupt, too, which means they can’t repay their loans. Perhaps even worse, if companies are worried about a company failing, they won’t lend them money or sell them anything for fear that they won’t be repaid. For a bank, this might mean they can’t buy stocks or bonds; for an industrial company, it might mean that they can’t buy the raw materials they need to keep operating. It becomes a self-fulfilling prophecy in that, unable to borrow money or buy things, a company that is thought to be in danger of failing does fail. The larger the company, the larger the risk of a contagious collapse. Thus the federal government considers some companies to be too big to fail. If a too-big-to-fail company is endangered, the Treasury and Fed step in to lend it money to save the company (and the financial system).
The unintended consequence is that companies that consider themselves too big to fail are encouraged to take excessive risks, knowing that they will reap outsize gains if their gambles pay off and that they will be bailed out by the government if their gambles fail.
In March 2008, Bear Stearns was rocked by losses on its subprime mortgages, mortgage-backed securities, and CDOs. The Federal Reserve acted quickly to supply $29 billion to finance JPMorgan Chase’s purchase of Bear Stearns, explaining that it wanted to avoid a “chaotic unwinding” of Bear Stearns investments.
Six months later, Lehman Brothers was hit by life-threatening losses from its subprime mortgage securities. Lehman’s stock price collapsed and a Wall Street friend told me that Lehman stock was a great investment. Lehman Brothers’ real estate alone was worth more than its stock was selling for and the government wouldn’t let such a prominent bank fail. I invested a small amount ($20,000) because I thought my friend might be right, but I kept my investment small because I knew that, no matter how valuable its real estate, its mortgage-related losses might be even larger.
At the same time that the federal government was pushing Bank of America to acquire financially troubled Merrill Lynch, the Treasury and Fed stood aside and let Lehman fail (perhaps because of criticism of the Bear Stearns bailout, perhaps because Treasury Secretary Henry Paulson had been CEO of Goldman Sachs and this somehow influenced the decision to save one company and not the other).
Ironically, Lehman’s failure confirmed the too-big-to-fail argument by precipitating a financial crisis and near meltdown of financial firms and markets worldwide. Paulson persuaded Congress to authorize a $700 billion bailout fund, of which $160 billion was used to prop up American International Group (AIG) and another $170 billion was used to stabilize the nine largest U.S. banks.
My friend was wrong, and we got burned. In retrospect, it was not a sure thing, one way or the other. It was a gamble because investors didn’t know the extent of Lehman’s losses or whether the federal government would bail out Lehman. I might have won my bet, but I didn’t. Lehman was a hot tip that fizzled.
CROSSLAND SAVINGS
The U.S. banking system has a wild and scary history. The Bank of the United States was founded in 1791, with $2 million raised from the federal government and $8 million from private citizens. Modeled after the Bank of England, its eight branches stored private and government deposits and made loans to citizens and to the government. The Bank also issued bank notes (currency) that could be redeemed for gold or silver. At the time, fewer than a hundred other banks were in operation, all smaller and located on the East Coast.
In 1810, on a narrow vote, Congress failed to renew the Bank’s charter and it closed. In the succeeding ten years, state-chartered banks and bank notes of varying repute multiplied. One historian wrote that “corporations and tradesmen issued ‘currency.’ Even barbers and bartenders competed with banks in this respect . . . nearly every citizen regarded it as his constitutional right to issue money.” One successful Midwestern banker related his start in the business: “Well, I didn’t have much to do and so I rented an empty store and painted ‘bank’ on the window. The first day a man came in and deposited $100, and a couple of days later, another man deposited another $250 and so along about the fourth day I got confidence enough in the bank to put in $1.00 myself.”
In 1816 the Second Bank of the United States was chartered. It actively speculated, particularly in western land, and its Baltimore branch made so many bad loans that it went bankrupt in 1818. In 1819 a new head of the Second Bank reduced its speculative activities by restricting new loans and forcing some borrowers to pay off old ones, putting a discernible crimp in commerce. The next president of the Second Bank, Nicholas Biddle, reinstituted the First Bank’s policy of refusing to accept bank notes that were not redeemable in gold or silver.
Because of these unpopular policies, the fight to renew the Bank’s charter in 1832 was bitter. (Biddle’s brother, who was director of the St. Louis branch, was killed in a duel fought at a distance of five feet because of Biddle’s nearsightedness.) The populist president Andrew Jackson removed government deposits from the Second Bank and vetoed a bill renewing its charter. Rechartered by the state of Pennsylvania, Biddle’s bank failed in 1841 after excessive speculation and questionable loans to bank officers.
After the restraining power of the Second Bank of the United States was lifted, there was a surge of new banks and of unbacked bank money. Banks in the East were usually managed conservatively, with substantial reserves of gold and silver and a readiness to redeem their money with precious metal. Banks in other parts of the country were more loosely managed and were willing to lend unbacked paper to farmers and businessmen settling new territories. When the land was fertile and business good, the communities and their banks prospered; when crops and businesses failed, their banks failed with them.
Thousands of private banks were established by financiers, blacksmiths, trading-post owners, and other entrepreneurs. Banks were regulated by the states in which they operated, and regulations regarding precious-metal reserves were unevenly enforced. A Massachusetts bank with $500,000 in notes outstanding was found to have $86.48 in reserves. In Michigan, a common collection of reserves (including hidden lead, glass, and tenpenny nails) passed from bank to bank, ahead of the state examiners. Opening a bank and issuing bank notes seemed like a pretty easy way literally to make money. It was an occupation that attracted the most reputable and public-spirited people and the lowest and most down-and-out scoundrels. Many helped the country prosper, and many simply redistributed its wealth.
By the time of the Civil War, there were some 7,000 different types of bank currency in circulation, of which 5,000 were counterfeit issues. Because of widespread uncertainty about the financial condition of banks (and the authenticity of notes), bank notes traded at discounts from their face value. For example, a merchant might accept a $10 bank note in payment for $8 worth of merchandise. With the South and the Mississippi Valley not represented in Congress, the federal government levied a 1%, 2%, and then 10% annual tax on currency issued by state-chatered banks. State bank notes consequently declined, replaced by checking accounts. Nationally chartered banks issued national bank notes, which were more uniformly printed and backed by government bonds deposited with the Treasury.
Most countries have just a handful of banks, with hundreds of branches. By the 1980s, there were tens of thousands of banks in the United States, mostly mom-and-pop banks protected by anticompetitive laws. Banks were not allowed to pay interest on checking accounts and there were interest-rate ceilings on savings accounts. Banks were not allowed to cross state lines, and the number of branches within a state were limited. In Illinois, for example, banks could only have one branch, which kept the big banks in Chicago from poaching customers throughout rural Illinois.
Eventually, technological advances and political pressure from consumers and big banks led to a consolidation of the U.S. banking system, accelerated by the financial crises in the late 1970s and early 1980s.
In New York, for example, many small banks had been established decades ago to serve local neighborhoods or groups sharing a common ethnicity or occupation. One of these banks was Brevoort Savings Bank, founded in 1890 by Henry Lefferts Brevoort, whose family tree traced back to the first Dutch settlers in Brooklyn. The Brevoorts intended the Brevoort Savings Bank to provide safe deposits and fair loans to local families, who would no longer have to travel miles to get to a bank. Brevoort Savings Bank was the only bank in the Bedford neighborhood of Brooklyn, which had been settled by the Dutch in the 1600s. Brevoort was always well run, but it succumbed to the merger wave in the 1970s and 1980s, as small banks consolidated and, in essence, became branches of a larger entity.
The East Brooklyn Savings Bank, which had been chartered in 1860, changed its name to the Metropolitan Savings Bank (Brooklyn) in 1969 and acquired Brevoort Savings Bank in 1970, Fulton Savings Bank (Brooklyn) in 1977, Spring Valley Savings & Loan Association in 1980, Brooklyn Savings Bank in 1981, and Greenwich Savings Bank in 1981.
Most of these banks were more than 100 years old. Brevoort had been chartered in 1890, Fulton in 1870, Spring Valley in 1889, Brooklyn Savings in 1827, and Greenwich in 1833. The acquisition of the Greenwich Savings Bank included its majestic headquarters (now called the Haier Building and a New York City landmark), which has a domed ceiling with a 3,000-square-foot, 72-foot-high stained-glass skylight.
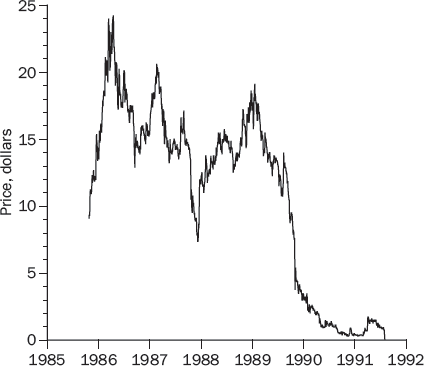
The Metropolitan Savings Bank changed its name to the Federal Metropolitan Savings Bank in 1983 and to Crossland Savings in 1985. Headquartered in Brooklyn, Crossland Savings was the largest savings bank in New York State in the 1980s. With $6.5 billion in deposits, Crossland moved away from traditional residential mortgage lending in the 1980s into commercial real estate loans. Commercial real estate is risky because of uncertainties about rental rates and occupancy rates. If rents turn out to be lower than predicted or expenses and vacancy rates turn out to be higher than expected, commercial borrowers may fall behind or even default on their loans. On the other hand, banks can generally charge higher rates on commercial real estate loans than on residential mortgages because the risks are greater. By the end of the 1980s, half of Crossland’s loans were for commercial real estate, including acquisition and construction loans. Crossland lost $442 million in the first nine months of 1989, mostly due to delinquencies and defaults on its real estate loans. Rumors circulated that Crossland was on the verge of collapse and its stock price plummeted.
Was this an overreaction, or was Crossland going through its death throes? The manager of one of the nation’s largest college endowments told me that he was investing in Crossland Savings because it had an irresistible stockpile of unused capital losses. He expected a profitable bank to buy Crossland in order to use these accumulated capital losses to reduce its taxable income. By his reckoning, the capital losses alone were worth much more than the market price of Crossland’s stock, not to mention the real estate its 110 branches were sitting on. The $5 billion in deposits, mostly from hundreds of thousands of small depositors who didn’t seem to mind being paid relatively low interest rates, was also a plus, though the hundreds of millions of dollars in delinquent loans were a big minus.
I hadn’t been investing long and figured that this endowment manager knew more than I did, so I bought a few thousand dollars’ worth of Crossland stock in 1990. Figure 15-3 shows what happened.
In an unexpected twist, Crossland was accused of tax fraud in 1991. Crossland was said to have set up six dummy companies in Delaware and shifted $152 million of its income to these Delaware companies in order to avoid paying New York state and city taxes on the income. This accusation was not the reason for Crossland’s failure, but it suggested that something might be amiss in their operations and/or accounting.
The Federal Deposit Insurance Corporation (FDIC) took over Crossland in 1992 and pumped in $1.2 billion to keep it afloat. Three years later the FDIC sold Crossland to Republic Bank of New York for $529.6 million. My friend’s hot tip was not so hot. (Note to self: Be skeptical of hot tips, even tips from highly reputable and successful investors.)
ROYAL DUTCH/SHELL
The Royal Dutch Petroleum Company (based in the Netherlands) and the Shell Transport and Trading Company (based in the United Kingdom) joined forces in 1907 to do battle with John D. Rockefeller’s Standard Oil, the largest oil refiner in the world. Royal Dutch would focus on production, Shell on distribution. Together, they might survive.
The curious thing about their agreement was that Royal Dutch and Shell kept their existing shareholders and their stock continued to trade on various stock exchanges even though all revenue and expenses were consolidated by the mothership, named Royal Dutch Shell, which was owned 60 percent by Royal Dutch Petroleum and 40 percent by Shell. Whatever earnings Royal Dutch Shell reported, 60 percent were attributed to Royal Dutch Petroleum, 40 percent to Shell. Whatever dividends Royal Dutch Shell paid, 60 percent went to Royal Dutch Petroleum shareholders, 40 percent to Shell shareholders. If Royal Dutch Shell were ever to be sold, 60 percent of the proceeds would go to Royal Dutch Petroleum shareholders, 40 percent to Shell shareholders.
On intrinsic value grounds, whatever Shell Transport was worth, Royal Dutch Petroleum was worth 50 percent more. If the stock market valued these stocks correctly, the market value of Royal Dutch Petroleum stock should always be 50 percent higher than the market of Shell Transport stock. But it wasn’t!
Figure 15-4 shows the ratio of the market value of Royal Dutch Petroleum stock to the market value of Shell Transport stock from March 13, 1957, when both stocks were traded on the New York Stock Exchange, until July 19, 2005, when the two companies merged fully and their stocks stopped being traded separately.

Royal Dutch Petroleum stock was seldom worth exactly 50 percent more than Shell stock. Sometimes it was 40 percent overpriced; sometimes it was 30 percent underpriced. Even if there had been a logical reason for Royal Dutch to be worth more or less than 50 percent of Shell (and there wasn’t any that I could think of), there was certainly no reason why the excess or deficit should fluctuate wildly. Forty-six percent of the time, the mispricing was larger than 10 percent; 18 percent of the time, the mispricing was larger than 20 percent.
In theory, arbitragers could have profited handsomely from this mispricing, and their arbitrage trades should have eliminated the mispricing. When Royal Dutch traded at a premium to the 1.5 ratio, an arbitrager could have bought Shell stock and sold Royal Dutch stock short, betting on the premium disappearing, and these purchases of Shell and short sales of Royal Dutch should have helped the premium vanish.
This is exactly what one hedge fund, Long-Term Capital Management, did in 1997, when the premium was 8 to 10 percent. Long-Term bought $1.15 billion of Shell stock, sold $1.15 billion of Royal Dutch stock short, and waited for the market to correct. Long-Term was run by an all-star management team, including two finance professors who won Nobel prizes in 1997, and its Royal Dutch/Shell hedge was a smart bet based on persuasive logic, not just statistical patterns that may have been coincidental and meaningless. The ratio of the market values should go to 1.5 eventually and Long-Term would profit from its smart hedge.
However, as Keynes observed during the Great Depression:
This long run is a misleading guide to current affairs. In the long run we are all dead. Economists set themselves too easy, too useless a task if in tempestuous seasons they can only tell us that when the storm is past the ocean is flat again.
Keynes was mocking the belief that, in the long run, the economy will be calm and everyone who wants a job will have a job. Keynes believed that the storm of an economic recession is more important than a hypothetical long run that no one will ever live to see. It is the same in finance. Trades that might be profitable in the long run can be disastrous in the short run.
Long-Term’s net worth at the beginning of 1998 was nearly $5 billion. In August, an unforeseen storm hit. Russia defaulted on its debt and perceived measures of risk rose throughout financial markets. Long-Term had placed bets in many different markets, but an awful lot of them were bets that risk premiums would decline. After the Russian default, risk premiums rose everywhere, and Long-Term was in trouble—big trouble.
Long-Term argued that all it needed was time for financial markets to return to normal—for the storm to pass and the ocean to become flat again—but Long-Term didn’t have time. Its tremendous leverage created enormous losses. Long-Term lost $550 million on August 21, 1998, and $2.1 billion for the entire month, which was nearly half its net worth.
Long-Term tried to raise more money so that it could wait out the storm, but frightened lenders didn’t want to lend it more money. They wanted their money back.
Keynes was not only a master economist; he was also a legendary investor. Remember his observation: “Markets can remain irrational longer than you can remain solvent.” Perhaps markets overreacted to the Russian default. Perhaps Long-Term’s losses would have turned into profits eventually. But it couldn’t stay solvent long enough to find out.
Long-Term Capital Management had to close its Royal Dutch/Shell position, and unfortunately, the Royal Dutch premium, instead of declining, had gone above 20 percent and Long-Term lost $150 million.
On September 23, 1998, Warren Buffett faxed Long-Term a one-page letter offering to buy the firm for $250 million, roughly 5 percent of its value at the beginning of the year. The offer was take it or leave it and would expire at 12:30 p.m., about an hour after the fax had been sent. The deadline passed and the funeral preparations began.
The Federal Reserve Bank of New York feared that the domino effect of a Long-Term default would trigger a global financial crisis. The Federal Reserve and Long-Term’s creditors took over the hedge fund and liquidated its assets. The creditors got their money back, Long-Term’s founding partners lost $1.9 billion, and other investors got an expensive lesson in the power of leverage.
Notice in Figure 15-4 that premium did disappear eventually, when the companies merged in 2005, with the Royal Dutch shareholders getting 60 percent of the shares in the combined company and Shell shareholders getting 40 percent.
The Royal Dutch/Shell mispricing is compelling evidence that Mr. Market’s prices are sometimes wacky. Whatever the “correct” value of Shell stock, Royal Dutch was worth exactly 50 percent more, yet Mr. Market quoted prices sometimes higher and other times lower. This example also demonstrates how arbitrage does not necessarily eliminate mispricings and how arbitrage can be risky, even if done correctly by the best and brightest investors. An academic study of a dozen comparable arbitrage situations found that in many cases the mispricing lasted for several years and worsened before it improved.
Personally, I learned of the Royal Dutch/Shell mispricing in the early 1990s, but I never took a hedged position—partly because of the risk and partly because of my (perhaps irrational) dislike of short sales. I also never invested in Royal Dutch Petroleum or Shell Transport—though, if I had, I would have picked the one that was cheaper.
The main lesson for value investors is simple. Some aficionados of the efficient market hypothesis believe that stock markets can be trusted to set the correct prices—and that investors should accept these prices as the best estimates of what a stock is really worth. Balderdash! It is hard to disprove their fanciful claim for most stocks because we don’t know for certain what a stock is really worth. The Royal Dutch/Shell example is one case where we do know exactly what Royal Dutch stock was worth in comparison to Shell stock—and we know that market prices were wrong, by a substantial amount and for a long period of time.
The fact that Mr. Market’s prices are sometimes silly and usually too volatile means that value investors can take advantage of Mr. Market’s fickleness. However, value investors should still ask themselves if they know something Mr. Market doesn’t know. Value investors should not buy Apple stock just because iPhone sales increased, since other investors surely know that, too. But value investors should not be intimidated by arguments—even from Nobel laureates—that market prices are the best estimates of what stocks are worth.
UNILEVER
Unilever was created in 1930 by the merger of the Dutch company Margarine Unie and the British company Lever Brothers—hence the name Unilever. The Dutch company made margarine and the British company made soap, and both products are made with palm oil, so it made sense to join forces and negotiate lower prices for imported palm oil. Today, Unilever is one of the world’s largest consumer-goods companies, with more than 400 brands, including Axe/Lynx fragrances, Dove toiletries, Hellmann’s mayonnaise, and Lipton tea.
The 1930 merger maintained two separate companies that are treated as equals: Unilever NV, headquartered in Rotterdam, and Unilever PLC, headquartered in London. The two companies have the same CEO and board of directors. The shareholders have the same rights and are paid the same dividends.
Both companies have the same intrinsic value, yet the market prices of their stocks sometimes diverge.
Figure 15-5 shows the ratio of the price of Unilever PLC to Unilever NV back to 1960, when both stocks were traded on the New York Stock Exchange. Up until the 1980s, the mispricing was astounding. Eighty-seven percent of the time, the mispricing was larger than 10 percent; 53 percent of the time, the mispricing was larger than 20 percent. Figure 15-5 shows that the mispricing often lasted years and got worse before it got better, though the mispricing has been smaller in recent years.
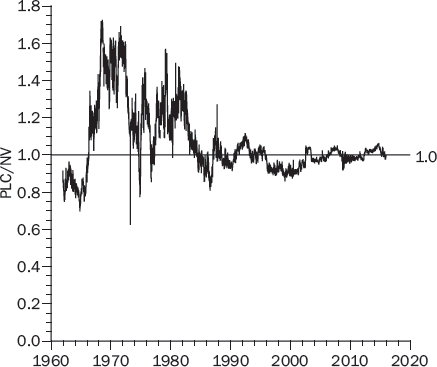
(Even if there is some overlooked reason why one company is worth more than the other, the company’s stock should consistently reflect this advantage. For example, if Unilever PLC was worth 5 percent more than Unilever NV, the ratio of their market values should always be 1.05, not sometimes 1.7 and other times 0.6.)
Like the Royal Dutch/Shell mispricing, this example is more indisputable evidence that markets do not invariably set “correct” prices, in any meaningful sense of the word. No matter what the intrinsic value of Unilever PLC, the intrinsic value of Unilever NV is identical. If the stock market sets different prices for these two stocks, at least one price does not equal intrinsic value. Most likely, neither price is equal to intrinsic value.
As with the Royal Dutch/Shell mispricing, I never tried to arbitrage the Unilever mispricing by buying one stock and shorting the other. I have invested in Unilever—always choosing whichever stock was cheaper at the time.