
8
HTTP Server-Side Monitor
CERTIFICATION OBJECTIVES
• Using the HTTP Server-Side Monitor
Q&A Self Test
NetBeans includes the HTTP Server-Side Monitor (HSSM), a powerful tool for monitoring and debugging HTTP traffic. This tool has a variety of uses ranging from troubleshooting web services and analyzing Ajax calls to monitoring and capturing server traffic. This chapter requires a working knowledge of the HyperText Transfer Protocol (HTTP) standard. HTTP is an application layer protocol used in distributed information systems. The initial version HTTP 1.0 was released in 1996 and is not an official Internet standard. However, you can read up on its specification RFC 1945 at http://ftp.ics.uci.edu/pub/ietf/http/rfc1945.html. HTTP 1.1, which was released in 1999, is the current standard. HTTP 1.1 was developed by the Network Working Group of the Internet Engineering Task Force (IETF). You can read up on the HTTP 1.1 specification RFC 2616 at http://www.w3.org/Protocols/rfc2616/rfc2616.html. Throughout the chapter we reference parts of the specification, but the primary focus is on using the HSSM.
If you have done Servlet programming, you are familiar with the doGet and doPost methods. To capture the exact parameters that are passed to these methods, you would need to dump them to standard out, route the parameters through a logging API, or wait to see where the data ends up in your application. With the HSSM, these extra logging steps are not necessary because the monitor captures all GET and POST messages for you and allows you to view and analyze the information very easily. If you are not smiling now, you should be, because the HSSM makes software developers’ lives a lot easier when they need it the most.
This chapter more than prepares you for the types of questions you will find on the exam relative to the monitor. Not only will the preparation from this chapter allow you to score well on the exam, but you will have found a new HTTP monitoring tool that you can use quite frequently at work, if you are not using it already.
CERTIFICATION OBJECTIVE: Using the HTTP Server-Side Monitor
Exam Objective 4.4 Describe how to monitor HTTP requests when running a web application.
Viewing the HTTP request messages and their responses can be invaluable when analyzing system activity. Thankfully, monitoring HTTP request messages is as simple as viewing records in the HSSM. To properly prepare you for exam-related questions on the HSSM, this stand-alone section of the chapter gives you a refresher on some elements of the HTTP standard, instructions for configuring the HSSM, and in-depth pointers enabling you to fully exploit this powerful tool.
![]() The HyperText Transfer Protocol Standard
The HyperText Transfer Protocol Standard
![]() HTTP Server-Side Monitor Setup
HTTP Server-Side Monitor Setup
![]() HTTP Server-Side Monitor Usage
HTTP Server-Side Monitor Usage
The HyperText Transfer Protocol Standard
The HyperText Transfer Protocol is an Application layer protocol for distributed computing. The Application layer is part of the Internet Protocol Suite as defined by the Internet STD, RFC 1122 specification. The other layers include the Transport layer, Internet layer, and the Link layer. Figure 8-1 represents the HTTP Stack relative to the Internet Protocol Suite.
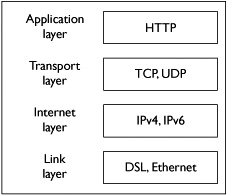
HTTP typically makes use of the TCP Transport layer, but may use other transport protocols such as UDP. Being an application protocol, HTTP communicates via sessions, transactional sequences of network request-responses. HTTP request messages consist of a request line (for example, GET statement), headers, an empty line, and an optional message body. HTTP responses include a status line (that is, status code message), a general message, and the requested resource in the body that may be application data or an error message.
The following sections provide a quick look at some of the additional elements making up the HTTP standard including HTTP request methods, HTTP headers, and HTTP status codes.
HTTP Request Methods
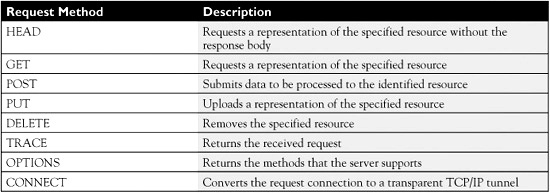
The HTTP standard defines methods for actions to be performed on identified resources. The resource may correspond to data or a file (for example, requesting an image). Table 8-1 defines the eight HTTP request methods.
TABLE 8-1 HTTP Request Methods and Descriptions
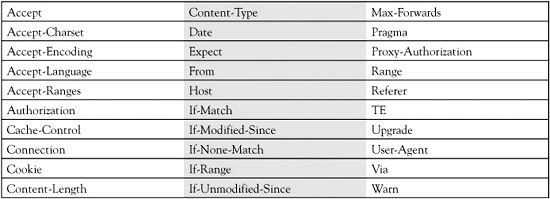
HTTP Headers
HTTP headers make up the main part of an HTTP request. The headers define characteristics of the data that is being served. Table 8-2 provides a list of HTTP headers. To learn more, go to Wikipedia: http://en.wikipedia.org/wiki/List_of_HTTP_headers.
HTTP Response Status Codes
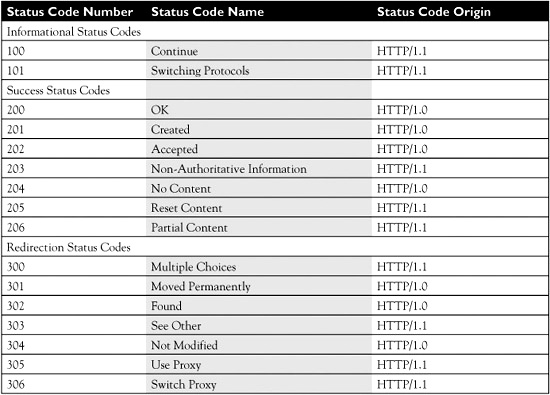
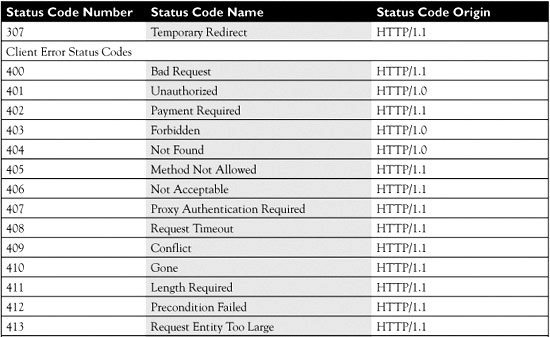
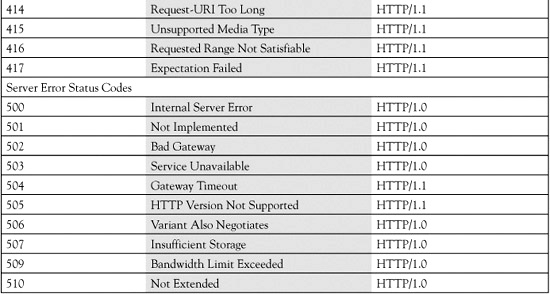
There are numerous HTTP response status codes. They are broken into five categories: Informational, Success, Redirection, Client Error, and Server Error. Each category starts with a number from 1 to 5, respectively, and each code must be three digits. Multiple standards have contributed to the list of HTTP response status codes, but we are concerned only with those derived from the original HTTP/1.0 and HTTP/1.1 specifications. These codes are shown in Table 8-3.
TABLE 8-3 HTTP/1.0 and HTTP/1.1 Response Status Codes
![]() RFC 1945 Hypertext Transfer Protocol—HTTP/1.0
RFC 1945 Hypertext Transfer Protocol—HTTP/1.0
![]() RFC 2616 Hypertext Transfer Protocol—HTTP/1.1
RFC 2616 Hypertext Transfer Protocol—HTTP/1.1
Additional HTTP status codes are listed at Wikipedia: http://en.wikipedia.org/wiki/List_of_HTTP_status_codes. These codes are primarily derived from the following RFCs:
![]() RFC 2295 Transparent Content Negotiation in HTTP
RFC 2295 Transparent Content Negotiation in HTTP
![]() RFC 2518 HTTP Extensions for Distributed Authoring—WEBDAV
RFC 2518 HTTP Extensions for Distributed Authoring—WEBDAV
![]() RFC 2774 An HTTP Extension Framework
RFC 2774 An HTTP Extension Framework
![]() RFC 2817 Upgrading to TLS Within HTTP/1.1
RFC 2817 Upgrading to TLS Within HTTP/1.1
![]() RFC 4918 HTTP Extensions for Web Distributed Authoring and Versioning (WebDAV)
RFC 4918 HTTP Extensions for Web Distributed Authoring and Versioning (WebDAV)
HTTP Server-Side Monitor Setup
For the most part, setting up the HTTP Server-Side Monitor is easy. It starts automatically for the Tomcat Web Server and is enabled by a checkbox in GlassFish’s server properties dialog box. However, using the HSSM with servers started outside of the IDE requires a little work the first time around. We will explore the setup steps of each.
![]()
Pressing CTRL-SHIFT-5 opens the HTTP Server-Side Monitor window.
![]() HSSM Setup and the Tomcat Web Server
HSSM Setup and the Tomcat Web Server
![]() HSSM Setup and the GlassFish Application Server
HSSM Setup and the GlassFish Application Server
![]() HSSM Setup and Servers Started Outside of the IDE
HSSM Setup and Servers Started Outside of the IDE
HSSM Setup and the Tomcat Web Server
The HSSM is automatically enabled and displayed when your application is deployed to the Tomcat Web Server. Let’s do just that and deploy a sample application to Tomcat. Set up the sample project named “JSP Examples (J2EE 1.4).” Right-click the project name in the Projects window and select Properties. In the Properties dialog box, select the Run node and ensure the Server setting is Apache Tomcat. Select OK. Now run the application. The HSSM automatically displays in the lower-right corner of the IDE, as shown in Figure 8-2.
FIGURE 8-2 The HTTP Server-Side Monitor

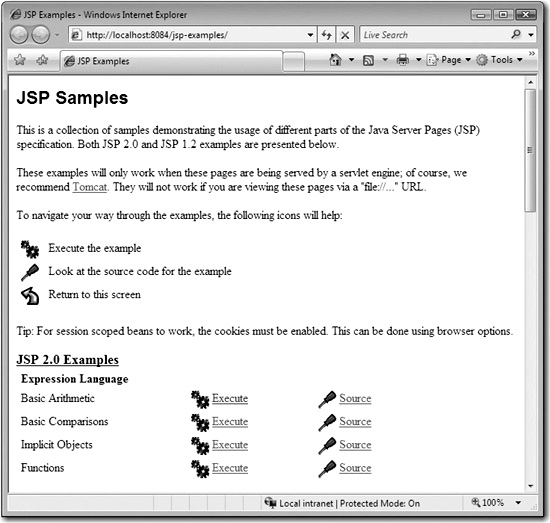
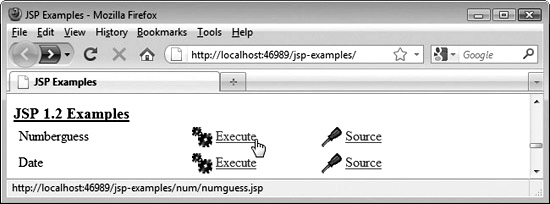
When you ran the sample application, the index.html file was loaded into the web browser, as shown in Figure 8-3. We will use this application later in the chapter as the stimulus for HTTP request messages that we will monitor in the HSSM.
FIGURE 8-3 JSP Examples (J2EE 1.4) sample application
HSSM Setup and the GlassFish Application Server
Configuring HSSM for GlassFish is also easy. The GlassFish application server, Sun Java System Application Server (SJSAS), and any other application server or web server registered with the IDE may have included the option to support configuration of the HSSM. This configuration option is controlled by an Enable HTTP Monitor checkbox in the Server properties dialog box. When you select the checkbox, an HTTP Monitor Effect confirmation dialog box opens with the following message, “Deploying apps with HTTP monitoring enabled eliminates the ability to cache static content for those web applications.” When you deselect the checkbox, a Disabling HTTP Monitor confirmation dialog box opens with the message, “To completely disable HTTP monitoring, you may need to undeploy all web applications that have been deployed since it was enabled.”
When the checkbox is selected, the HSSM displays output after the first HTTP request message is processed. The Properties dialog box is opened by either selecting Tools | Servers and the applicable application server node in the Servers list, or by going to the Services window (CTRL-5), and right-clicking Properties on a server’s node.
![]()
The name of the NetBeans HTTP monitoring tool was formally changed from HTTP Monitor to HTTP Server-Side Monitor in NetBeans 6.5. Since the exam targets NetBeans 6.1, you see it referred to as “HTTP Monitor.”
HSSM Setup and Servers Started Outside of the IDE
HSSM setup is possible for servers launched independently of the IDE. Many application servers and web servers are Java EE compliant, as shown in the third table of Chapter 4. Because of this compliance, they can be adapted for use with the HSSM.
The following steps set up HSSM for an external server:
1. In the WEB-INF/lib directory add the HSSM-related JAR files: orgnetbeans-modules-schema2beans.jar and org-netbeans-modules-web-httpmonitor.jar. These JAR files deploy with your application. You can find the files located in the NetBeans IDE installation directory.
2. In the WEB-INF/web.xml deployment descriptor file, add a filter declaration. This filter associates the HSSM module with the necessary HTTP request messages and associated functionality.
Note that the filter declaration may differ depending on the Servlet API version. There is little room for error when setting up a filter, so check with the latest NetBeans documentation when doing so. In short, you need to supply the filter class name (org.netbeans.modules.web.monitor.server.MonitorFilter), initialization parameter name (netbeans.monitor.ide), and parameter values specifying the IP address of the host(s), NetBeans version(s), and the application server port(s).
EXERCISE 8-1 Monitoring HTTP Requests Against GlassFish
The Calculator sample project consists of two projects, a calculator web server and a Servlet client. The client allows two numbers to be entered into a web page and forwarded to the calculator web service. The web service adds the numbers together and returns a result. The client renders the results to a new web page.
In this exercise, you set up the Calculator sample project so you can monitor the HTTP request messages being sent from the client application to the server application. In addition, you modify the values of the HTTP request through the HSSM, send the new request, and view the results in the web browser.
1. Set up the Calculator sample project. Select File | New Project. From the Categories list, choose the Web Services category from the Samples node. From the Projects list, select the Calculator project. Select Next and Finish.
2. Ensure configuration for the monitor is enabled. Select Tools | Servers. Select GlassFish v 2.1 or 3 in the Servers list. Ensure the Enable HTTP Monitor checkbox is selected.
3. Ensure GlassFish v 2.1 or 3 is associated with the project. Right-click the CalculatorApp node and select Properties. Select Run in the Project Properties window. Ensure the Server is set to GlassFish v 2.1 or 3.
4. Build and Run the CalculatorApp application.
5. Build and Run the CalculatorClientApp application. Make sure you have an association to the org.me.calculator package from the CalculatorApp project.
6. From the launched web page (that is, http://localhost:8080/CalculatorClientApp/), enter two numbers and select the Get Result button. A new web page displays the result.
7. In the HSSM, find and save the Get ClientServlet record.
8. Right-click the Get ClientServlet saved record, and select Edit and Replay. Supply new input values.
9. Send the new HTTP request from the monitor tool. The result displays in your web browser.
HTTP Server-Side Monitor Usage
Using the HTTP Server-Side Monitor is relatively easy. Once the monitor is set up, it’s just a matter of opening the window and working with the support components. The HSSM is divided into two panels where these components reside. The left panel is primarily responsible for management of the records. Components of the left panel include a toolbar and a node structure of All Records, Current Records, and Save Records. Toolbar and node behavior will be discussed shortly in the “Managing HSSM Records” section. The right panel is primarily for viewing/analyzing HSSM records and is discussed in detail in the “Analyzing HSSM Records” sections. One of the most useful features of the monitor is the ability to edit and replay records in order to send new HTTP request messages.
![]() Managing HSSM Records
Managing HSSM Records
![]() Analyzing HSSM Records
Analyzing HSSM Records
![]() Replaying HSSM Records
Replaying HSSM Records
Managing HSSM Records
Managing HSSM records is primarily done from the left panel of the HSSM. Deploy the JSP Examples (J2EE 1.4) sample application to the Tomcat Web Server or to the GlassFish Application Server, and you see a monitor window similar to that shown in Figure 8-4. Note that the tab for the HTTP Monitor window is on the far right, but it can be easily dragged to the left side as was done in Figure 8-5. In this section we focus on the left panel of the figure. We informally call this panel the HSSM Records Management panel. For GlassFish v3, brackets need to be removed from the project name, otherwise the application fails to deploy.
FIGURE 8-4 HTTP Server-Side Monitor against GlassFish Application Server
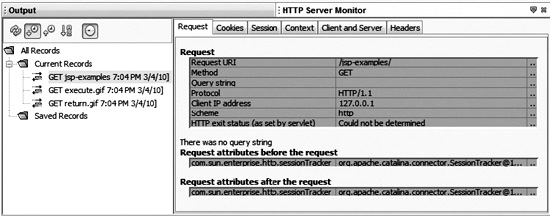
FIGURE 8-5 Menu items of HSSM records actions
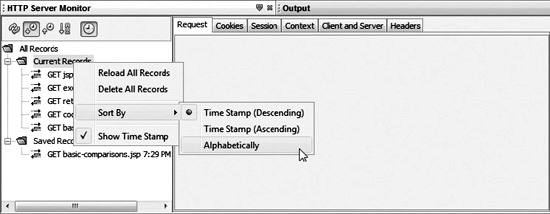
The HSSM Records Management panel is reserved for the record nodes and a supporting toolbar. The root node is the All Records node with subnodes of Current Records and Saved Records. The All Records node always shows the two subnodes. The subnodes can be expanded to display record nodes when the given node has one or more existing records.
Nodes have supporting popup menus that are available by right-clicking. The All Records, Current Records, and Saved Records nodes all have the same popup menus, as shown in Figure 8-5.
Menu items for these nodes share the same features of the toolbar, also shown in the figure. The functionality is self-explanatory, but we detail the features anyway in Table 8-4.
TABLE 8-4 Actions for Managing HSSM Records

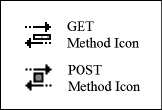
You may have noticed icons in the previous figures next to each HSSM record. These icons represent the type of HTTP request message. Icons for HTTP request messages that include the GET method have bidirectional arrows with a yellow centered rectangle. Icons for HTTP request messages that include the POST message have bidirectional arrows with a green centered square. Under normal conditions (that is, when processing of requests is successful), the icons display as previously described and as shown in Figure 8-6.
FIGURE 8-6 HTTP request method icons
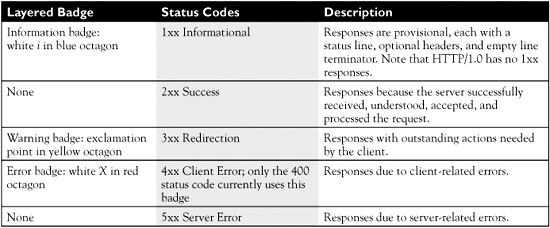
However, when HTTP response messages respond with other types of information, the method icons are marked with a badge. The badge or rather, miniature icon, represents a specific status code or group of status codes, as documented in Table 8-5.
TABLE 8-5 Badge Icons Related to HTTP Response Messages
For more information on status codes included in HTTP response messages reference the Status Code Definition web page of the HTTP standard on the www.w3.org website: http://www.w3.org/Protocols/rfc2616/rfc2616-sec10.html.
The last things to mention about the HSSM Records Management panel are the popup menus. These are launched by right-clicking a current or saved record. Records under the Current Records node have four menu items: Save, Replay, Edit and Replay, and Delete. Menu items are the same for records under the Saved Records node, but without the Save, because the record is already saved. The Save action moves records under the Current Records node to the Saved Records node. The Delete action deletes the record. The Replay and Edit And Replay actions are discussed in the “Replaying HSSM Records” section.
Analyzing HSSM Records
HSSM record nodes are recorded in the HSSM Records Management panel on the left side of the tool. On the right side of the tool is a panel that includes a series of tabbed windows for the display of information relative to each HSSM record (that is, HTTP request/response information). Each window has one or more tables providing information about the records. We informally call this right panel of the monitoring tool the HSSM Record View panel. The tabbed windows that are available in this panel are Request, Cookies, Session, Context, Client And Server, and Headers.
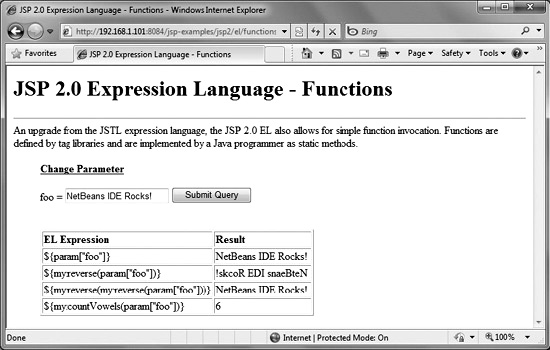
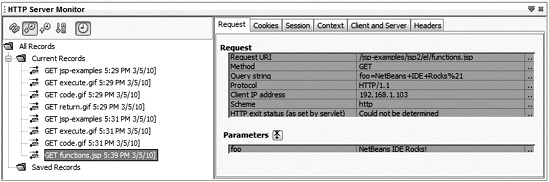
We look at these tables relative to a remote HTTP GET method request from the JSP Examples application. The GET message is sent after the Submit Query button is selected with the desired input field (for example, NetBeans IDE Rocks!), as shown in Figure 8-7. Unlike in the other examples, this call is performed from a remote machine on the LAN under test. In this example, the IP address for the remote client is 192.168.1.103, and the server IP address is 192.168.1.101.
FIGURE 8-7 Functions execution example in the JSP Examples sample application
As a simple exercise, look for this data in the upcoming tables.
Let’s take a look at the data in each of the tabbed windows.
Request Tab The Request tab of the HSSM Record View panel, as shown in Figure 8-8, displays HTTP request information in a Request table and optionally a Parameters table for existing parameters. In the Request table, key/value pairs are included for the Request URI, HTTP Request Method, Query String parameters, HTTP Protocol, Client IP Address, the Scheme, and the HTTP Exit Status (for example, status code information). Parameter data is represented in the Parameters table.
FIGURE 8-8 Request tab of the HSSM
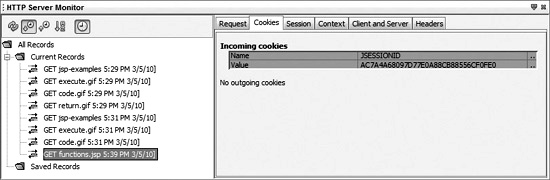
Cookies Tab The Cookies tab of the HSSM Record View panel, as shown in Figure 8-9, displays incoming and outgoing cookie information. If there is no cookie information, the table is not displayed. Instead you see the text “No incoming cookies” and/or “No outgoing cookies.”
FIGURE 8-9 Cookies tab of the HSSM
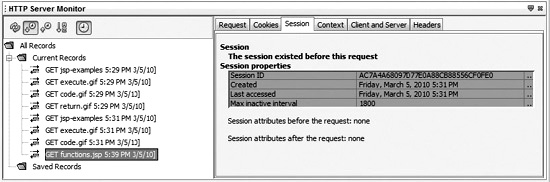
Session Tab The Session tab of the HSSM Record View panel, as shown in Figure 8-10, displays general session information. If the session is new, the following text is displayed: “The session was created as a result of this request.” If the session already existed, the following text is displayed: “The session existed before this request.” Session attributes, if available, are detailed as they existed after the current request. Session attributes, if available, are detailed as they existed before the request if the session was previously established. The Session Properties table includes information about the session ID, when it was created, when it was last accessed, and the setting of the maximum inactivity interval.
FIGURE 8-10 Session tab of the HSSM
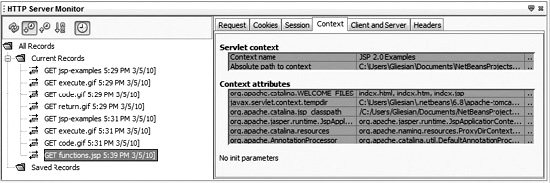
Context Tab The Context tab of the HSSM Record View panel, as shown in Figure 8-11, displays information about Servlet context, context attributes, and initialization parameters. As with the tables in the other tabs, they appear only when there is information to be displayed. Otherwise the table entry is replaced with explanatory text in the figure, as shown in the figure about initialization parameters.
FIGURE 8-11 Context tab of the HSSM
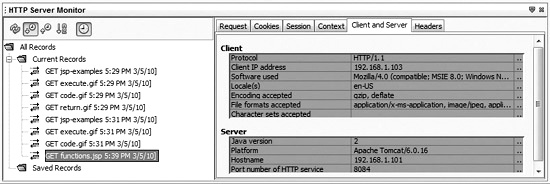
Client And Server Tab The Client And Server tab of the HSSM Record View panel, as shown in Figure 8-12, displays information relative to the client and server machines communicating via the HTTP session. The information is shown in both Client and Server tables. Client information includes data on the HTTP protocol, the client IP address, the software used (for example, browser), locales, encoding attributes, acceptable file formats, and acceptable character sets. Server information includes data about the Java version, platform (for example, server), hostname, and the port number of the HTTP service.
FIGURE 8-12 Client And Server tab of the HSSM
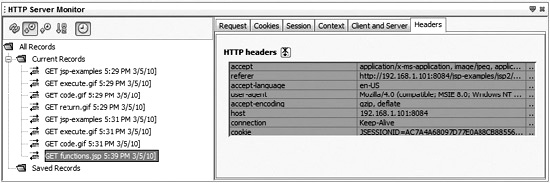
Headers Tab The Headers tab of the HSSM Record View panel, as shown in Figure 8-13, displays information in regard to HTTP request headers. Many of the values are too large to see in their entirety within the table cell. Clicking the ellipses on the right opens a View Value dialog box, where the entire value of a given cell can be viewed. This ellipsis functionality applies to all tables.
FIGURE 8-13 Headers tab of the HSSM

Wireshark is a free network protocol analyzer: www.wireshark.org. If you need to go deeper than what the HTTP Server-Side Monitor provides, consider using Wireshark. Wireshark works for Windows, Unix, and Mac OS X. Consult IT policies prior to downloading this and similar applications, because some companies may flag such tools as a violation of corporate security policies.
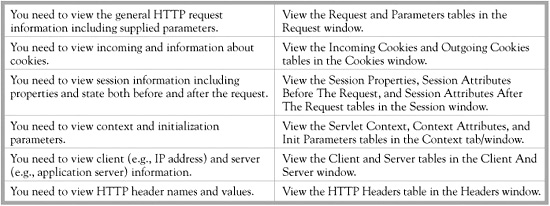
As discussed, viewing and analyzing HTTP session information is one of the most important and often-used features of the HSSM. The Scenario & Solution details the available tables in each window and when you need to see that information.
SCENARIO & SOLUTION
Replaying HSSM Records
To replay an HTTP request, simply right-click a current or saved record and select the Replay menu item. When a replay occurs, a new HTTP request message is sent with the same HTTP request parameters.
All current and saved records can be edited and replayed. Right-click the desired record and select the Edit And Replay.. menu item. The Edit And Replay dialog box opens. In the Edit And Replay dialog box are five tabbed windows: Query, Request, Cookies, Server, and Headers. Let’s take a look at the content and functionality of each of these windows in relationship to the GET-method HSSM record produced from selecting the Numberguess execute command in the JSP Examples main page, as shown in Figure 8-14, and submitting an initial guess of 312.
FIGURE 8-14 JSP Examples sample project Numberguess execute command
In the HSSM Record Management panel, we need to right-click the “GET numguess.jsp” record so the Edit And Replay dialog box will appear. The following subsections detail each tabbed panel in the dialog box. Many tables are displayed with values. The values can be modified by clicking the table cell and making the adjustment, or by clicking the ellipsis and making the changes in the associated Edit And Replay dialog box. The Edit And Replay dialog box comes in handy for lengthy text because the edit box provided in the dialog box is much larger than what the table cell provides. For each tab, selecting Send HTTP Request sends a new HTTP request with all of the data from all of the tables in the Edit And Replay dialog box. The tabbed panels that are available are Query, Request, Cookies, Server, and Headers.
Query Tab The Query tab of the Edit And Replay dialog box, as shown in Figure 8-15, allows for the modification, addition, and removal of query parameters. New rows are added for each new parameter name/value pair, even if the parameter name is the same as an existing one. Query name/value rows can be sorted alphabetically from A to Z or from Z to A, or can be shown in their natural state by use of the sorting button.
FIGURE 8-15 Query tab of Edit And Replay dialog box

Request Tab The Request tab of the Edit And Replay dialog box, as shown in Figure 8-16, allows for the modification of the request URI, HTTP method, and protocol values.
FIGURE 8-16 Request tab of Edit And Replay dialog box
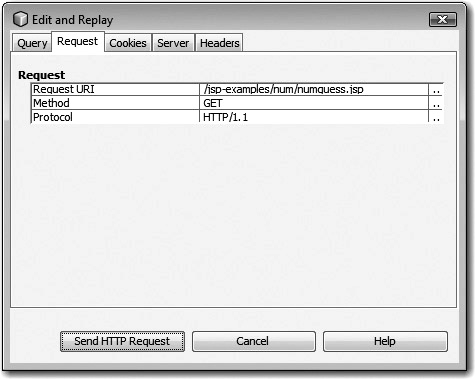
The request URI is the URI/URL where the request is coming from (for example, the web page). The protocol value can be also changed, but caution needs to be taken here because falling back from HTTP/1.1 to HTTP/1.0 does not support all of the HTTPS Request attributes that may be in the HSSM record such as HTTP headers. The HTTP method can be changed by clicking the value cell. A combo box opens with the GET, POST, and PUT methods to select from.
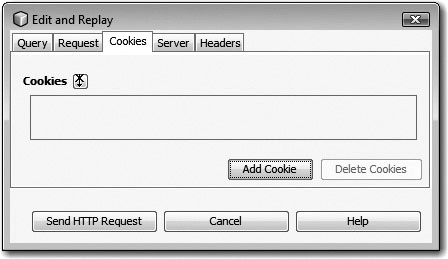
Cookies Tab The Cookies tab of the Edit And Replay dialog box, as shown in Figure 8-17, allows for the addition and removal of cookies by selecting the Add Cookie and Delete Cookies buttons. Cookies can be sorted alphabetically from A to Z or from Z to A, or can be shown in their natural state by use of the sorting button.
FIGURE 8-17 Cookies tab of Edit And Replay dialog box
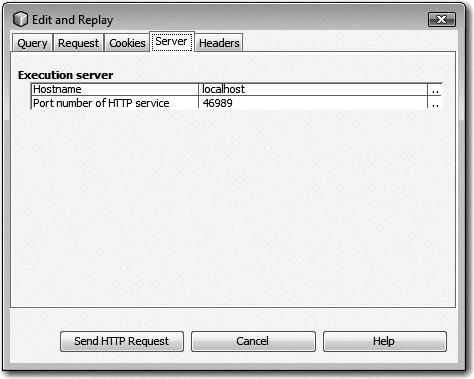
Server Tab The Server tab of the Edit And Replay dialog box, as shown in Figure 8-18, allows for the modification of the server hostname and HTTP service port number.
FIGURE 8-18 Server tab of Edit And Replay dialog box
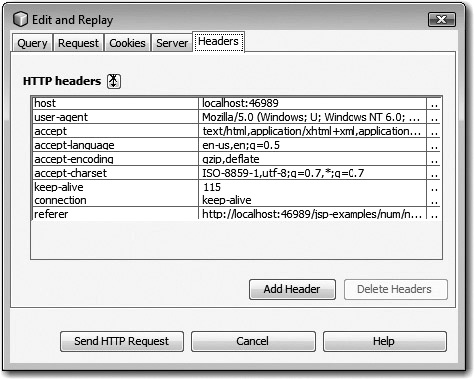
Headers Tab The Headers tab of the Edit And Replay dialog box, as shown in Figure 8-19, allows for the modification and removal of HTTP headers of HTTP request messages. When adding a header that already exists in a row, the header name is shared, but the value is appended to the existing value separated by a comma. Headers can be sorted alphabetically from A to Z or from Z to A, or be shown in their natural state by use of the sorting button.
FIGURE 8-19 Headers tab of Edit And Replay dialog box
CERTIFICATION SUMMARY
This chapter covered the HTTP Server-Side Monitor. The monitor, also referred to in this chapter as HSSM, captures HTTP request/response information and makes it available for analysis and playback.
This chapter started with a review of the HTTP standard. The configuration of HSSM was then covered along with its support in the various web and application servers. We found that the setup was easy because it was automatically done with the Tomcat Web Server and is enabled though a configuration checkbox for GlassFish and the Sun Java System Application Server. Servers started outside of the IDE required additional configuration.
The last section of the chapter covered using the tool for capturing, viewing, and replaying HTTP request messages. Usage of the tool was explained while using the JSP Examples (J2EE 1.4) NetBeans sample project. Features were discussed such as saving, editing, and playing back messages. Upon exercising the HSSM with the sample project, you have gained the knowledge necessary to score well on the monitor-related questions of the exam and to leverage HSSM to troubleshoot everyday issues.
 TWO-MINUTE DRILL
Using the HTTP Server-Side Monitor
![]() The formal name of the monitoring tool has changed in recent versions from “HTTP Monitor” to “HTTP Server-Side Monitor.”
The formal name of the monitoring tool has changed in recent versions from “HTTP Monitor” to “HTTP Server-Side Monitor.”
![]() The shortcut to display the HTTP Server-Side Monitor is CTRL-SHIFT-5.
The shortcut to display the HTTP Server-Side Monitor is CTRL-SHIFT-5.
![]() The HTTP Server-Side Monitor’s main features are Save, Edit, Refresh, Sort, Replay, and Delete HTTP request records.
The HTTP Server-Side Monitor’s main features are Save, Edit, Refresh, Sort, Replay, and Delete HTTP request records.
![]() The HTTP Server-Side Monitor is enabled and displayed automatically when an application is deployed to the Tomcat Web Server.
The HTTP Server-Side Monitor is enabled and displayed automatically when an application is deployed to the Tomcat Web Server.
![]() The HTTP Server-Side Monitor must be enabled for supported application servers (for example, GlassFish and SJSAS) through the server’s configuration settings. This is done via selecting an Enable HTTP Monitor checkbox in the Properties dialog box for the given application server.
The HTTP Server-Side Monitor must be enabled for supported application servers (for example, GlassFish and SJSAS) through the server’s configuration settings. This is done via selecting an Enable HTTP Monitor checkbox in the Properties dialog box for the given application server.
![]() Servers outside of the IDE can enable the HTTP Server-Side Monitor with the inclusion of the following two JARS in the WEB-INF/lib folder: org-netBeans-modules-web-httpmonitor.jar and orgnetbeans-modules-schema2beans.jar and a filter declaration in the WEB-INF/web.xml file.
Servers outside of the IDE can enable the HTTP Server-Side Monitor with the inclusion of the following two JARS in the WEB-INF/lib folder: org-netBeans-modules-web-httpmonitor.jar and orgnetbeans-modules-schema2beans.jar and a filter declaration in the WEB-INF/web.xml file.
![]() The HTTP Server-Side Monitor is divided into right and left panels.
The HTTP Server-Side Monitor is divided into right and left panels.
![]() The left panel of the monitor displays current and saved records. The records can be sorted alphabetically or by timestamp. The records may include status badges on top of their associated icons.
The left panel of the monitor displays current and saved records. The records can be sorted alphabetically or by timestamp. The records may include status badges on top of their associated icons.
![]() The right panel of the monitor displays HTTP request and related information through various tables with multiple tabs/windows. The tabs are Request, Cookies, Session, Context, Client And Server, and Headers.
The right panel of the monitor displays HTTP request and related information through various tables with multiple tabs/windows. The tabs are Request, Cookies, Session, Context, Client And Server, and Headers.
![]() Records can be modified by right-clicking the record and selecting the Edit And Replay command.
Records can be modified by right-clicking the record and selecting the Edit And Replay command.
![]() Selecting the ellipsis button in the tables of the Edit And Replay dialog box opens context-sensitive dialog boxes for the editing of request messages.
Selecting the ellipsis button in the tables of the Edit And Replay dialog box opens context-sensitive dialog boxes for the editing of request messages.
![]() Records can be played back by right-clicking the record and selecting the Replay command.
Records can be played back by right-clicking the record and selecting the Replay command.
SELF TEST
The following questions help you measure your understanding of the material presented in this chapter. Read all the choices carefully because there might be more than one correct answer. Choose all correct answers for each question.
Using the HTTP Server-Side Monitor
1. What was the original name of the HTTP Server-Side Monitor?
A. HTTP Monitor
B. HTTP M&C
C. HTTP Sniffer
D. HTTP Server Monitor
2. What is the shortcut to open the HTTP Server-Side Monitor window?
A. F5
B. CTRL-F5
C. SHIFT-5
D. CTRL-SHIFT-5
3. Within the left side of the HTTP Server-Side Monitor is a panel with Records nodes. Under the root All Records node, what nodes are available?
A. Saved Records
B. Current Records and Saved Records
C. Current Records, Saved Records, and Sample Records
D. Saved Records, Rejected Records, and Sample Records
4. True or False? When a right-click is performed on an element in the Saved Records node, a popup menu is displayed with three menu items, Replay, Edit And Replay, and Delete.
A. True
B. False
5. In each table of the HTTP Server-Side Monitor window associated with HTTP requests, the cells in the last column include an abbreviated ellipsis (..). When clicking this cell, what is displayed relative to the record?
A. The Edit And Replay dialog box is displayed.
B. A Delete Record Confirmation dialog box is displayed.
C. A View Value dialog box is displayed.
D. The help system launches based on the context of the table information.
6. Through the toolbar and the popup menu of the All Records node, the current and saved records in the HTTP Server-Side Monitor can be sorted. Select all sorting algorithms that apply.
A. By timestamp, ascending.
B. By timestamp, descending.
C. Alphabetically, A–Z
D. Alphabetically, Z–A
7. When editing a Headers table within a saved HTTP request record, an Add Header button adds a new header (name/value pair). If you attempt to add a new header when the same header name already exists in the table, how is the new header information handled?
A. The header information is not allowed since the header name already exists in the table.
B. The header information is added to the table as a new record.
C. The header information shares the header name on the same row and adds the value to the Value cell prefaced by a comma.
D. The header information replaces the old header value with the new header value.
8. Along with a filter declaration, what modules need to be included in the WEB-INF/lib directory of remote servers (external to the IDE) to allow interfacing of the HTTP Server-Side Monitor? Select all that apply.
A. org-netbeans-modules-schema2beans.jar
B. org-netbeans-modules-db-mysql-sakila.jar
C. org-netbeans-modules-httpmonitor.jar
D. org-netbeans-modules-j2ee-ejbjarproject.jar
9. What windows/tabs are included in the Edit And Replay dialog box for editing saved records?
A. Query, Request, and Headers tabs
B. Query, Request, Cookies, Server, and Headers tabs
C. Request, Cookies, Session, Context, Client And Server, and Headers tabs
D. Query, Request, Cookies, Session, Context, Client And Server, and Headers tabs
10. In the HTTP Server-Side Monitor record list, each record has an associated icon. Badges may be included on top of these icons relative to the type of HTTP status code returned. Warning badges are associated with what type of status codes?
A. 1xx Information status codes
B. 2xx Success status codes
C. 3xx Redirection status codes
D. 4xx Client Error status codes
E. 5xx Server Error status codes
11. True or false? The HTTP Server-Side Monitor can reference outgoing cookies but not incoming cookies.
A. True
B. False
12. Consider the following illustration from NetBeans 6.7.1. What text goes next to the undefined checkbox in the Servers dialog box when configuring the connection for the GlassFish 2.1 application server?

A. Disable HTTP Monitor
B. Enable HTTP Monitor
C. Disable HTTP Monitor Filtering
D. Enable HTTP Monitor Filtering
SELF TEST ANSWERS
Using the HTTP Server-Side Monitor
1. What was the original name of the HTTP Server-Side Monitor?
A. HTTP Monitor
B. HTTP M&C
C. HTTP Sniffer
D. HTTP Server Monitor
![]() A. The original name of the HTTP Server-Side Monitor was HTTP Monitor.
A. The original name of the HTTP Server-Side Monitor was HTTP Monitor.
![]() B, C, and D are incorrect. B is incorrect because the monitor was never called the HTTP M&C. C is incorrect because the monitor was never called the HTTP Sniffer. D is incorrect because the monitor was not originally called the HTTP Server Monitor, but you may see it referenced as such as a semi-abbreviation of the HTTP Server-Side Monitor.
B, C, and D are incorrect. B is incorrect because the monitor was never called the HTTP M&C. C is incorrect because the monitor was never called the HTTP Sniffer. D is incorrect because the monitor was not originally called the HTTP Server Monitor, but you may see it referenced as such as a semi-abbreviation of the HTTP Server-Side Monitor.
2. What is the shortcut to open the HTTP Server-Side Monitor window?
A. F5
B. CTRL-F5
C. SHIFT-5
D. CTRL-SHIFT-5
![]() D. The shortcut used to open the HTTP Server-Side Monitor window is CTRL-SHIFT-5.
D. The shortcut used to open the HTTP Server-Side Monitor window is CTRL-SHIFT-5.
![]() A, B, and C are incorrect. A is incorrect because F5 is used to continue the debugger and not to open the HTTP Server-Side Monitor. B is incorrect because CTRL-F5 is used to start debugging the main project and not to open the HTTP Server-Side Monitor. C is incorrect because SHIFT-5 is used to finish the debugger session.
A, B, and C are incorrect. A is incorrect because F5 is used to continue the debugger and not to open the HTTP Server-Side Monitor. B is incorrect because CTRL-F5 is used to start debugging the main project and not to open the HTTP Server-Side Monitor. C is incorrect because SHIFT-5 is used to finish the debugger session.
3. Within the left side of the HTTP Server-Side Monitor is a panel with Records nodes. Under the root All Records node, what nodes are available?
A. Saved Records
B. Current Records and Saved Records
C. Current Records, Saved Records, and Sample Records
D. Saved Records, Rejected Records, and Sample Records
![]() B. Under the All Records node within the left panel of the HTTP Server-Side Monitor are nodes for Current Records and Saved Records.
B. Under the All Records node within the left panel of the HTTP Server-Side Monitor are nodes for Current Records and Saved Records.
![]() A, C, and D are incorrect. A is incorrect because Saved Records is not the only node available under the All Records node. C is incorrect because there is no Sample Records node. D is incorrect because there are no Rejected Records or Sample Records nodes.
A, C, and D are incorrect. A is incorrect because Saved Records is not the only node available under the All Records node. C is incorrect because there is no Sample Records node. D is incorrect because there are no Rejected Records or Sample Records nodes.
4. True or False? When a right-click is performed on an element in the Saved Records node, a popup menu is displayed with three menu items, Replay, Edit And Replay, and Delete.
A. True
B. False
![]() True. When an element in the Saved Records node is right-clicked, a popup menu displays with three menu items: Replay, Edit And Replay, and Delete.
True. When an element in the Saved Records node is right-clicked, a popup menu displays with three menu items: Replay, Edit And Replay, and Delete.
5. In each table of the HTTP Server-Side Monitor window associated with HTTP requests, the cells in the last column include an abbreviated ellipsis (..). When clicking this cell, what is displayed relative to the record?
A. The Edit And Replay dialog box is displayed.
B. A Delete Record Confirmation dialog box is displayed.
C. A View Value dialog box is displayed.
D. The help system launches based on the context of the table information.
![]() C. A View Value dialog box displays. This option is available to show the full value of the second column because it often has more data than can be displayed in the current table orientation.
C. A View Value dialog box displays. This option is available to show the full value of the second column because it often has more data than can be displayed in the current table orientation.
![]() A, B, and D are incorrect. A is incorrect because clicking the abbreviated ellipsis does not display the Edit And Replay dialog box. B is incorrect because clicking the abbreviated ellipsis does not display a Delete Record Confirmation dialog box. D is incorrect because clicking the abbreviated ellipsis does not launch the help system.
A, B, and D are incorrect. A is incorrect because clicking the abbreviated ellipsis does not display the Edit And Replay dialog box. B is incorrect because clicking the abbreviated ellipsis does not display a Delete Record Confirmation dialog box. D is incorrect because clicking the abbreviated ellipsis does not launch the help system.
6. Through the toolbar and the popup menu of the All Records node, the current and saved records in the HTTP Server-Side Monitor can be sorted. Select all sorting algorithms that apply.
A. By timestamp, ascending.
B. By timestamp, descending.
C. Alphabetically, A–Z
D. Alphabetically, Z–A
![]() A, B, and C are correct. Current and saved records can be sorted by timestamp (ascending and descending) and alphabetically (only A–Z).
A, B, and C are correct. Current and saved records can be sorted by timestamp (ascending and descending) and alphabetically (only A–Z).
![]() D is incorrect because the current and saved records cannot be sorted alphabetically (Z–A).
D is incorrect because the current and saved records cannot be sorted alphabetically (Z–A).
7. When editing a Headers table within a saved HTTP request record, an Add Header button adds a new header (name/value pair). If you attempt to add a new header when the same header name already exists in the table, how is the new header information handled?
A. The header information is not allowed since the header name already exists in the table.
B. The header information is added to the table as a new record.
C. The header information shares the header name on the same row and adds the value to the Value cell prefaced by a comma.
D. The header information replaces the old header value with the new header value.
![]() C. The new header shares the name of the existing header in the table and adds the value to the Value cell prefaced by a comma.
C. The new header shares the name of the existing header in the table and adds the value to the Value cell prefaced by a comma.
![]() A, B, and D are incorrect. A is incorrect because new header information is allowed. B is incorrect because new header information with the same header name of as existing header name is not be added to a new row. D is incorrect because new header information does not replace existing header information.
A, B, and D are incorrect. A is incorrect because new header information is allowed. B is incorrect because new header information with the same header name of as existing header name is not be added to a new row. D is incorrect because new header information does not replace existing header information.
8. Along with a filter declaration, what modules need to be included in the WEB-INF/lib directory of remote servers (external to the IDE) to allow interfacing of the HTTP Server-Side Monitor? Select all that apply.
A. org-netbeans-modules-schema2beans.jar
B. org-netbeans-modules-db-mysql-sakila.jar
C. org-netbeans-modules-httpmonitor.jar
D. org-netbeans-modules-j2ee-ejbjarproject.jar
![]() A and C. The HTTP Monitor can interface with application servers outside of the IDE when the JAR files org-netbeans-modules-schema2beans.jar and org-netbeans-modules-httpmonitor.jar are included in the servers’ WEB-INF/lib directory.
A and C. The HTTP Monitor can interface with application servers outside of the IDE when the JAR files org-netbeans-modules-schema2beans.jar and org-netbeans-modules-httpmonitor.jar are included in the servers’ WEB-INF/lib directory.
![]() B and D are incorrect. B is incorrect because the Sakila database support module is not needed for HTTP Monitor integration. D is incorrect because the EJB support module is not needed for HTTP Monitor integration.
B and D are incorrect. B is incorrect because the Sakila database support module is not needed for HTTP Monitor integration. D is incorrect because the EJB support module is not needed for HTTP Monitor integration.
9. What windows/tabs are included in the Edit And Replay dialog box for editing saved records?
A. Query, Request, and Headers tabs
B. Query, Request, Cookies, Server, and Headers tabs
C. Request, Cookies, Session, Context, Client And Server, and Headers tabs
D. Query, Request, Cookies, Session, Context, Client And Server, and Headers tabs
![]() B. The window/tabs included in the Edit And Replay dialog box are Query, Request, Cookies, Server, and Headers.
B. The window/tabs included in the Edit And Replay dialog box are Query, Request, Cookies, Server, and Headers.
![]() A, C, and D are incorrect. A is incorrect because all of the windows/tabs are not listed for the Edit And Replay dialog box. C is incorrect because the Edit And Replay dialog box does not have Session and Client And Server tabs. D is incorrect because the Edit And Replay dialog box does not have Session, Context, and Client And Server tabs.
A, C, and D are incorrect. A is incorrect because all of the windows/tabs are not listed for the Edit And Replay dialog box. C is incorrect because the Edit And Replay dialog box does not have Session and Client And Server tabs. D is incorrect because the Edit And Replay dialog box does not have Session, Context, and Client And Server tabs.
10. In the HTTP Server-Side Monitor record list, each record has an associated icon. Badges may be included on top of these icons relative to the type of HTTP status code returned. Warning badges are associated with what type of status codes?
A. 1xx Information status codes
B. 2xx Success status codes
C. 3xx Redirection status codes
D. 4xx Client Error status codes
E. 5xx Server Error status codes
![]() C. In the HTTP Server-Side Monitor record list, warning badges are included relative to 3xx Redirection HTTP status codes being returned.
C. In the HTTP Server-Side Monitor record list, warning badges are included relative to 3xx Redirection HTTP status codes being returned.
![]() A, B, D, and E are incorrect. A is incorrect because warning icons are not associated in the record list with 1xx Information status codes. B is incorrect because warning icons are not associated in the record list with 2xx Success status codes. D is incorrect because warning icons are not associated in the record list with 4xx Client Error status codes. E is incorrect because warning icons are not associated in the record list with 5xx Server Error status codes.
A, B, D, and E are incorrect. A is incorrect because warning icons are not associated in the record list with 1xx Information status codes. B is incorrect because warning icons are not associated in the record list with 2xx Success status codes. D is incorrect because warning icons are not associated in the record list with 4xx Client Error status codes. E is incorrect because warning icons are not associated in the record list with 5xx Server Error status codes.
11. True or false? The HTTP Server-Side Monitor can reference outgoing cookies but not incoming cookies.
A. True
B. False
![]() B. The statement is false. The HTTP Server-Side Monitor can reference both incoming and outgoing cookies.
B. The statement is false. The HTTP Server-Side Monitor can reference both incoming and outgoing cookies.
12. Consider the following illustration from NetBeans 6.7.1. What text goes next to the undefined checkbox in the Servers dialog box when configuring the connection for the GlassFish 2.1 application server?
A. Disable HTTP Monitor
B. Enable HTTP Monitor
C. Disable HTTP Monitor Filtering
D. Enable HTTP Monitor Filtering

![]() B. The missing text is “Enable HTTP Monitor.”
B. The missing text is “Enable HTTP Monitor.”
![]() A, C, and D are incorrect. A is incorrect because “Disable HTTP Monitor” is not the text displayed. C is incorrect because “Disable HTTP Monitor Filtering” is not the text displayed. D is incorrect because “Enable HTTP Monitor Filtering” is not the text displayed
A, C, and D are incorrect. A is incorrect because “Disable HTTP Monitor” is not the text displayed. C is incorrect because “Disable HTTP Monitor Filtering” is not the text displayed. D is incorrect because “Enable HTTP Monitor Filtering” is not the text displayed