
9
Local and Remote Debuggers
CERTIFICATION OBJECTIVES
• Debugging Local Applications
• Debugging Remote Applications
Q&A Self Test
NetBeans debugging support has been strong since its inception, and just about every subsequent build has improved upon it. It’s actually difficult to conceptualize, let alone itemize, all of the things that the NetBeans debugger does. Fortunately for the exam, you need to master only the most commonly used debugging features. These features include starting the debugger, setting breakpoints, stepping through code, and using various debugging windows to view and interface with the debugger. We cover these areas against the first objective related to local applications and the debugger. Later in the chapter we discuss the fundamental differences between local and remote debugging and also explain how to debug web applications. After you have completed this chapter, you will have enough knowledge to score well on the debugging-related questions on the exam. You may also find yourself using the debugger more frequently on the job, in place of redirecting analysis data to standard out or log files.
CERTIFICATION OBJECTIVE: Debugging Local Applications
Exam Objective 6.2 Describe how to debug a local (desktop) application, including setting breakpoints and stepping through code.
Debugging local applications is a common activity. If you are debugging your Java applications solely by redirecting messages to standard out, you are missing the benefits of using a true debugger, as described throughout the chapter. With the NetBeans IDE debugger, you can set breakpoints, start the debugger, and view the state of various variables faster than you can pepper your source code with print statements such as System.out.println("Debug 1"), System.out.println("Debug 2"), and so on. If you are a seasoned developer and have been using the NetBeans IDE debugging features, then this section helps solidify your knowledge for the exam. In the upcoming sections, we cover setting up a session, setting breakpoints, stepping through code, and using the various debugging windows.
![]() Session Establishment
Session Establishment
![]() Breakpoint Settings
Breakpoint Settings
![]() Code Stepping
Code Stepping
![]() Debugging Support Windows
Debugging Support Windows
Session Establishment
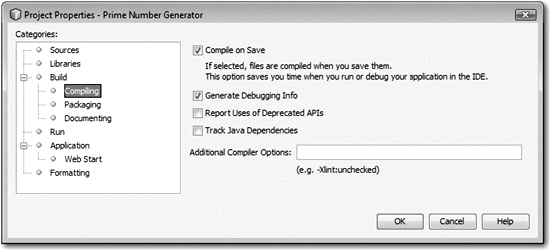
Prior to starting a session, the Generate Debugging Info property must be enabled. NetBeans 6.8 documentation specifically states, “If selected, the compiled classes include information necessary for stopping at breakpoints and stepping through the application with the debugger.” This setting is selected by default when installing the IDE. So if you’ve been using the debugger, you may not even know the setting exists. You can find the Generate Debugging Info checkbox in the Project Properties dialog box under the Build | Compiling nodes, as shown in Figure 9-1. This dialog box can be opened by right-clicking your project in either the Projects or Files window. If the button is deselected and you try to use the debugger, you should see an error in the Debugger Console of the Output window.
FIGURE 9-1 Generate Debugging Info checkbox
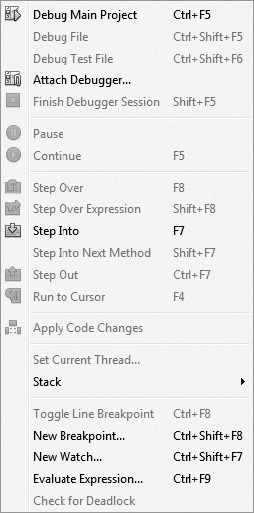
Starting a debugging session is easy, and you can do it in several ways. The most common way is by clicking the Debug Main Project icon in the Run (View | Toolbars | Run) toolbar. This action, or simply pressing CTRL-F5, executes the program until it reaches a breakpoint, exception, or terminates normally. Another way to start a session is by pressing F7, which maps to the Step Into command. You can also find the Step Into command on the Debug menu in the main menu bar: Debug | Step Into. For reference, Figure 9-2 shows the full Debug menu. Run To Cursor is enabled if the cursor has selected an insertion point in one of the project files. All of these items including stepping are detailed in the upcoming sections. When a session is established, information and controls are available in nine related debugging windows: Variables, Watches, Call Stack, Loaded Classes, Breakpoints, Sessions, Threads, Sources, and Debugging. Coverage for these windows is done later in the chapter.
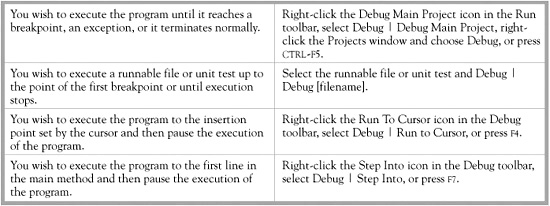
We have discussed several ways of starting up a debugging session. The Scenario & Solution further explores each way and adds a couple more.
SCENARIO & SOLUTION
![]()
NetBeans 6.5 and later versions have debugging menu items under the Debug menu. NetBeans 6.1 and earlier versions have debugging menu items under the Run menu.
Breakpoint Settings
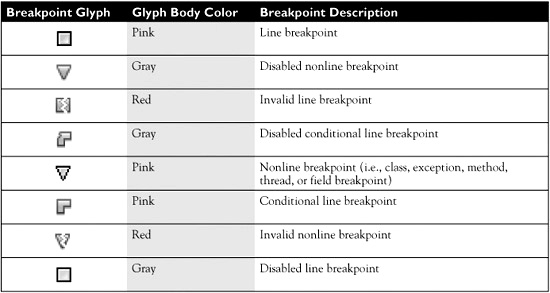
Breakpoints are marked places in code where execution pauses when the debugger reaches that point. Breakpoint glyphs reside in the left margin to annotate the type and location of the breakpoint. Primary breakpoint markers are shown in Table 9-1. Breakpoint marker settings are persistent and need to be cleared for permanent removal.
Breakpoints are commonly set and configured through the New Breakpoint dialog box (Debug | New Breakpoint or CTRL-SHIFT-F8). However, they can be set through a variety of means. Let’s take a look at setting line breakpoints, for example. You can click in the left margin of the source editor to set a line breakpoint. You can select CTRL-F8 to set a line breakpoint. You can also select Debug | Toggle Line Breakpoint from the main menu to set a line breakpoint.
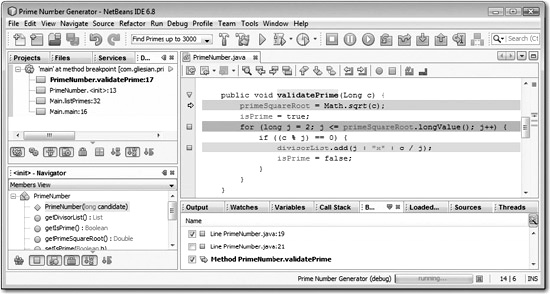
Line breakpoints have the background of the source line colored the same as the body of the breakpoint glyphs. Nonline breakpoints do not color the background of the source lines. When a breakpoint is reached, a program counter (right-arrow badge) shows on top of the breakpoint glyph. This associated source line has a green background. Figure 9-3 shows the program marker, one enabled line breakpoint, one disabled line breakpoint, and one method breakpoint.
FIGURE 9-3 Breakpoint glyphs in the left margin
For each breakpoint that is reached, related information is printed in the Debugger Console of the Output window.
Six types of breakpoints can be set: line, class, exception, method, thread, and field. We examine each type in the following sections.
Line Breakpoints
Line breakpoints are available to pause a program on a specified line. A line breakpoint is established through the New Breakpoint dialog box (CTRL-SHIFT-F8) with the Breakpoint Type being Line. Line breakpoints can also be configured by right-clicking the breakpoint glyph in the left margin and selecting Breakpoint | Properties. The Breakpoint Properties dialog box will be displayed, as shown in Figure 9-4. There are three group boxes in the dialog box that allow for additional settings.
FIGURE 9-4 Breakpoint Properties dialog box for a line
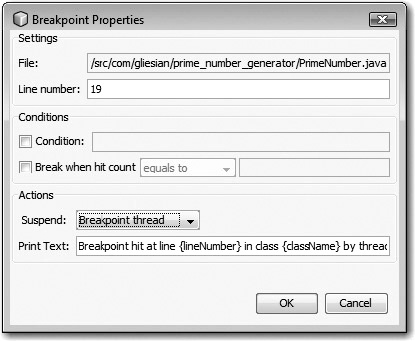
![]() Settings group box File and line number attributes are defined in this group box.
Settings group box File and line number attributes are defined in this group box.
![]() Conditions group box Breakpoints can be tied to Boolean conditions and/or break counts in this group box. Break count options include Equals To, Is Greater Than, and Is Multiple Of for a user-selectable value.
Conditions group box Breakpoints can be tied to Boolean conditions and/or break counts in this group box. Break count options include Equals To, Is Greater Than, and Is Multiple Of for a user-selectable value.
![]() Actions group box The Suspend combo box provides three settings for the suspension of threads: No Thread (Continue), Breakpoint Thread, and All Threads. Whenever the breakpoint is hit for any of the selected conditions, the text in the Print Text edit box is directed to the Debugging Console window.
Actions group box The Suspend combo box provides three settings for the suspension of threads: No Thread (Continue), Breakpoint Thread, and All Threads. Whenever the breakpoint is hit for any of the selected conditions, the text in the Print Text edit box is directed to the Debugging Console window.
Class Breakpoints
Class breakpoints are available to pause program execution when a class is loaded and/or unloaded from the JVM. A class breakpoint is established through the New Breakpoint dialog box with the Breakpoint Type being Class, as shown in Figure 9-5. The three group boxes in the dialog box allow for additional settings:
FIGURE 9-5 New Breakpoint dialog box for a class
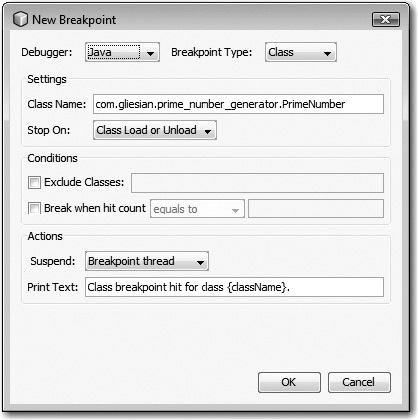
![]() Settings group box The Class Name edit box designates the class or classes (for example, java.util.*) that will have the breakpoint upon being loaded to or unloaded from the JVM. The Stop On combo box sets whether the breakpoint specifically occurs when the class is loaded (Class Load), unloaded (Class Unload), or both (Class Load Or Unload).
Settings group box The Class Name edit box designates the class or classes (for example, java.util.*) that will have the breakpoint upon being loaded to or unloaded from the JVM. The Stop On combo box sets whether the breakpoint specifically occurs when the class is loaded (Class Load), unloaded (Class Unload), or both (Class Load Or Unload).
![]() Conditions group box The Exclude Classes checkbox and edit box components allow for exclusion of classes when an entire package is used with a wildcard in the Settings Class Name edit box. “The Break When Hit Count” checkbox components allow for the triggering of the breakpoint when the hit count of loaded and/or unloaded instances is Equals To, Is Greater Than, or Is Multiple Of what is defined in the corresponding edit box.
Conditions group box The Exclude Classes checkbox and edit box components allow for exclusion of classes when an entire package is used with a wildcard in the Settings Class Name edit box. “The Break When Hit Count” checkbox components allow for the triggering of the breakpoint when the hit count of loaded and/or unloaded instances is Equals To, Is Greater Than, or Is Multiple Of what is defined in the corresponding edit box.
![]() Actions group box The Suspend combo box provides three settings for the suspension of threads: No Thread (Continue), Breakpoint Thread, and All Threads. Whenever the breakpoint is hit for any of the selected conditions, the text in the Print Text edit box is directed to the Debugger Console window.
Actions group box The Suspend combo box provides three settings for the suspension of threads: No Thread (Continue), Breakpoint Thread, and All Threads. Whenever the breakpoint is hit for any of the selected conditions, the text in the Print Text edit box is directed to the Debugger Console window.
Exception Breakpoints
Exception breakpoints are available to pause execution whenever a specified exception is caught, is not handled in the source code, or is encountered (handled or not). An exception breakpoint is established through the New Breakpoint dialog box with the Breakpoint Type being Exception, as shown in Figure 9-6. The three group boxes in the dialog box allow for additional settings:
FIGURE 9-6 New Breakpoint dialog box for an exception
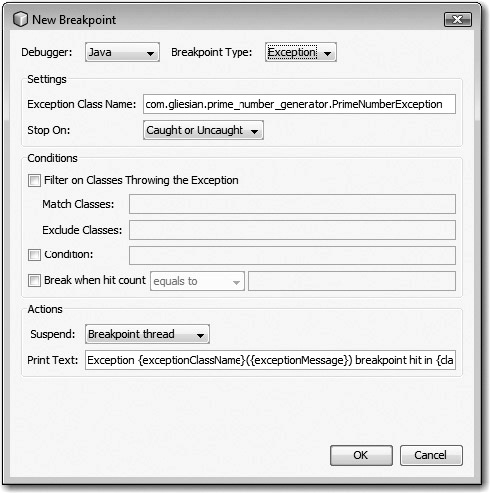
![]() Settings group box The Exception Class Name edit box designates the exception(s) that will have the breakpoint upon being caught or uncaught. The Stop On combo box sets whether the breakpoint specifically occurs when the exception is Caught, Uncaught, or Caught Or Uncaught.
Settings group box The Exception Class Name edit box designates the exception(s) that will have the breakpoint upon being caught or uncaught. The Stop On combo box sets whether the breakpoint specifically occurs when the exception is Caught, Uncaught, or Caught Or Uncaught.
![]() Conditions group box You can apply filters on classes throwing the exception. Breakpoints can be tied to Boolean conditions and/or to break counts in this group box. Break count options include Equals To, Is Greater Than, and Is Multiple Of for a user-selectable value.
Conditions group box You can apply filters on classes throwing the exception. Breakpoints can be tied to Boolean conditions and/or to break counts in this group box. Break count options include Equals To, Is Greater Than, and Is Multiple Of for a user-selectable value.
![]() Actions group box The Actions combo box provides three settings for the suspension of threads: No Thread (Continue), Breakpoint Thread, and All Threads. Whenever the breakpoint is hit for any of the selected conditions, the text in the Print Text edit box is directed to the Debugger Console window.
Actions group box The Actions combo box provides three settings for the suspension of threads: No Thread (Continue), Breakpoint Thread, and All Threads. Whenever the breakpoint is hit for any of the selected conditions, the text in the Print Text edit box is directed to the Debugger Console window.
Method Breakpoints
Method breakpoints are available to pause methods and constructors before they are entered, exited, or both. A method breakpoint is established through the New Breakpoint dialog box with the Breakpoint Type being Method, as shown in Figure 9-7. The three group boxes in the dialog box allow for additional settings:
FIGURE 9-7 New Breakpoint dialog box for a method
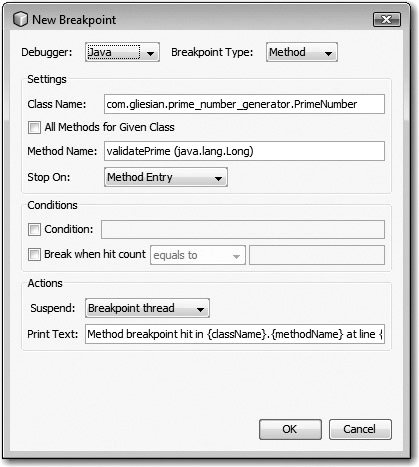
![]() Settings group box Settings can be established to stop on all methods of an individual class or a specific method. The Stop On combo box options include Method Entry, Method Exit, and Method Entry Or Exit.
Settings group box Settings can be established to stop on all methods of an individual class or a specific method. The Stop On combo box options include Method Entry, Method Exit, and Method Entry Or Exit.
![]() Conditions group box Breakpoints can be tied to Boolean conditions and/or break counts in this group box. Break count options include Equals To, Is Greater Than, and Is Multiple Of for a user-selectable value.
Conditions group box Breakpoints can be tied to Boolean conditions and/or break counts in this group box. Break count options include Equals To, Is Greater Than, and Is Multiple Of for a user-selectable value.
![]() Actions group box The Actions combo box provides three settings for the suspension of threads: No Thread (Continue), Breakpoint Thread, and All Threads. Whenever the breakpoint is hit for any of the selected conditions, the text in the Print Text edit box is directed to the Debugger Console window.
Actions group box The Actions combo box provides three settings for the suspension of threads: No Thread (Continue), Breakpoint Thread, and All Threads. Whenever the breakpoint is hit for any of the selected conditions, the text in the Print Text edit box is directed to the Debugger Console window.
Thread Breakpoints
Thread breakpoints are available to pause execution whenever a thread starts, stops, or both. A thread breakpoint is established through the New Breakpoint dialog box with the Breakpoint Type being Thread, as shown in Figure 9-8. The three group boxes in the dialog box allow for additional settings:
FIGURE 9-8 New Breakpoint dialog box for a thread
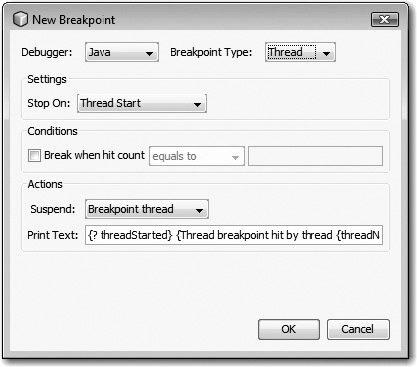
![]() Settings group box The Stop On combo box settings include Thread Start, Thread Death, or Thread Start Or Death.
Settings group box The Stop On combo box settings include Thread Start, Thread Death, or Thread Start Or Death.
![]() Conditions group box Breakpoints can be tied to break counts in this group box. Break count options include Equals To, Is Greater Than, and Is Multiple Of for a user-selectable value.
Conditions group box Breakpoints can be tied to break counts in this group box. Break count options include Equals To, Is Greater Than, and Is Multiple Of for a user-selectable value.
![]() Actions group box The Actions combo box provides three settings for the suspension of threads: No Thread (Continue), Breakpoint Thread, and All Threads. Whenever the breakpoint is hit for any of the selected conditions, the text in the Print Text edit box is directed to the Debugger Console window.
Actions group box The Actions combo box provides three settings for the suspension of threads: No Thread (Continue), Breakpoint Thread, and All Threads. Whenever the breakpoint is hit for any of the selected conditions, the text in the Print Text edit box is directed to the Debugger Console window.
Field Breakpoints
Field breakpoints are available to pause execution on a field in a specified class. A field breakpoint is established through the New Breakpoint dialog box with the Breakpoint Type being Field, as shown in Figure 9-9. The three group boxes in the dialog box allow for additional settings:
FIGURE 9-9 New Breakpoint dialog box for a field
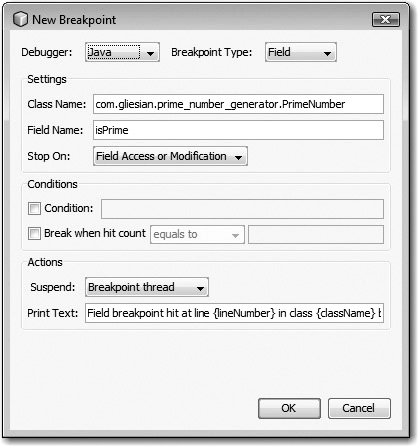
![]() Settings group box The Class Name, Field Name, and Stop On settings may be established in the group box. The Stop On combo box options include Field Access, Field Modification, and Field Access Or Modification.
Settings group box The Class Name, Field Name, and Stop On settings may be established in the group box. The Stop On combo box options include Field Access, Field Modification, and Field Access Or Modification.
![]() Conditions group box Breakpoints can be tied to Boolean conditions and/or break counts in this group box. Break count options include Equals To, Is Greater Than, and Is Multiple Of for a user-selectable value.
Conditions group box Breakpoints can be tied to Boolean conditions and/or break counts in this group box. Break count options include Equals To, Is Greater Than, and Is Multiple Of for a user-selectable value.
![]() Actions group box The Actions combo box provides three settings for the suspension of threads: No Thread (Continue), Breakpoint Thread, and All Threads. Whenever the breakpoint is hit for any of the selected conditions, the text in the Print Text edit box is directed to the Debugger Console window.
Actions group box The Actions combo box provides three settings for the suspension of threads: No Thread (Continue), Breakpoint Thread, and All Threads. Whenever the breakpoint is hit for any of the selected conditions, the text in the Print Text edit box is directed to the Debugger Console window.
EXERCISE 9-1 Applying Conditions to Breakpoints
This exercise applies Boolean conditions to breakpoints. That is, if an expression evaluates to true, the condition is hit; otherwise, program execution continues pass the breakpoint. This example uses line breakpoints.
1. Create a simple HelloBreakPoints application with the following source code:
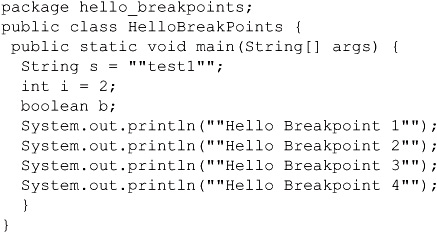
2. Apply a conditional breakpoint with the following expression to the first print statement:
s instanceof String
3. Apply a conditional breakpoint with the following expression to the second print statement:
i == 2
4. Apply a conditional breakpoint with the following expression to the third print statement (note that this step intentionally uses one equals sign; it is not a typo):
b = true
5. Apply a conditional breakpoint with the following expression to the fourth print statement:
true
6. Run the application in debug mode and step through each line. Note that the program pauses on each breakpoint as each evaluates to true.
7. Bonus: Steps 2 through 6 have expressions that evaluate to true. Explain why they evaluate to true.
Configuration of various Java debugger settings was added to the Tools | Options window in NetBeans 6.7. The tab is located relative to the Miscellaneous icon. Consult Chapter 1 for additional coverage.
Code Stepping
Stepping through code is fundamentally the most important feature of the debugger. Being able to control where you want to look in your source code at runtime and displaying related data in context to that position is very useful when determining what the code is doing. Code-stepping features allow you to step one line at a time, or in and out of various structural elements. For a quick look at the commands, Table 9-2 details their names and shortcut keys. The following sections detail the functional capabilities of each stepping-related command. The illustrations correspond to the glyphs in the Debug menu off of the main menu and on the Debug toolbar (View | Toolbars | Debug).
TABLE 9-2 Code-Stepping Commands
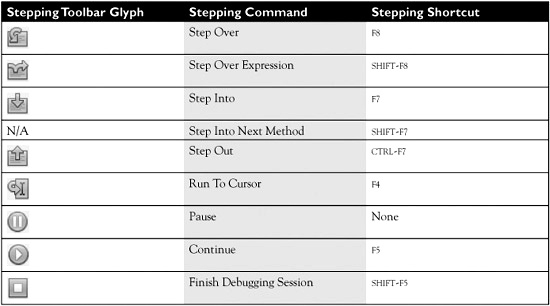
Step Over
The Step Over command executes the current line. If the current line contains a method or constructor, the entire call is executed without stepping into any of the individual lines. The debugger then moves to the next line. The command is invoked by choosing Debug | Step Over or by pressing F8.
Step Over Expression
The Step Over Expression command executes one method call in an expression. If multiple method calls exist on the line, including chaining, the command steps through the expression and views each value of each method in the Local Variables window. When there are no more method occurrences to be traversed, the debugger moves to the next line. The command is invoked by choosing Debug | Step Over Expression or by pressing SHIFT-F8.
Step Into
The Step Into command executes the current line. If the current line has a method or constructor call, the debugger pauses before executing the first line within the call. If there are multiple methods, the most likely method call is highlighted by default with a boxed line. The command is invoked by choosing Debug | Step Into or by pressing F7. You can start a debugging session with the Step Into command.
Step Into Next Method
The Step Into Next Method command executes one method or constructor call in a line. If multiple method calls are on the line, you can select the desired call with the cursor. The most likely method call is highlighted by default with a boxed line. The command is invoked by choosing Debug | Step Into Next Method or by pressing SHIFT-F8.
Step Out
The Step Out command steps out of the current method by executing all remaining source code lines and entering back into the calling method. If the source line is not part of a method, only one source line is executed. The command is invoked by choosing Debug | Step Out or by pressing CTRL-F7.
Run To Cursor
The Run To Cursor command allows the program execution to continue up to the insertion point placed by the cursor. At the insertion point, the program execution pauses. The command is invoked by choosing Debug | Run To Cursor or by pressing F4. You can start a debugging session with the Run To Cursor command.
Pause
The Pause command suspends all of the threads in the current debugger session. The command is invoked by choosing Debug | Pause. There is no shortcut key for the Pause command.
Continue
The Continue command allows program execution to continue to the next breakpoint, or until the execution is suspended or terminated. The command is invoked by choosing Debug | Continue or by pressing F5.
Debugging Support Windows
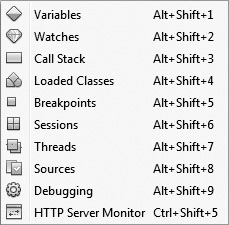
Nine debugging support windows exist: Variables, Watches, Call Stack, Loaded Classes, Breakpoints, Sessions, Threads, Sources, and Debugging. The first eight are displayed in the bottom right of the IDE. The last (the Debugging window) is displayed in the upper-left pane. All windows provide information and controls against debugging sessions. Each window is detailed in this section. You will not need to know the fine details of each window for the exam, so they are covered only at a high level in this section. Shortcuts for windows are shown in the Windows | Debugging menu, shown in Figure 9-10. Additional menu items may be included on your Debugging submenu, depending on your version of NetBeans and installed NetBeans bundle.
Variables Window
The Variables window, as shown in Figure 9-11, lists the variables in the current call. Right-clicking the empty portion of the Variables window displays a popup menu with the following choices: New Watch, Delete, Delete All, and Edit. Depending on the type of item selected in the list and the table column, the following menu items may be shown in a right-click popup: Display As (Decimal, Hexadecimal, Octal, Binary, Character, Time), Created Fixed Watch, Show Only Rows Where, and/or Go To Source). The Variables window (ALT-SHIFT-1) opens in the bottom right of the IDE.
FIGURE 9-11 Variables debugging window
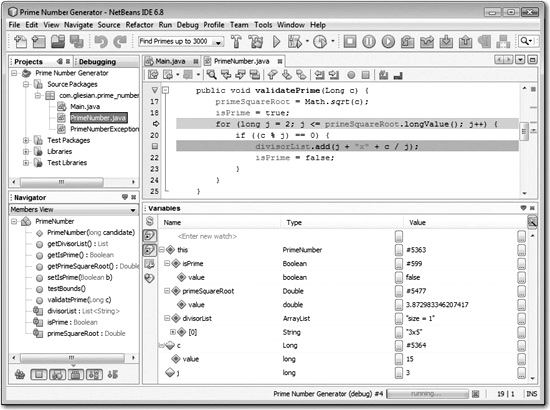

As of NetBeans 6.5, you can evaluate expressions in the Evaluate code window while in a debugging session. The results of your expression against current context elements are shown in the Variables window. The window can be opened by selecting Debug | Evaluate Expression or by pressing CTRL-F9.
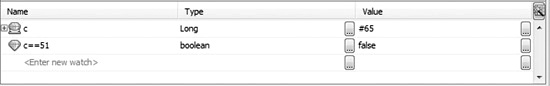
Watches Window
The Watches window, as shown in Figure 9-12, lists specified variables and expressions to watch while in a debugging session. Right-clicking the empty portion of the Watches window displays a popup menu with the following choices: New Watch and Delete All. Right-clicking a watch item displays a popup menu that may have the following among other items: Delete Fixed Watch, Show References, and Mark Object. The Watches window (ALT-SHIFT-2) opens in the bottom right of the IDE. A fixed watch is an object that is currently assigned to a variable. A normal watch describes the contents of the variable.
FIGURE 9-12 Watches debugging window
Call Stack Window
The Call Stack window, as shown in Figure 9-13, lists the sequence of calls made during the execution of the current thread while highlighting the current call.
Right-clicking the empty portion of the Call Stack window displays a popup menu with the following choice: Copy Stack. Right-clicking a call displays a popup menu with the following choices: Make Current, Pop To Here, Go To Source, and Copy Stack. The Call Stack window (ALT-SHIFT-3) opens in the bottom right of the IDE.
Loaded Classes Window
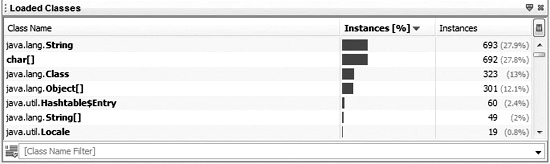
The Loaded Classes window, as shown in Figure 9-14, lists the loaded classes for the current debugging session. Right-clicking a loaded class displays a popup menu with the following choices: Show In Instances View, Show Only Subclasses, and Go To Source. The Sources window (ALT-SHIFT-4) opens in the bottom right of the IDE.
FIGURE 9-14 Loaded Classes window
Breakpoints Window
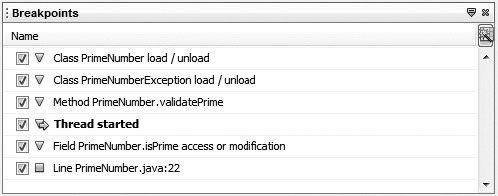
The Breakpoints window, as shown in Figure 9-15, lists all of the project breakpoints. Right-clicking the empty portion of the Breakpoints window displays a popup menu with the following choices: New Breakpoint, Enable All, Disable All, and Delete All. Right-clicking a breakpoint in the list displays a popup menu with the following choices: Go To Source, Disable/Enable, Move Into Group, New Breakpoint, Enable All, Disable All, Delete, Delete All, and Properties. The Breakpoints window (ALT-SHIFT-5) opens in the bottom right of the IDE.
FIGURE 9-15 Breakpoints window
Sessions Window
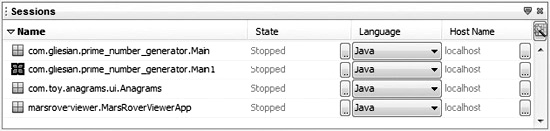
The Sessions window, as shown in Figure 9-16, lists all running debugging sessions. Session states may be Starting, Running, or Stopped. Right-clicking the empty portion of the Sessions window displays a popup menu that may include the following choice, depending on the column: Finish All. Right-clicking a session in the list displays a popup menu with the following choices: Scope, Language, Make Current, Finish, Finish All, and Show Only Rows Where. Items are enabled or disabled based on context. The Sessions window (ALT-SHIFT-6) opens in the bottom right of the IDE.
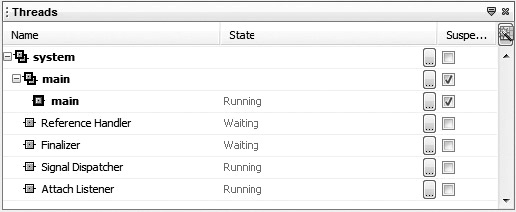
Threads Window
The Threads window, shown in Figure 9-17, lists all of the threads in the current debugging session. Thread states may be Monitor, Not Started, Running, Sleeping, Unknown, Waiting, or Zombie. Right-clicking a thread in the list displays a popup menu with the following choices: Make Current, Resume/Suspend, Interrupt, and Go To Source. Items are enabled or disabled based on context. The Threads window (ALT-SHIFT-7) opens in the bottom right of the IDE.
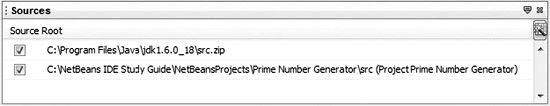
Sources Window
The Sources window, as shown in Figure 9-18, lists source code files that may be available to the debugger. Right-clicking the empty portion of the Sources window displays a popup menu with the following choices: Add Source Root, Move Up, Move Down, and Reset Order. The Move Up and Move Down menu items are enabled only when you right-click a source root that can move in that direction. The Sources window (ALT-SHIFT-8) opens in the bottom right of the IDE.
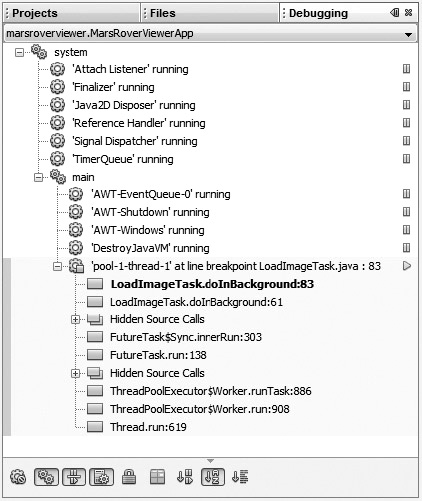
Debugging Window
The Debugging window lists all of the threads in the current debugging session and allows you to view, suspend, and resume the thread. The Debugging window is not in NetBeans 6.1 so is therefore not on the exam.
The Debugging window (ALT-SHIFT-9) opens in the left pane and may be grouped with other open windows such as Projects, Files, and Services.
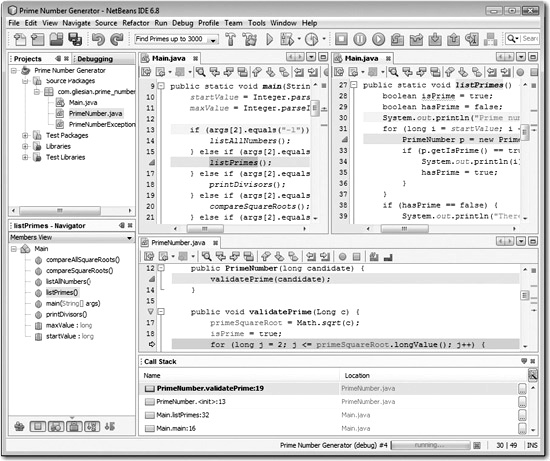
Figure 9-19 shows the debugging against the Mars Rover Viewer sample application (MarsRoverViewerApp).
Debugging Support Windows Behavior
Debugging support windows have behavior as described in the following two subsections.
Opening and Closing Windows Debugging support windows, which open when a debugging session is running, automatically close when all debugging sessions finish. Debugging support windows that are opened when there is no debugging session running stay open until you close them.
Changing Visible Columns in Debugging Windows All debugging support windows with the exception of the Debugging window have an icon in the upper-right corner that opens a Change Visible Columns dialog box. The dialog box has a checkbox for each column. If the checkbox is selected, the column is displayed. If deselected, the column is not displayed. Mandatory columns are listed, but their checkbox component is disabled because the column cannot be deselected.
CERTIFICATION OBJECTIVE: Debugging Remote Applications
Exam Objective 6.3 Describe the difference between local and remote debugging and describe how to debug a remote web application.
This section touches on the primary differences in debugging and the various means to debug remote and/or web applications.
![]() Differences Between Local and Remote Debugging
Differences Between Local and Remote Debugging
![]() Web Application Debugging
Web Application Debugging
Differences Between Local and Remote Debugging
Local debugging is the process of analyzing a program that is running on the same machine as the IDE. Remote debugging is the process of analyzing a program that is running on a different machine. Setting breakpoints, stepping through code, setting watches, analyzing variables, and all other debugging features are essentially the same between local and remote debugging. The main difference is the need to attach the debugger when you are debugging remotely. As such, there are three primary steps in starting a remote debugging session:
1. Start the remote application in debugging mode.
2. On the machine where the IDE is running, open the project with the source code.
3. Attach the debugger.
Starting the Remote Application in Debugging Mode
To debug a remote application, the application must be started in debug mode. To do this, you need to pass additional switches and values to the Java interpreter. As there are many JVMs by various vendors, the switches and settings for debugging may vary slightly. Also note that -X[name] options are not standardized and are subject to change or removal. With this being said, you need to find the documentation for your specific JVM to determine exactly what you need to do to set up debugging. Exercising java -h or java-X prints some help information to get you started. Information specific to Sun’s Hotspot VM can be found here: http://java.sun.com/products/jpda/doc/conninv.html. For the scope of the exam, you simply need to know that the -Xdebug switch is a common switch that is required when invoking the interpreter.
If you have time, you can go through the exercise of setting up a remote debugging session. However, understanding only the concept of remote debugging is needed. You would probably be better off studying other areas or objectives where you are weak.
Opening the Project in the IDE
The process of opening the project to be used for debugging is straightforward being done in the traditional manner (e.g., CTRL-SHIFT-O). Make sure that you use the source code that matches the remote application that is running.
Attaching the Debugger
Attaching the debugger requires some configuration. For the purpose of the exam, we are most concerned with details of the Java debugger, which is based on the Java Platform Debugger Architecture (JPDA). The JPDA includes the following three-layered APIs:
![]() Java Debug Interface (JDI) A high-level Java language interface with support for remote debugging.
Java Debug Interface (JDI) A high-level Java language interface with support for remote debugging.
![]() Java Debug Wire Protocol (JDWP) A protocol that defines the format of information and requests transferred between the process being debugged and the debugger front-end.
Java Debug Wire Protocol (JDWP) A protocol that defines the format of information and requests transferred between the process being debugged and the debugger front-end.
![]() JVM Tools Interface (JVM TI) A low-level native interface that defines the services a Java virtual machine provides for tools such as debuggers and profilers. The JVM TI replaces the legacy JVMPI and JVMDI interfaces.
JVM Tools Interface (JVM TI) A low-level native interface that defines the services a Java virtual machine provides for tools such as debuggers and profilers. The JVM TI replaces the legacy JVMPI and JVMDI interfaces.
In addition to the JPDA debugger, other platforms can be attached to the IDE including the Web Page Debugger (JavaScript), Gdb debugger, and Ruby debuggers. Debugger platforms are attached through the Attach dialog box, which is invoked via Debug | Attach Debugger or through the Attach Debugger menu item associated with the Debug Main Project icon in the Run toolbar. Once in the dialog box, you see several ways to attach a debugger. The Scenario & Solution explores ways to attach the JPDA debugger.
SCENARIO & SOLUTION
Consider adding the FindBugs, Checkstyle, and PMD plugins to your IDE. These software quality tools may expose flaws in your code that may help expedite debugging once they are resolved. Note that these tools are not integrated with the debugger.
Several NetBeans IDE tools and features support debugging local, remote, and web applications. You can monitor HTTP messages with the HTTP Server-Side Monitor, as detailed in Chapter 8. You can test source code with JUnit, as detailed in Chapter 10. You can profile applications as detailed in Chapter 10. A new feature in NetBeans 6.9 is Debugger Attachment History; the last four Debug Attachment configurations are appended to the menu associated with the Debug Main Project icon in the Run toolbar.
Web Application Debugging
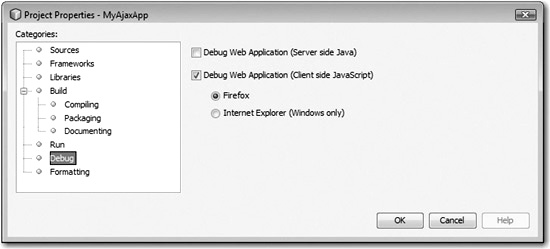
When debugging a web application, you can decide to debug server-side code, JavaScript on the client side, or both, as shown in the Project Properties dialog box in Figure 9-20. Server-side debugging allows you to set breakpoints on and to step through the Java code or JSP code. Client-side debugging allows you to set breakpoints on and to step through HTML and JavaScript code. Active debuggers are listed in the Sessions window (ALT-SHIFT-6).
Note that if you try to debug an application on the client side and the browser doesn’t have the necessary support to run the NetBeans JavaScript Debugger, a dialog box displays the same information as in Figure 9-20.
FIGURE 9-20 Debug settings in the Project Properties dialog box
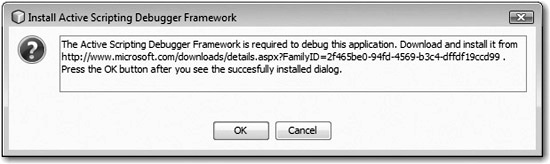
When you decide to debug on the client side with the NetBeans JavaScript Debugger, both Firefox and Internet Explorer need add-ons to support client-side debugging. The IDE detects whether necessary add-ons are present and prompts you to install them if they are not, as shown for Firefox in Figure 9-21. Firefox automatically installs the netbeans.firefox.extensions add-on and the Firebug add-on. Internet Explorer installs the netbeans.ie.extension add-on and guides you through manual installation of the Active Scripting Debugger Framework add-on, as shown in Figure 9-22.
FIGURE 9-21 Install Firefox Add-ons dialog box
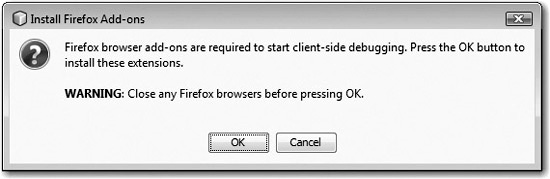
FIGURE 9-22 Install Active Scripting Debugger Framework dialog box
Firebug is currently the most popular CSS/HTML/JavaScript debugger. NetBeans has recognized this and has not tried to replicate its features in current versions of the IDE. Actually, the NetBeans JavaScript Debugger may be a thing of the past because its plugin is not included in the initial release of NetBeans 6.9.
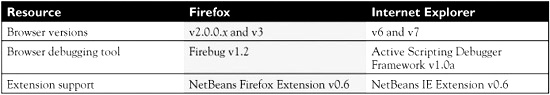
Table 9-3 shows the latest known requirements for using the NetBeans JavaScript Debugger.
TABLE 9-3 NetBeans JavaScript Debugger Requirements
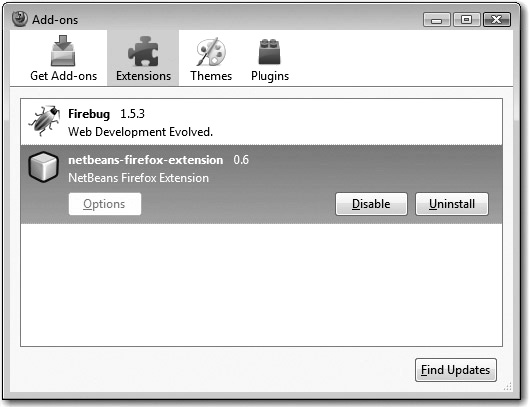
You can verify the installation of the add-ons in the Add-ons window of your browser, as shown for Firefox in Figure 9-23. For Firefox, select Tools | Add-ons. For Internet Explorer, select Tools | Manage Add-ons | Enable or Disable Add-ons.
EXERCISE 9-2 Debugging Various Files in a Web Application
This exercise has you setting breakpoints in various types of web application files and stepping through those breakpoints.
1. Download the NetBeans 6.5 MyAjaxApp sample application from http://netbeans.org/kb/samples/, and open it in the NetBeans IDE.
2. Ensure server-side and client-side debugging is enabled. You can do this by verifying the checkboxes are selected in the Debug node of the Project Properties window. Select the Debug Web Application (Server Side Java) checkboxes. Select the Debug Web Application (Client Side JavaScript) checkboxes, along with the Firefox radio button.
3. Set breakpoints in the AutoCompleteServlet.java Servlet file.
4. Set breakpoints in the composer.jsp JavaServer Pages file.
5. Set breakpoints in the javascript.js JavaScript file.
6. Start the debugger.
7. In the Sessions window, ensure that the MyAjaxApp and NETBEANSFIREFOX-DBUGGER-0 sessions are listed.
8. Continue the debugger repeatedly so you stop on each breakpoint.
CERTIFICATION SUMMARY
This chapter contained information related to the Java debugger. The chapter was broken into two primary sections based on the local and remote debugging objectives. The first section detailed session establishment, breakpoint settings, code stepping, and debugging support windows. The information was laid out in a sequential pattern to complement your learning. Since all of the features are used in an integrated way, it behooves you to use the debugger as often as possible leading up to the test to gain the necessary experience. The second section detailed remote debugging. Coverage included steps to attach the remote debugger and setting up the NetBeans JavaScript Debugger tool. If you take the time to actually use the debugger and perform the exercises in the chapter, you will score well on debugger-related questions on the exam.
 TWO-MINUTE DRILL
Debugging Local Applications
![]() There are several ways to start a debugging session: Debug | Debug Main Project (CTRL-F5), Debug | Step Into (F7), Debug | Run To Cursor (F4), and by right-clicking the project and choosing Debug.
There are several ways to start a debugging session: Debug | Debug Main Project (CTRL-F5), Debug | Step Into (F7), Debug | Run To Cursor (F4), and by right-clicking the project and choosing Debug.
![]() Individual runnable files including unit tests can be debugged: Select the file, Debug | Debug [filename].
Individual runnable files including unit tests can be debugged: Select the file, Debug | Debug [filename].
![]() A debugging session can be stopped by choosing Debug | Finish Debugging Session (SHIFT-F5).
A debugging session can be stopped by choosing Debug | Finish Debugging Session (SHIFT-F5).
![]() Six types of breakpoints can be set: class, exception, method, field, thread, and line.
Six types of breakpoints can be set: class, exception, method, field, thread, and line.
![]() The shortcut to the New Breakpoint dialog box is CTRL-SHIFT-F8.
The shortcut to the New Breakpoint dialog box is CTRL-SHIFT-F8.
![]() Breakpoints can be controlled based on Boolean conditions.
Breakpoints can be controlled based on Boolean conditions.
![]() NetBeans provides eight primary session-related commands: Step Over, Step Over Expression, Step Into, Step Into Next Method, Step Out, Run To Cursor, Continue, and Pause.
NetBeans provides eight primary session-related commands: Step Over, Step Over Expression, Step Into, Step Into Next Method, Step Out, Run To Cursor, Continue, and Pause.
![]() The Step Over command (F8) allows the debugger to step through lines of code while executing entire routines.
The Step Over command (F8) allows the debugger to step through lines of code while executing entire routines.
![]() The Step Over Expression command (SHIFT-F8) allows the debugger to step through an expression and view the value of each method call in the expression in the Variables window.
The Step Over Expression command (SHIFT-F8) allows the debugger to step through an expression and view the value of each method call in the expression in the Variables window.
![]() The Step Into command (F7) allows the debugger to step into lines of code individually.
The Step Into command (F7) allows the debugger to step into lines of code individually.
![]() The Step Into Next Method command (SHIFT-F7) allows the debugger to execute singular source lines and to stop before execution of the first statements of methods.
The Step Into Next Method command (SHIFT-F7) allows the debugger to execute singular source lines and to stop before execution of the first statements of methods.
![]() The Step Out command (CTRL-F7) allows the debugger to execute singular source lines and exit out of methods after executing the remaining lines.
The Step Out command (CTRL-F7) allows the debugger to execute singular source lines and exit out of methods after executing the remaining lines.
![]() The Run To Cursor command executes the debugger up to the insertion point made by the cursor.
The Run To Cursor command executes the debugger up to the insertion point made by the cursor.
![]() The Continue (F5) command resumes the execution of the debugger.
The Continue (F5) command resumes the execution of the debugger.
![]() The Pause command suspends the execution of the debugger.
The Pause command suspends the execution of the debugger.
![]() There are nine primary debugging windows: Variables, Watches, Call Stack, Loaded Classes, Breakpoints, Sessions, Threads, Sources, and Debugging.
There are nine primary debugging windows: Variables, Watches, Call Stack, Loaded Classes, Breakpoints, Sessions, Threads, Sources, and Debugging.
![]() The Variables window (ALT-SHIFT-1) lists the variables in the current call.
The Variables window (ALT-SHIFT-1) lists the variables in the current call.
![]() The Watches window (ALT-SHIFT-2) lists specified variables and expressions to watch while in a debugging session.
The Watches window (ALT-SHIFT-2) lists specified variables and expressions to watch while in a debugging session.
![]() The Call Stack window (ALT-SHIFT-3) lists the sequence of calls made during the execution of the current thread while highlighting the current call.
The Call Stack window (ALT-SHIFT-3) lists the sequence of calls made during the execution of the current thread while highlighting the current call.
![]() The Loaded Classes window (ALT-SHIFT-4) lists the loaded classes for the current debugging session. Right-clicking a class and choosing Show In Instances View opens the Instances window with related information.
The Loaded Classes window (ALT-SHIFT-4) lists the loaded classes for the current debugging session. Right-clicking a class and choosing Show In Instances View opens the Instances window with related information.
![]() The Breakpoints window (ALT-SHIFT-5) lists all of the project breakpoints.
The Breakpoints window (ALT-SHIFT-5) lists all of the project breakpoints.
![]() The Sessions window (ALT-SHIFT-6) lists all running debugging sessions.
The Sessions window (ALT-SHIFT-6) lists all running debugging sessions.
![]() The Threads window (ALT-SHIFT-7) lists all of the threads in the current debugging session.
The Threads window (ALT-SHIFT-7) lists all of the threads in the current debugging session.
![]() The Sources window (ALT-SHIFT-8) lists source code files that may be available to the debugger.
The Sources window (ALT-SHIFT-8) lists source code files that may be available to the debugger.
![]() The Debugging window (ALT-SHIFT-9) displays a list of threads in the current debugging session and allows for the suspension and resumption of those threads.
The Debugging window (ALT-SHIFT-9) displays a list of threads in the current debugging session and allows for the suspension and resumption of those threads.
![]() The Debug toolbar is present when sessions are established. The toolbar has icons for Finish Debugger Session, Pause, Continue, Step Over, Step Over Expression, Step Into, Step Out, Run To Cursor, and Apply Code Changes.
The Debug toolbar is present when sessions are established. The toolbar has icons for Finish Debugger Session, Pause, Continue, Step Over, Step Over Expression, Step Into, Step Out, Run To Cursor, and Apply Code Changes.
Debugging Remote Applications
![]() Remote debugging is the process of debugging applications on remote computers.
Remote debugging is the process of debugging applications on remote computers.
![]() Debug | Attach Debugger allows for the attachment of the Java Debugger (JPDA), Web Page Debugger (JavaScript), and various other debuggers.
Debug | Attach Debugger allows for the attachment of the Java Debugger (JPDA), Web Page Debugger (JavaScript), and various other debuggers.
![]() The JVM TI replaces the JVMPI and JVMDI interfaces.
The JVM TI replaces the JVMPI and JVMDI interfaces.
![]() The -Xdebug switch is used when starting up remote applications such as Tomcat in the debug mode.
The -Xdebug switch is used when starting up remote applications such as Tomcat in the debug mode.
![]() The NetBeans JavaScript Debugger depends on Firebug and the NetBeans Firefox Extension when using the Firefox web browser for debugging.
The NetBeans JavaScript Debugger depends on Firebug and the NetBeans Firefox Extension when using the Firefox web browser for debugging.
![]() The NetBeans JavaScript Debugger depends on Active Scripting Framework and the NetBeans IE Extension when using the Internet Explorer web browser for debugging.
The NetBeans JavaScript Debugger depends on Active Scripting Framework and the NetBeans IE Extension when using the Internet Explorer web browser for debugging.
![]() The NetBeans IDE detects if the web browser that is to be used does not have the necessary add-ons to support debugging and thereafter begins the install process for the necessary add-ons.
The NetBeans IDE detects if the web browser that is to be used does not have the necessary add-ons to support debugging and thereafter begins the install process for the necessary add-ons.
SELF TEST
The following questions will help you measure your understanding of the material presented in this chapter. Read all the choices carefully because there might be more than one correct answer. Choose all correct answers for each question.
Debugging Local Applications
1. How is the menu command reached that allows debugger windows to be opened by selecting a window name?
A. Debugging Window | [window_name]
B. Debugger Windows | [window_name]
C. Window | Debugger Windows | [window_name]
D. Window | Debugging | [window_name]
2. How can you add a line breakpoint? Select all that apply.
A. Click in the left margin of the source editor.
B. Press CTRL-F8.
C. Select Debug | Toggle Line Breakpoint from the main menu.
D. All of the above.
3. What types of breakpoints can be added in addition to line breakpoints? Select all that apply.
A. Class breakpoints
B. Exception breakpoints
C. Method breakpoints
D. Field breakpoints
E. Module breakpoints
F. Thread breakpoints
4. True or false. In the Breakpoints window, you can organize breakpoints by groups.
A. True
B. False
5. What is a conditional breakpoint?
A. A breakpoint that is hit only when a Boolean expression evaluates to true.
B. A breakpoint that is hit only when a Boolean expression evaluates to false.
C. A breakpoint that is hit only if the line number and filename are defined in a conditional.xml file.
D. A breakpoint that has a dependency to another breakpoint occurring.
6. How do you finish (gracefully stop) a debug session? Select all that apply.
A. Press SHIFT-F4.
B. Select Debug | Finish Debugger Session from the main menu.
C. Click the Finish Debugger Session icon from the Debug toolbar.
D. Right-click the project within the Projects window and select Finish Debugger Session.
7. Which step command causes the execution of the program to resume until the next breakpoint is reached?
A. Step Over
B. Step Into
C. Resume
D. Continue
8. The Loaded Classes debugging window has a table with three columns. What are the header names of these columns?
A. Name, Type, Value
B. Name, State, Language
C. Class Name, Loaded, Instances
D. Class Name, Instances [%], Instances
Debugging Remote Applications
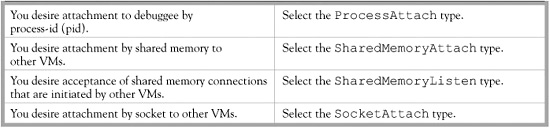
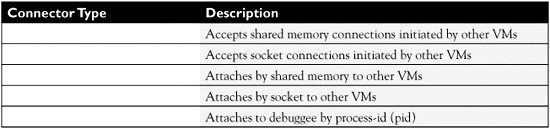
9. Complete the following table to match connector types to functions. Connector types are SocketAttach, SharedMemoryAttach, ProcessAttach, SocketListen, and SharedMemoryListen.
10. Various flags relate to debugging functionality when invoking the Java interpreter. Select all that apply.
A. -Xdebug
B. -Xnoagent
C. -Xrunjdwp
D. -Xprepare
11. The JavaScript debugger is capable of installing debugging support add-ons into which browsers? Select all that apply.
A. Firefox
B. SeaMonkey
C. Chrome
D. Internet Explorer
SELF TEST ANSWERS
Debugging Local Applications
1. How is the menu command reached that allows debugger windows to be opened by selecting a window name?
A. Debugging Window | [window_name]
B. Debugger Windows | [window_name]
C. Window | Debugger Windows | [window_name]
D. Window | Debugging | [window_name]
![]() D. The menu command that allows debugger windows to be opened by selecting a window name is reached by choosing Window | Debugging | [window_name].
D. The menu command that allows debugger windows to be opened by selecting a window name is reached by choosing Window | Debugging | [window_name].
![]() A, B, and C are incorrect. A is incorrect because Debugging Window is not a menu bar item. B is incorrect because Debugger Windows is not a menu bar item. C is incorrect because Debugger Windows is not a menu item under the Window menu bar item.
A, B, and C are incorrect. A is incorrect because Debugging Window is not a menu bar item. B is incorrect because Debugger Windows is not a menu bar item. C is incorrect because Debugger Windows is not a menu item under the Window menu bar item.
2. How can you add a line breakpoint? Select all that apply.
A. Click in the left margin of the source editor.
B. Press CTRL-F8.
C. Select Debug | Toggle Line Breakpoint from the main menu.
D. All of the above.
![]() D. All of the above is correct because a line breakpoint can be set by clicking the left margin of the source editor relative to the line you want to have a breakpoint set at, pressing CTRL-F8, or selecting Debug | Toggle Line Breakpoint from the main menu.
D. All of the above is correct because a line breakpoint can be set by clicking the left margin of the source editor relative to the line you want to have a breakpoint set at, pressing CTRL-F8, or selecting Debug | Toggle Line Breakpoint from the main menu.
![]() A, B, and C are incorrect if selected individually, because all the answers are correct.
A, B, and C are incorrect if selected individually, because all the answers are correct.
3. What types of breakpoints can be added in addition to line breakpoints? Select all that apply.
A. Class breakpoints
B. Exception breakpoints
C. Method breakpoints
D. Field breakpoints
E. Module breakpoints
F. Thread breakpoints
![]() A, B, C, D, and F. In addition to line breakpoints, class, exception, method, field, and thread breakpoints may be added.
A, B, C, D, and F. In addition to line breakpoints, class, exception, method, field, and thread breakpoints may be added.
![]() E is incorrect. There is no such thing as module breakpoints.
E is incorrect. There is no such thing as module breakpoints.
4. True or false. In the Breakpoints window, you can organize breakpoints by groups.
A. True
B. False
![]() A. True. In the Breakpoints window, you can organize breakpoints by groups. Right-click the breakpoint in the Breakpoints window, and select Move Into Group, followed by selection of an existing group or invocation of the New Group dialog box.
A. True. In the Breakpoints window, you can organize breakpoints by groups. Right-click the breakpoint in the Breakpoints window, and select Move Into Group, followed by selection of an existing group or invocation of the New Group dialog box.
5. What is a conditional breakpoint?
A. A breakpoint that is hit only when a Boolean expression evaluates to true.
B. A breakpoint that is hit only when a Boolean expression evaluates to false.
C. A breakpoint that is hit only if the line number and filename are defined in a conditional.xml file.
D. A breakpoint that has a dependency to another breakpoint occurring.
![]() A. A conditional breakpoint is a breakpoint that is hit only when a Boolean expression evaluates to true.
A. A conditional breakpoint is a breakpoint that is hit only when a Boolean expression evaluates to true.
![]() B, C, and D are incorrect. B is incorrect because conditional breakpoints are hit only when the Boolean expression evaluates to true. C is incorrect because there is no such conditional .xml file; it was fabricated in an attempt to throw you off. D is incorrect because a conditional breakpoint is not a breakpoint dependent on another breakpoint occurring.
B, C, and D are incorrect. B is incorrect because conditional breakpoints are hit only when the Boolean expression evaluates to true. C is incorrect because there is no such conditional .xml file; it was fabricated in an attempt to throw you off. D is incorrect because a conditional breakpoint is not a breakpoint dependent on another breakpoint occurring.
6. How do you finish (gracefully stop) a debug session? Select all that apply.
A. Press SHIFT-F4.
B. Select Debug | Finish Debugger Session from the main menu.
C. Click the Finish Debugger Session icon on the Debug toolbar.
D. Right-click the project within the Projects window and select Finish Debugger Session.
![]() B and C. A debug session can be stopped in a variety of ways including the selection of Debug | Finish Debugger Session from the main menu or by clicking the Finish Debugger Session icon on the Debug toolbar.
B and C. A debug session can be stopped in a variety of ways including the selection of Debug | Finish Debugger Session from the main menu or by clicking the Finish Debugger Session icon on the Debug toolbar.
![]() A and D are incorrect. A is incorrect because SHIFT-F4 runs the debugger to the cursor. Pressing SHIFT-F5 stops the session. D is incorrect because there is no menu option from the Projects node to end the debugger session.
A and D are incorrect. A is incorrect because SHIFT-F4 runs the debugger to the cursor. Pressing SHIFT-F5 stops the session. D is incorrect because there is no menu option from the Projects node to end the debugger session.
7. Which step command causes the execution of the program to resume until the next breakpoint is reached?
A. Step Over
B. Step Into
C. Resume
D. Continue
![]() D. The Continue step command causes the execution of the program to resume until the next breakpoint is reached.
D. The Continue step command causes the execution of the program to resume until the next breakpoint is reached.
![]() A, B, and C are incorrect. A is incorrect because Step Over only executes the current line. B is incorrect because Step Into only executes the current line. C is incorrect because there is no Resume step command.
A, B, and C are incorrect. A is incorrect because Step Over only executes the current line. B is incorrect because Step Into only executes the current line. C is incorrect because there is no Resume step command.
8. The Loaded Classes debugging window has a table with three columns. What are the header names of these columns?
A. Name, Type, Value
B. Name, State, Language
C. Class Name, Loaded, Instances
D. Class Name, Instances [%], Instances
![]() D. The column names of the table in the Loaded Classes window are Class Name, Instances [%], and Instances.
D. The column names of the table in the Loaded Classes window are Class Name, Instances [%], and Instances.
![]() A, B, and C are incorrect. A is incorrect because Name, Type, and Value are not table header names in the Loaded Classes window. They are header names in the Variables and Watches windows. B is incorrect because Name, State, and Language are not table header names in the Loaded Classes window. They are header names in the Sessions window. C is incorrect because Loaded is not a table header name in the Loaded Classes window.
A, B, and C are incorrect. A is incorrect because Name, Type, and Value are not table header names in the Loaded Classes window. They are header names in the Variables and Watches windows. B is incorrect because Name, State, and Language are not table header names in the Loaded Classes window. They are header names in the Sessions window. C is incorrect because Loaded is not a table header name in the Loaded Classes window.
Debugging Remote Applications
9. Complete the following table to match connector types to functions. Connector types are SocketAttach, SharedMemoryAttach, ProcessAttach, SocketListen, and SharedMemoryListen.
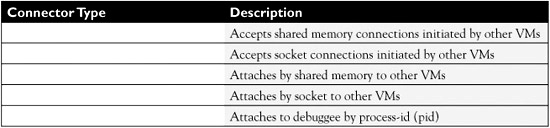
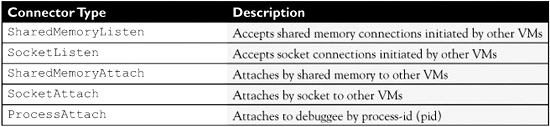
![]() The following table matches the connector types to functions:
The following table matches the connector types to functions:
10. Various flags relate to debugging functionality when invoking the Java interpreter. Select all that apply.
A. -Xdebug
B. -Xnoagent
C. -Xrunjdwp
D. -Xprepare
![]() A, B, and C. The -Xdebug, -Xnoagent, and -Xrunjdwp flags relate to debugging functionality when invoking the Java interpreter.
A, B, and C. The -Xdebug, -Xnoagent, and -Xrunjdwp flags relate to debugging functionality when invoking the Java interpreter.
![]() D is incorrect because there is no -Xprepare flag.
D is incorrect because there is no -Xprepare flag.
11.. The JavaScript debugger is capable of installing debugging support add-ons into which browsers? Select all that apply.
A. Firefox
B. SeaMonkey
C. Chrome
D. Internet Explorer
![]() A and D. The JavaScript debugger is capable of installing debugging support add-ons into Firefox and Internet Explorer.
A and D. The JavaScript debugger is capable of installing debugging support add-ons into Firefox and Internet Explorer.
![]() B and C are incorrect. B is incorrect because the JavaScript debugger is not currently capable of installing debugging support add-ons into the SeaMonkey web browser. C is incorrect because the JavaScript debugger is not currently capable of installing debugging support add-ons into the Chrome web browser.
B and C are incorrect. B is incorrect because the JavaScript debugger is not currently capable of installing debugging support add-ons into the SeaMonkey web browser. C is incorrect because the JavaScript debugger is not currently capable of installing debugging support add-ons into the Chrome web browser.