
APPENDIX A
SPSS at a Glance
A.1 Introduction
Statistical Package for Social Sciences, or SPSS®, is a powerful tool for performing statistical analyses. Once you learn some basics, you will be able to save hours of algebraic computations while producing meaningful results. This section of the appendices includes a very basic overview of SPSS. We recommend you also run the tutorial when the program initially starts. The tutorial offers you a more detailed description of how to use the program.
A.2 Opening SPSS
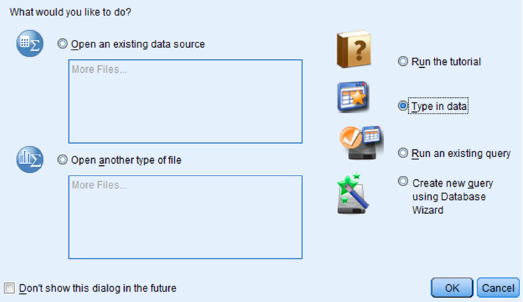
Begin by launching SPSS like any normal application. After SPSS begins, a window will appear, as seen in Figure A.1. Choose “Type in data” and click “OK.” From this screen, you can also view the SPSS tutorial or open a file with existing data.
A.3 Inputting Data
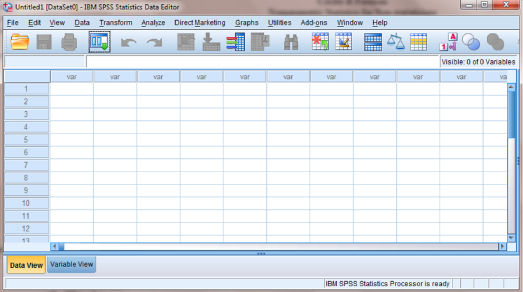
The SPSS Data Editor window is shown in Figure A.2a. This window will allow you to type in your data. Notice the “Data View” and the “Variable View” tabs at the bottom of the window. Before inputting values, we must setup our variables.
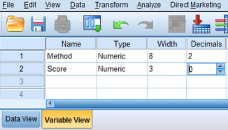
- Select the “Variable View” tab located at the bottom of the SPSS Data Editor window to define the characteristics of your variables.
- Once you change the window to Variable View, as seen in Figure A.2b, type in the names for each variable in the “Names” field. SPSS will not accept spaces at this step, so use underscores. For example, use “Test_A” instead of “Test A.”
- In the “Width” field, choose the maximum number of characters for each value.
- In the “Decimals” field, choose the number of decimals for each value. For the “Score” variable, we have changed the width to three characters and the decimals to 0, as seen in Figure A.2c.
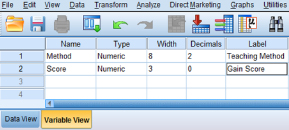
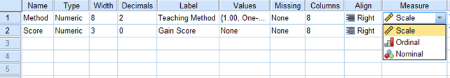
- Use the “Label” field to assign names to the variables. Those names will appear in the output report that SPSS returns after an analysis. In addition, the “Label” field will allow you to use spaces, unlike the “Name” field. Figure A.2d illustrates that “Teaching Method” will identify the “Method” variable in the SPSS output report.
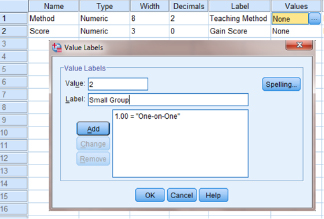
- Use the “Values” field to assign a value to categorical data. As shown in Figure A.2e, clicking on the gray box in the right side of the column will cause a new window to appear, which allows you to input your settings. As seen in Figure A.2e, the “One-on-One” teaching method is assigned a value of 1 and the “Small Group” teaching method is assigned a value of 2.
- The “Align” field allows you to change the alignment of the values as they appear in the “Data view” tab.
- The “Measure” field allows you to select the type of scale. In Figure A.2f, we are preparing to change the “Method” variable from a scale to a nominal measure.
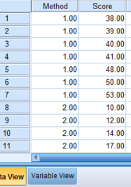
- Finally, click on the “Data view” tab at the bottom of the screen and manually type in your data values or paste them from a spreadsheet. Figure A.2g shows the values entered into the Data Editor.

A.4 Analyzing Data
Choose “Analyze” from the pull-down menus at the top of the Data Editor window and select the appropriate test. In Figure A.3, notice that “Nonparametric Tests” has been selected. This menu presents all of the tests discussed in this book.
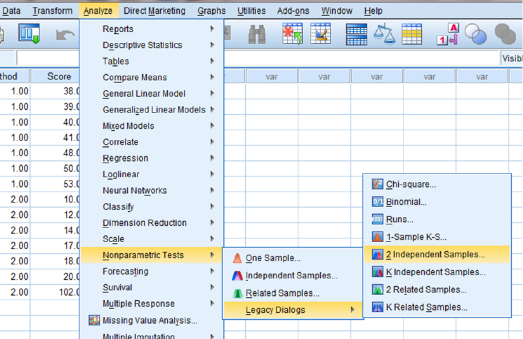
If your menu choices look slightly different than Figure A.3, it may be that you are using the student version of SPSS. The student version is far more powerful than most people will ever need, and even though the figures in this book are from the full version of SPSS, we doubt that you will notice any difference.
A.5 The SPSS Output
Once SPSS has performed an analysis, a new window will appear called the “SPSS Viewer,” as seen in Figure A.4. The window is separated into two panes. The left pane is called the outline pane and shows all of the information stored in the viewer. The pane to the right is called the contents pane and shows the actual output of the analysis.
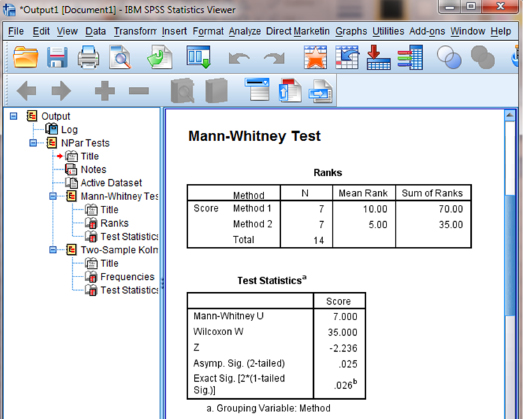
You may wish to include any tables or graphs from the output pane in a report. You can select the objects in the contents pane and copy them onto a word processing document. The small red arrow identifies the selected object.