
APPENDIX B
Critical Value Tables

TABLE B.3 Critical Values for the Wilcoxon Signed Rank Test Statistics T.
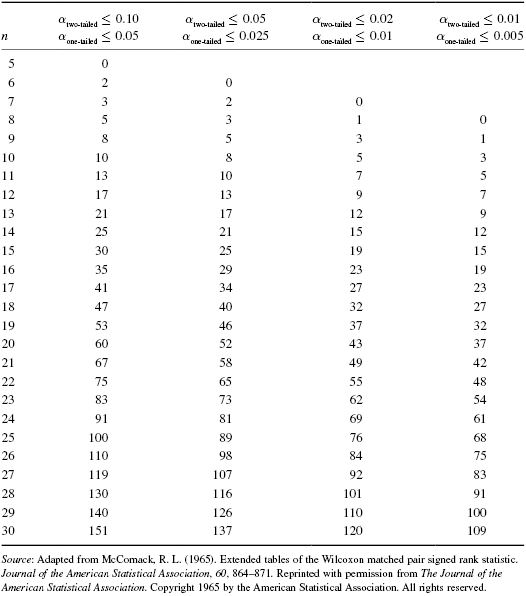
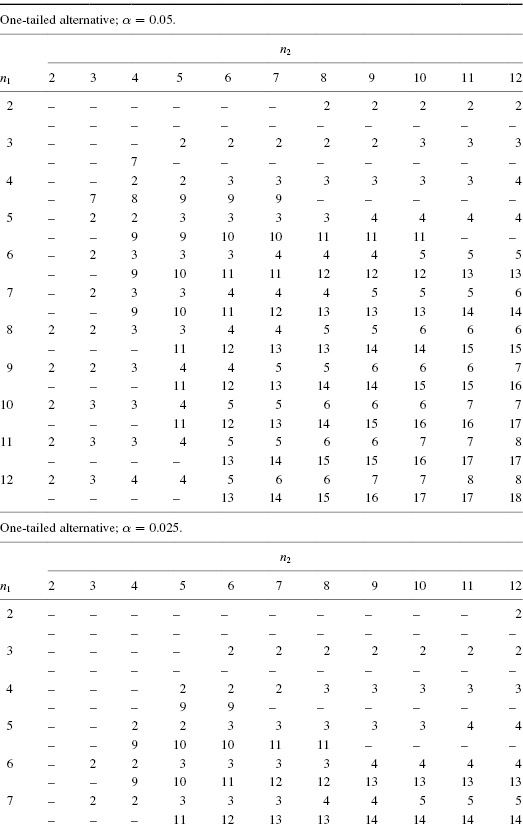
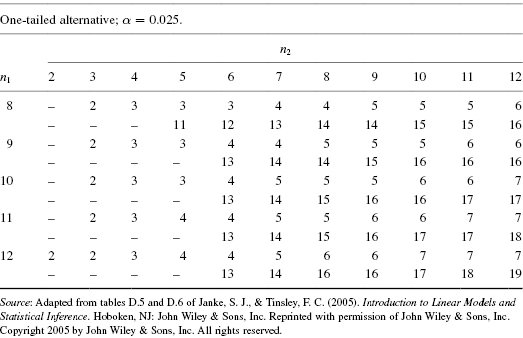
TABLE B.4 Critical Values for the Mann–Whitney U-Test Statistic.
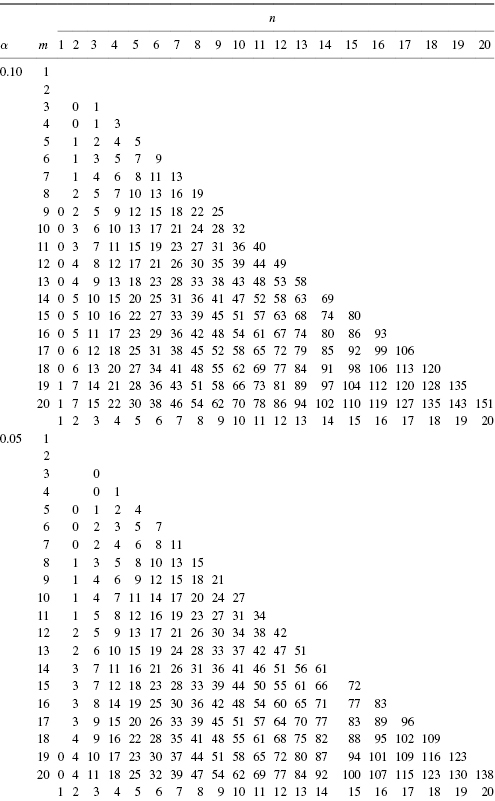
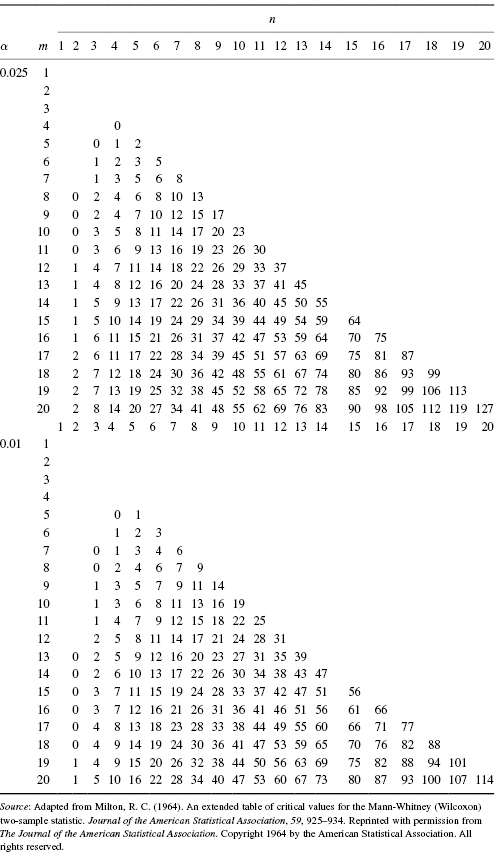
TABLE B.5 Critical Values for the Friedman Test Statistic Fr.
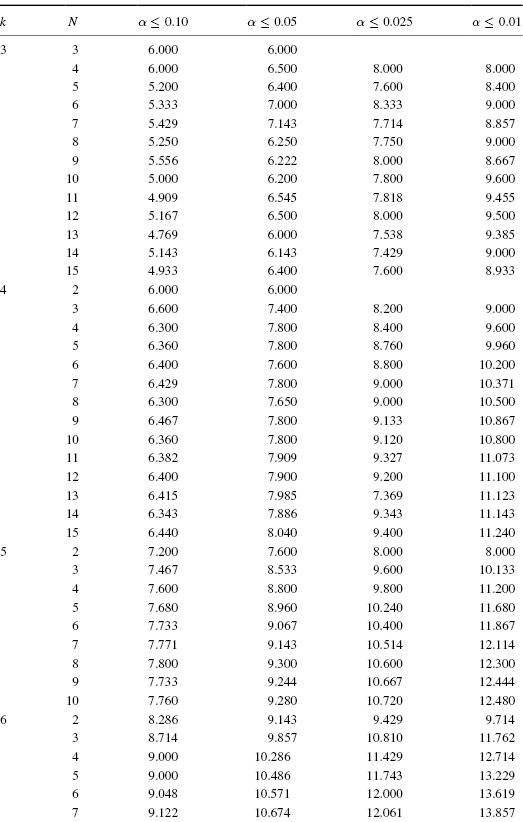
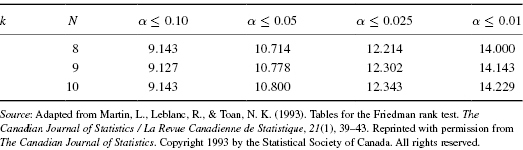
TABLE B.6 The Critical Values for the Kruskal–Wallis H-Test Statistic.
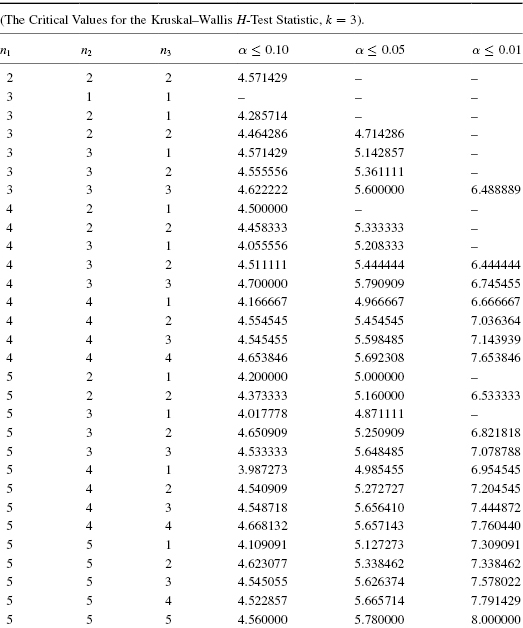
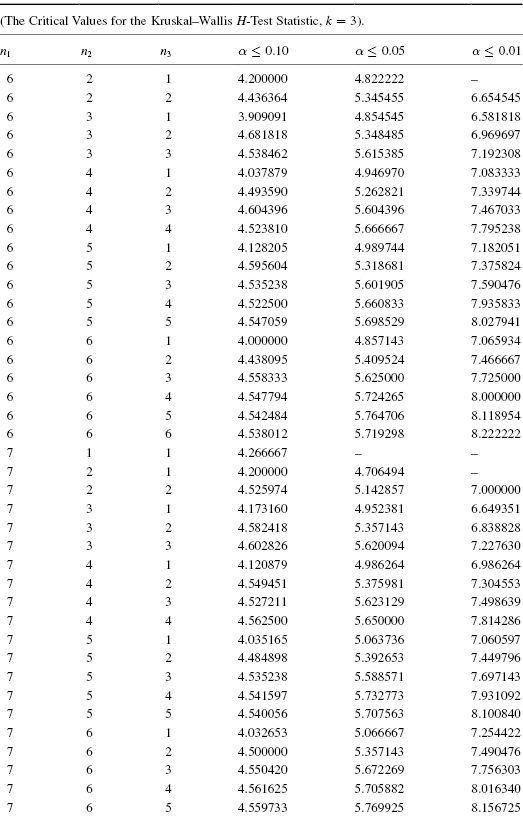
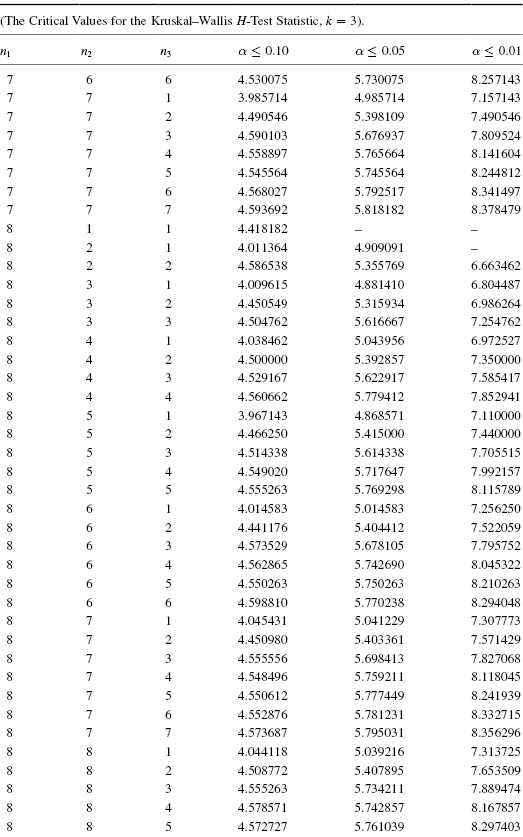
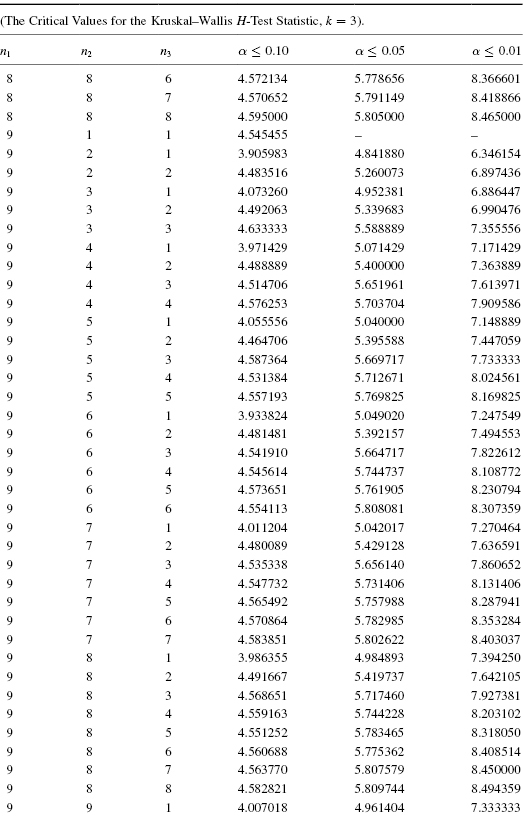
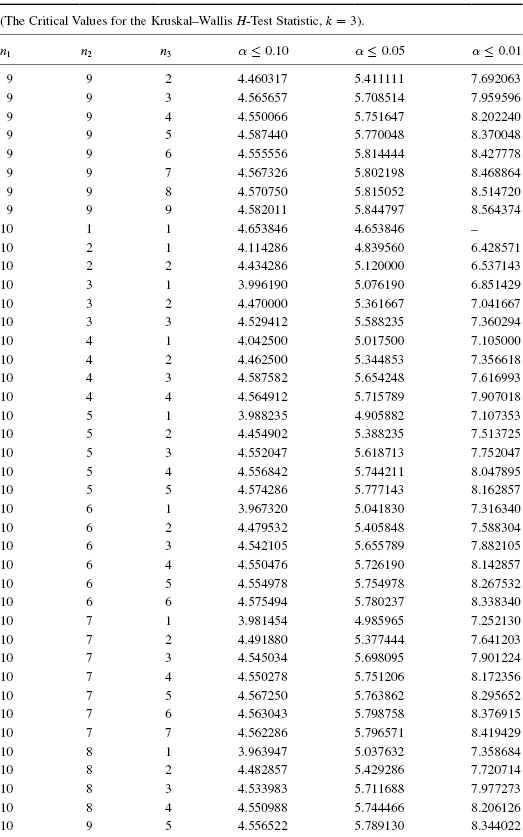
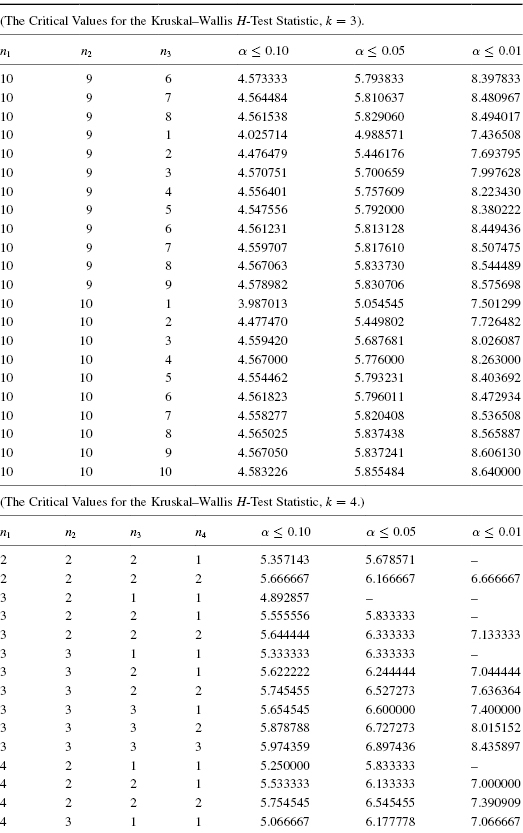
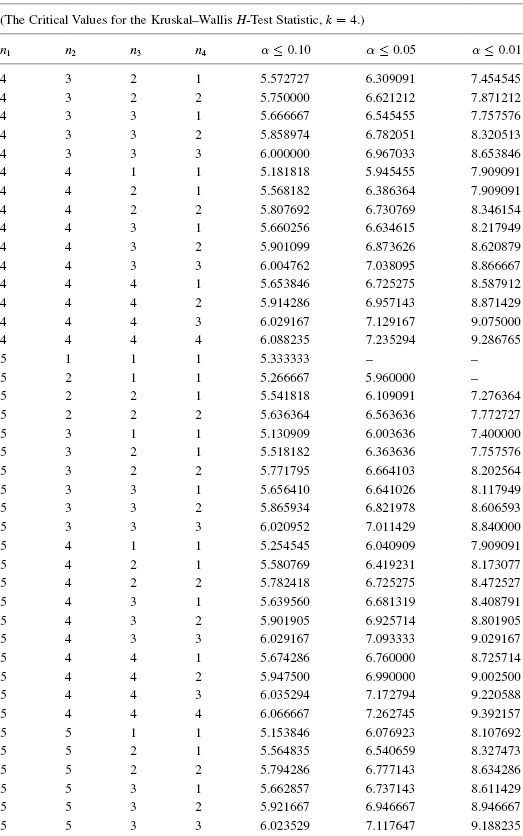
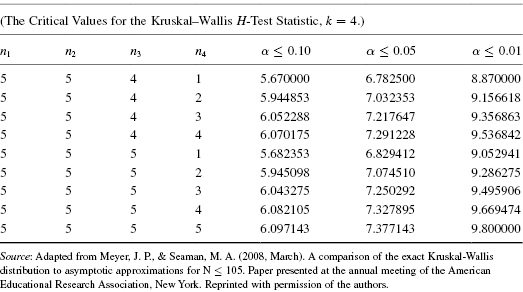
TABLE B.7 Critical Values for the Spearman Rank-Order Correlation Coefficient rs.
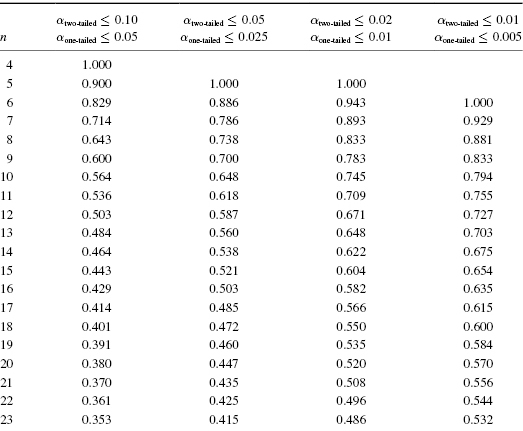
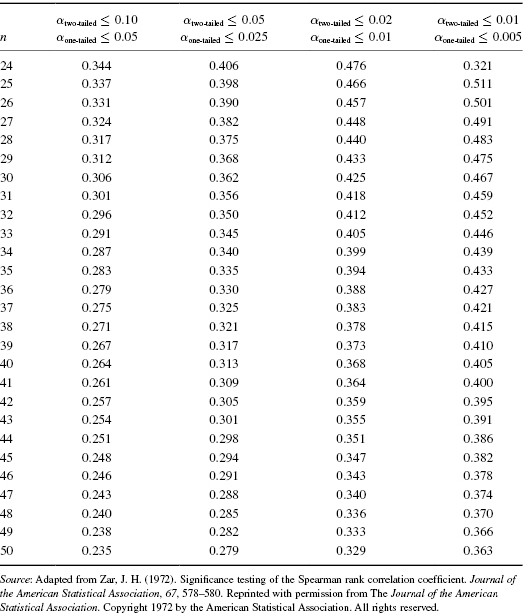
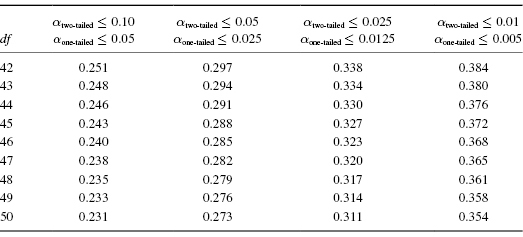
TABLE B.8 Critical Values for the Pearson Product-Moment Correlation Coefficient r.

| n | n! |
|---|---|
| 1 | 1 |
| 2 | 2 |
| 3 | 6 |
| 4 | 24 |
| 5 | 120 |
| 6 | 720 |
| 7 | 5040 |
| 8 | 40,320 |
| 9 | 362,880 |
| 10 | 3,628,800 |
| 11 | 39,916,800 |
| 12 | 479,001,600 |
| 13 | 6,227,020,800 |
| 14 | 87,178,291,200 |
| 15 | 1,307,674,368,000 |
| 16 | 20,922,789,888,000 |
| 17 | 355,687,428,096,000 |
| 18 | 6,402,373,705,728,000 |
| 19 | 121,645,100,408,832,000 |
| 20 | 2,432,902,008,176,640,000 |
| 21 | 51,090,942,171,709,440,000 |
| 22 | 1,124,000,727,777,607,680,000 |
| 23 | 25,852,016,738,884,976,640,000 |
| 24 | 620,448,401,733,239,439,360,000 |
| 25 | 15,511,210,043,330,985,984,000,000 |
TABLE B.10 Critical Values for the Runs Test for Randomness.
..................Content has been hidden....................
You can't read the all page of ebook, please click here login for view all page.