Chapter 8: Monitoring and Diagnosis
In this chapter, you will find recipes for some common monitoring and diagnosis actions that you will want to perform inside your database. They are meant to answer specific questions that you often face when using PostgreSQL.
In this chapter, we will cover the following recipes:
- Overview of PostgreSQL monitoring
- Cloud-native monitoring
- Providing PostgreSQL information to monitoring tools
- Real-time viewing using pgAdmin
- Checking whether a user is connected
- Checking whether a computer is connected
- Repeatedly executing a query in psql
- Checking which queries are running
- Monitoring the progress of commands and queries
- Checking which queries are active or blocked
- Knowing who is blocking a query
- Killing a specific session
- Detecting an in-doubt prepared transaction
- Knowing whether anybody is using a specific table
- Knowing when a table was last used
- Usage of disk space by temporary data
- Understanding why queries slow down
- Analyzing the real-time performance of your queries
- Investigating and reporting a bug
Overview of PostgreSQL monitoring
Databases are not isolated entities. They live on computer hardware using CPUs, RAM, and disk subsystems. Users access databases using networks. Depending on the setup, databases themselves may need network resources to function in any of the following ways: performing some authentication checks when users log in, using disks that are mounted over the network (not generally recommended), or making remote function calls to other databases.
This means that monitoring only the database is not enough. At a minimum, you should also monitor everything directly involved in using the database. This means knowing the following:
- Is the database host available? Does it accept connections?
- How much of the network bandwidth is in use? Have there been network interruptions and dropped connections?
- Is there enough RAM available for the most common tasks? How much of it is left?
- Is there enough disk space available? When will you run out of disk space?
- Is the disk subsystem keeping up? How much more load can it take?
- Can the CPU keep up with the load? How many spare idle cycles do the CPUs have?
- Are other network services the database access depends on (if any) available? For example, if you use Kerberos for authentication, you need to monitor it as well.
- How many context switches are happening when the database is running?
- For most of these things, you are interested in their history; that is, how have things evolved? Was everything mostly the same yesterday or last week?
- When did the disk usage start changing rapidly?
- For any larger installation, you probably have something already in place to monitor the health of your hosts and network.
The two aspects of monitoring are collecting historical data to see how things have evolved and getting alerts when things go seriously wrong.
Tools such as Munin or Prometheus are quite popular for collecting historical information on all aspects of the servers and presenting this information in an easy-to-follow graphical form. Grafana is a popular tool for this. Real-time monitoring can help when you're trying to figure out why the system is behaving the way it is.
Another aspect of monitoring is getting alerts when something goes wrong and needs (immediate) attention. For alerting, one of the most widely used tools is Icinga (a fork of Nagios), an established solution. The aforementioned trending tools can integrate with it. check_postgres is a popular Icinga plugin for monitoring many standard aspects of a PostgreSQL database server.
Icinga is a stable and mature solution based on the long-standing approach where each plugin decides whether a given measurement is a cause for alarm, which means that it's more complex to manage and maintain. A more recent tool is the aforementioned Prometheus, which is based on a design that separates data collection from the centralized alerting logic. This is covered in more detail next.
Cloud-native monitoring
Prometheus is the tool of choice from the Cloud Native Computing Foundation, so we'll discuss it here. Prometheus is an open source monitoring and alerting toolkit that allows multiple types of systems to feed it monitoring data. An open source Prometheus exporter is available for PostgreSQL, though this is not always needed. For example, EDB's Cloud Native Postgres Operator integrates a Prometheus exporter into the Kubernetes operator to provide better security and avoid the need for a separate component in your architecture.
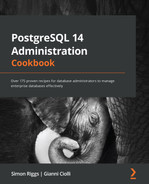
Data from Prometheus is displayed using Grafana. Data from Prometheus can also be stored inside a database and there are various options there for storing data inside PostgreSQL or other systems:
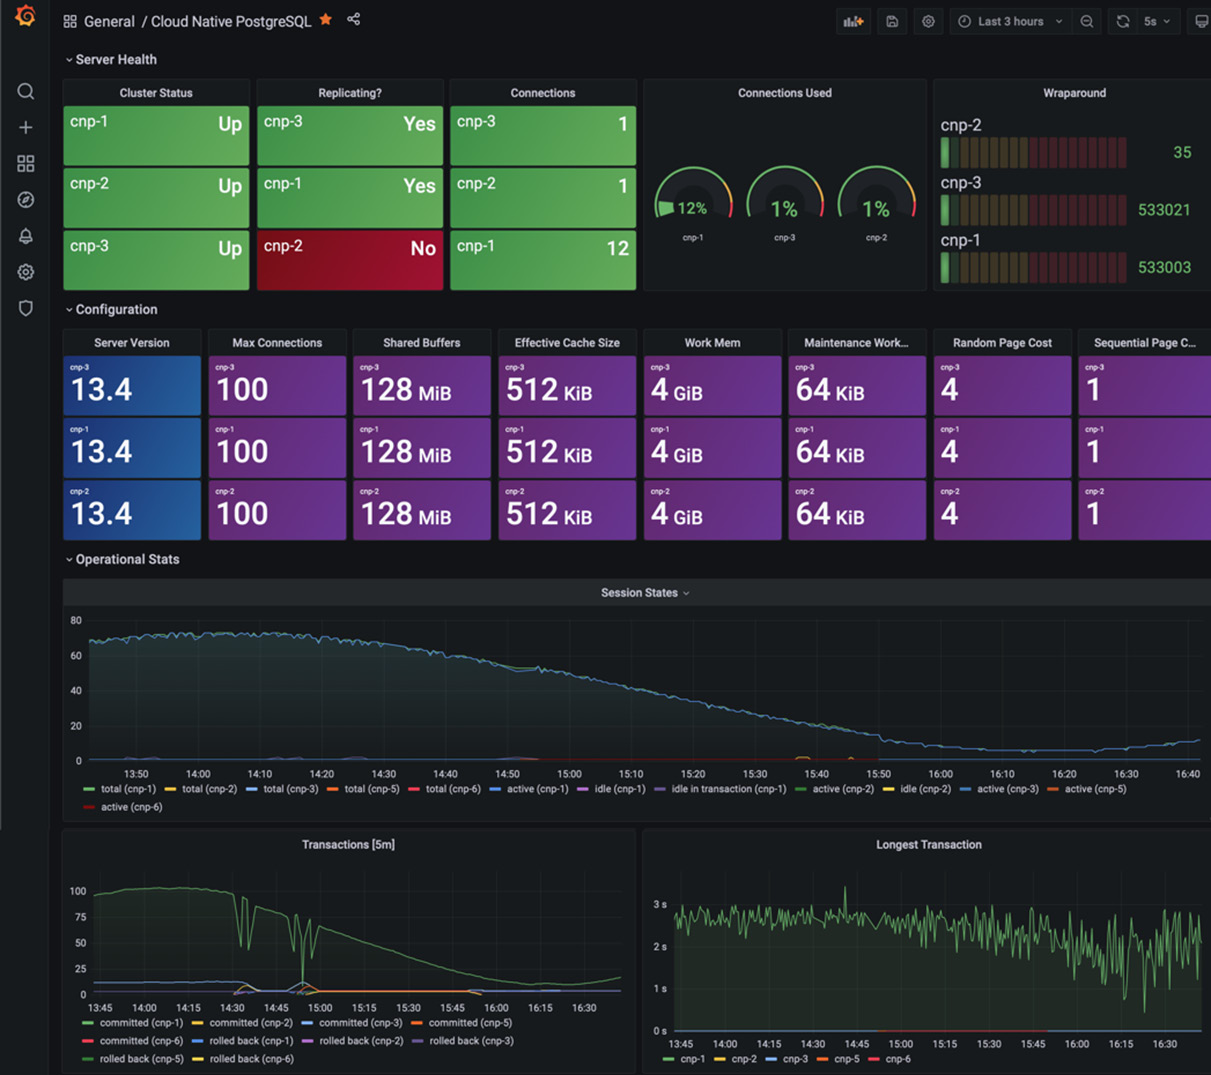
Figure 8.1 – Grafana view of PostgreSQL metrics
Remember that the key to successful monitoring is not the tool you use but what information you display with it.
Providing PostgreSQL information to monitoring tools
PostgreSQL exposes a huge amount of information for monitoring. To expose that information securely, make sure your user has the predefined (default) pg_monitor role, which will give you all you need. Some sources say to expose the full contents of pg_stat_activity and similar restricted views, but be careful how and when you do this. Monitoring is important but so is security.
It's best to use historical monitoring information when all of it is available from the same place and on the same timescale. Most monitoring systems are designed for generic purposes while allowing application and system developers to integrate their specific checks with the monitoring infrastructure. This is possible through a plugin architecture. Adding new kinds of data inputs to them means installing a plugin. Sometimes, you may need to write or develop this plugin, but writing a plugin for something such as Cacti is easy. You just have to write a script that outputs monitored values in simple text format.
In most common scenarios, the monitoring system is centralized and data is collected directly (and remotely) by the system itself or through some distributed components that are responsible for sending the observed metrics back to the main node.
As far as PostgreSQL is concerned, some useful things to include in graphs are the number of connections, disk usage, number of queries, number of WAL files, most numbers from pg_stat_user_tables and pg_stat_user_indexes, and so on. One Swiss Army knife script, which can be used from both Cacti and Nagios/Icinga, is check_postgres. It is available at https://bucardo.org/check_postgres/. It provides ready-made reporting actions for a large array of things that are worth monitoring in PostgreSQL.
For Munin, there are some PostgreSQL plugins available at the Munin plugin repository at https://github.com/munin-monitoring/contrib/tree/master/plugins/postgresql.
The following screenshot shows a Munin graph about PostgreSQL buffer cache hits for a specific database, where cache hits (the top/blue line) dominate reads from the disk (the bottom/green line, rarely above zero):
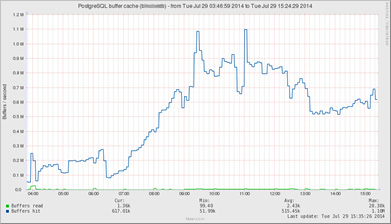
Figure 8.2 – Munin graph of buffer cache usage
Finding more information about generic monitoring tools
Setting up the tools themselves is a larger topic, and it is beyond the scope of this book. Each of these tools has more than one book written about them. The basic setup information and the tools themselves can be found at the following URLs:
- RRDtool: http://www.mrtg.org/rrdtool/
- Cacti: http://www.cacti.net/
- Icinga: https://icinga.com/
- Munin: http://munin-monitoring.org/
- Nagios: http://www.nagios.org/
- Zabbix: https://www.zabbix.com/
- Postgres Enterprise Manager: https://www.enterprisedb.com/docs/pem/latest/
Real-time viewing using pgAdmin
You can also use a GUI tool such as pgAdmin, which we discussed for the first time in Chapter 1, First Steps, to get a quick view of what is going on in the database.
Getting ready
pgAdmin4 no longer requires an extension to access PostgreSQL fully, so there is no need to install adminpack, as was required in earlier editions. If you use pgAdmin3, you may still want to install the adminpack extension in the destination database by issuing the following command:
CREATE EXTENSION adminpack;
This extension is a part of the additionally supplied modules of PostgreSQL (also known as contrib).
How to do it…
This section illustrates the pgAdmin tool.
Once you have connected to the database server, a window similar to the one shown in the following screenshot will be displayed, where you can see a general view, plus information about connections, overall activity, and running transactions:
Figure 8.3 – pgAdmin dashboard of live usage
Checking whether a user is connected
Here, we will show you how to learn whether a certain database user is currently connected to the database.
Getting ready
If you are logged in as a superuser, you will have full access to monitoring information.
How to do it…
Issue the following query to see whether the user bob is connected:
SELECT datname FROM pg_stat_activity WHERE usename = 'bob';
If this query returns any rows, then that means that bob is connected to the database. The returned value is the name of the database that the user is connected to.
How it works…
PostgreSQL's pg_stat_activity system view keeps track of all running PostgreSQL backends. This includes information such as the query that is being currently executed, or the last query that was executed by each backend, who is connected, when the connection, the transaction, and/or the query were started, and so on.
There's more…
Please spend a few minutes reading the PostgreSQL documentation, which contains more detailed information about pg_stat_activity, available at http://www.postgresql.org/docs/current/static/monitoring-stats.html - PG-STAT-ACTIVITY-VIEW.
You can find answers to many administration-related questions by analyzing the pg_stat_activity view. One common example is outlined in the following recipe.
Checking whether a computer is connected
Often, several different processes may connect as the same database user. In that case, you may want to know whether there is a connection from a specific computer.
How to do it…
You can get this information from the pg_stat_activity view as it includes the connected clients' IP address, port, and hostname (where applicable). The port is only needed if you have more than one connection from the same client computer and you need to do further digging to see which process there connects to which database. Run the following command:
SELECT datname, usename, client_addr, client_port,
application_name FROM pg_stat_activity
WHERE backend_type = 'client backend';
The client_addr and client_port parameters help you look up the exact computer and even the process on that computer that has connected to the specific database. You can also retrieve the hostname of the remote computer through the client_hostname option (this requires log_hostname to be set to on).
There's more…
I would always recommend including application_name in your reports. This field has become widely recognized and honored by third-party application developers (I advise you to do the same with your applications).
For information on how to set the application name for your connections, please refer to Database Connection Control Functions in the PostgreSQL documentation at http://www.postgresql.org/docs/current/static/libpq-connect.html.
Repeatedly executing a query in psql
Sometimes, we want to execute a query more than once, repeated at regular intervals; in this recipe, we will look at an interesting psql command that does exactly that.
How to do it…
The watch meta-command allows psql users to automatically (and continuously) re-execute a query. This behavior is similar to the watch utility of some Linux and Unix environments.
In the following example, we will run a simple query on pg_stat_activity and ask psql to repeat it every 5 seconds. You can exit at any time by pressing Ctrl + C:
gabriele=> SELECT count(*) FROM pg_stat_activity;
count
-------
1
(1 row)
gabriele=> watch 5
Watch every 5s Tue Aug 27 21:47:24 2013
count
-------
1
(1 row)
<snip>
There's more…
For further information about the psql utility, please refer to the PostgreSQL documentation at http://www.postgresql.org/docs/current/static/app-psql.html.
Checking which queries are running
In this section, we will show you how to check which query is currently running.
Getting ready
You must make sure that you are logged in as a superuser or as the same database user you want to check out. Also, ensure that the track_activities = on parameter is set (which it normally should be, being the default setting). If not, check the Updating the parameter file recipe in Chapter 3, Server Configuration.
How to do it…
To see which connected users are running at this moment, just run the following code:
SELECT datname, usename, state, backend_type, query
FROM pg_stat_activity;
This will show normal users as "client backend," but it will also show various PostgreSQL worker processes that you may not want to see. So, you could filter this using WHERE backend_type = 'client backend'.
On systems with a lot of users, you may notice that the majority of backends have state set to idle. This denotes that no query is running, and PostgreSQL is waiting for new commands from the user. The query field shows the statement that was last executed by that particular backend.
If, on the other hand, you are interested in active queries only, limit your selection to those records that have state set to active:
SELECT datname, usename, state, query
FROM pg_stat_activity
WHERE state = 'active'
AND backend_type = 'client backend';
How it works…
When track_activities = on is set, PostgreSQL collects data about all running queries. Users with sufficient rights can then view this data using the pg_stat_activity system view.
The pg_stat_activity view uses a system function named pg_stat_get_activity (procpid int). You can use this function directly to watch for the activity of a specific backend by supplying the process ID as an argument. Giving NULL as an argument returns information for all backends.
There's more…
Sometimes, you don't care about getting all the queries that are currently running. You may only be interested in seeing some of these, or you may not like connecting to the database just to see what is running.
Catching queries that only run for a few milliseconds
Since most queries on modern online transaction processing (OLTP) systems take only a few milliseconds to run, it is often hard to catch the active ones when you're simply probing the pg_stat_activity table.
Most likely, you will be able to only see the last executed query for those backends that have state different from active. In some cases, this can be enough.
In general, if you need to perform a deeper analysis, I strongly recommend installing and configuring the pg_stat_statements module, which is described in the Analyzing the real-time performance of your queries recipe in this chapter. Another option is to run a post-analysis of log files using pgBadger. Depending on the workload of your system, you may want to limit the production of highly granular log files (that is, log all queries) to a short period. For further information on pgBadger, refer to the Producing a daily summary of log file errors recipe of this chapter.
Watching the longest queries
Another point of interest that you may want to look for is long-running queries. To get a list of running queries ordered by how long they have been executing, use the following code:
SELECT
current_timestamp - query_start AS runtime,
datname, usename, query
FROM pg_stat_activity
WHERE state = 'active'
ORDER BY 1 DESC;
This will return currently running queries, with the longest-running queries in the front.
On busy systems, you may want to limit the set of queries that are returned to only the first few queries (add LIMIT 10 at the end) or only the queries that have been running over a certain period. For example, to get a list of queries that have been running for more than 1 minute, use the following query:
SELECT
current_timestamp - query_start AS runtime,
datname, usename, query
FROM pg_stat_activity
WHERE state = 'active'
AND current_timestamp - query_start > '1 min'
ORDER BY 1 DESC;
Watching queries from ps
If you want, you can also make queries that are running show up in process titles by setting the following configuration in the postgresql.conf file:
update_process_title = on
Although the ps and top outputs are not the best places for watching database queries, they may make sense in some circumstances.
See also
See PostgreSQL's online documentation, which covers the appropriate settings, at http://www.postgresql.org/docs/current/static/runtime-config-statistics.html.
Monitoring the progress of commands
PostgreSQL 14 now has a growing list of commands that have a "progress bar" – in other words, they provide information to show intermediate progress information for active commands.
Getting ready
Using the earlier recipes, identify the active processes that concern you:
SELECT pid, query
FROM pg_stat_activity
WHERE state = 'active';
If the query column indicates that they are one of the following actions, then we can look at detailed progress information for them:
- Maintenance commands: ANALYZE, VACUUM, VACUUM FULL/CLUSTER
- Index commands: CREATE INDEX, REINDEX
- Backup/replication: BASE BACKUP
- Data load/unload: COPY
At this time, SELECT statements don't provide detailed progress information.
How to do it…
Each type of command has specific progress information, so you must look in the view that's appropriate to the type of command.
All commands show a pid – the process identifier of the backend running the command.
For each command, consult the appropriate catalog view:
- ANALYZE: pg_stat_progress_analyze
- VACUUM: pg_stat_progress_vacuum
- VACUUM FULL, CLUSTER: pg_stat_progress_cluster
- CREATE INDEX, REINDEX: pg_stat_progress_create_index
- BASE BACKUP: pg_stat_progress_basebackup
- COPY: pg_stat_progress_copy
All types of command, apart from COPY, show a phase, since, in most cases, there are multiple steps involved in processing the command. Each type of command has a specific series of phases (or states) that it will pass through.
We will cover how to monitor and tune a VACUUM in Chapter 9, Regular Maintenance.
CREATE INDEX progress is more complex, especially if we are using CONCURRENTLY. The longest phase will be building index since it varies according to the size of the table. And for commands with the CONCURRENTLY option, there will also be long index validation phases, also varying according to the size of the table. At the end of builds with the CONCURRENTLY option, there will be one or more wait phases; if the command stays in this phase for too long, then it will be held up by other running processes, as shown in the current_locker_pid column.
For BASE BACKUP, the longest phase is streaming database files. The backup progress so far is backup_streamed bytes, so the % progress will be as follows:
SELECT pid, phase,
100.0*((backup_streamed*1.0)/backup_total) AS "progress%"
FROM pg_stat_progress_basebackup;
Although COPY doesn't show the phase, we can calculate the % progress like this:
- COPY FROM % progress will be as follows:
SELECT (SELECT relname FROM pg_class WHERE oid = relid),
100.0*((bytes_processed*1.0)/bytes_total) AS "progress%"
FROM pg_stat_progress_copy;
- COPY TO % progress will be as follows:
SELECT relname,
100.0*((tuples_processed*1.0)/(case reltuples WHEN 0 THEN 10 WHEN -1 THEN 10 ELSE reltuples END)) AS "progress%"
FROM pg_stat_progress_copy JOIN pg_class on oid = relid;
All types of commands, apart from BASE BACKUP, show the datid and datname columns, which show the database ID and name, respectively. BASE BACKUP refers to the whole database server, including all databases.
How it works…
When commands run, they update in-memory progress information. By accessing the catalog views, we can see that intermediate progress information.
There's more…
More information is added in each new release, so expect this area to change quickly over time.
Checking which queries are active or blocked
Here, we will show you how to find out whether a query is running or waiting for another query.
Getting ready
Using the predefined (default) pg_monitor role, you will have full access to monitoring information.
How to do it…
Follow these steps to check if a query is waiting for another query:
- Run the following query:
SELECT datname, usename, wait_event_type, wait_event, backend_type, query
FROM pg_stat_activity
WHERE wait_event_type IS NOT NULL
AND wait_event_type NOT IN ('Activity', 'Client');
- You will receive the following output:
-[ RECORD 1 ]---+-----------------
datname | postgres
usename | gianni
wait_event_type | Lock
wait_event | relation
backend_type | client backend
query | select * from t;
How it works…
The pg_stat_activity system view includes the wait_event_type and wait_event columns, which are set to the kind of wait and to the kind of object that is blocked, respectively. The backend_type column indicates the type of current backend.
The preceding query uses the wait_event_type field to filter out only those queries that are waiting.
There's more…
PostgreSQL provides a version of the pg_stat_activity view that's capable of capturing many kinds of waits; however, in previous versions, pg_stat_activity could only detect waits on locks such as those placed on SQL objects, via the pg_stat_activity.waiting field.
Although this is the main cause of waiting when using pure SQL, it is possible to write a query in any of PostgreSQL's embedded languages that can wait on other system resources, such as waiting for an HTTP response, for a file write to get completed, or just waiting on a timer.
As an example, you can make your backend sleep for a certain number of seconds using pg_sleep(seconds). While you are monitoring pg_stat_activity, open a new Terminal session with psql and run the following statement in it:
db=# SELECT pg_sleep(10);
<it "stops" for 10 seconds here>
pg_sleep
----------
(1 row)
In older versions of Postgres, it will show up as not waiting in the pg_stat_activity view, even though the query is blocked in the timer.
You will see the following output with newer versions of Postgres where wait_event_type is Timeout, where the server process is waiting for a timeout to expire and wait_event is PgSleep, waiting for a process that called pg_sleep:
-[ RECORD 1 ]---+---------------------
datname | postgres
usename | postgres
wait_event_type | Timeout
wait_event | PgSleep
backend_type | client backend
query | SELECT pg_sleep(10);
Knowing who is blocking a query
Once you have found out that a query is being blocked, you need to know who or what is blocking it.
Getting ready
If you are logged in as a superuser, you will have full access to monitoring information.
How to do it…
Perform the following steps:
- Write the following query:
SELECT datname, usename, wait_event_type, wait_event, pg_blocking_pids(pid) AS blocked_by, backend_type, query
FROM pg_stat_activity
WHERE wait_event_type IS NOT NULL
AND wait_event_type NOT IN ('Activity', 'Client');
- You will receive the following output:
-[ RECORD 1 ]---+-----------------
datname | postgres
usename | gianni
wait_event_type | Lock
wait_event | relation
blocked_by | {18142}
backend_type | client backend
query | select * from t;
This is the query we described in the previous recipe, with the addition of the blocked_by column. Recall that the PID is the unique identifier that's assigned by the operating system to each session; for more details, see Chapter 4, Server Control. Here, the PID is used by the pg_blocking_pids(pid) system function to identify blocking sessions.
How it works…
The query is relatively simple: we just introduced the pg_blocking_pids() function, which returns an array composed of the PIDs of all the sessions that were blocking the session with the given PID.
Parallel queries lock via the leader process, so they do not complicate how we monitor locks.
Killing a specific session
Sometimes, the only way to let the system continue as a whole is by surgically terminating some offending database sessions. Yes, you read that right: surgically.
In this recipe, you will learn how to intervene, from gracefully canceling a query to brutally killing the actual process from the command line.
How to do it…
Once you have figured out the backend you need to kill, try to use pg_cancel_backend(pid), which cancels the current query, though only if there is one. This can be executed by anyone who is a member of the role whose backend is being canceled.
If that is not enough, then you can use pg_terminate_backend(pid), which kills the backend. This works even for client backends that are idle or idle in a transaction.
You can run these functions as a superuser, or if the calling role is a member of the role whose backend pid is being signed (look for the usename field in the pg_stat_activity view).
You can also grant pg_signal_backend privilege to users to allow this on any user. However, only superusers can cancel superuser backends.
How it works…
When a backend executes these functions, it verifies that the process that's been identified by the pid argument is a PostgreSQL backend. Once we know that, it sends a signal to the process. The backend receiving this signal stops whatever it is doing at the next suitable point in time and terminates it in a controlled way.
If the session is terminated, the client using that backend loses the connection to the database. Depending on how the client application is written, it may silently reconnect, or it may report the error to the user.
There's more…
Killing the session may not always be what you want, so you should consider other options as well.
It may also be a good idea to look at the Server Signaling Functions section in the PostgreSQL documentation at http://www.postgresql.org/docs/current/static/functions-admin.html#FUNCTIONS-ADMIN-SIGNAL.
Using statement_timeout to clean up queries that take too long to run
Often, you know that you don't have any use for queries that run longer than a given time. Maybe your web frontend just refuses to wait for more than 10 seconds for a query to complete and returns a default answer to users if it takes longer, abandoning the query.
In such a case, it may be a good idea to set statement_timeout = 10s, either in postgresql.conf or as a per-user or per-database setting. Once you do so, queries that are running for too long won't consume precious resources and make other queries fail.
The queries that are terminated by a statement timeout show up in the log, as follows:
postgres=# SET statement_timeout TO '3 s';
SET
postgres=# SELECT pg_sleep(10);
ERROR: canceling statement due to statement timeout
Killing idle in-transaction sessions
Sometimes, people start a transaction, run some queries, and then just leave, without ending the transaction. This can leave some system resources in a state where some housekeeping processes can't be run. They may even have done something more serious, such as locking a table, thereby causing an immediate denial of service for other users who need that table.
You can use the following query to kill all backends that have an open transaction but have been doing nothing for the last 10 minutes:
SELECT pg_terminate_backend(pid)
FROM pg_stat_activity
WHERE state = 'idle in transaction'
AND current_timestamp – state_change > '10 min';
You can even schedule this to run every minute while you are trying to find the specific frontend application that ignores open transactions, or when you have a lazy administration that leaves a psql connection open, or when a flaky network drops clients without the server noticing it.
Detecting an in-doubt prepared transaction
While using a two-phase commit (2PC), you may end up in a situation where you have something locked but cannot find the backend that holds the locks. This recipe describes how to detect such a case.
How to do it…
Perform the following steps:
- You need to look up the pg_locks table for those entries with an empty pid value. Run the following query:
SELECT t.schemaname || '.' || t.relname AS tablename,
l.pid, l.granted
FROM pg_locks l JOIN pg_stat_user_tables t
ON l.relation = t.relid;
- The output will be something similar to the following:
tablename | pid | granted
-----------+-------+---------
db.x | | t
db.x | 27289 | f
(2 rows)
The preceding example shows a lock on the db.x table, which has no process associated with it.
If you need to remove a particular prepared transaction, you can refer to the Removing old prepared transactions recipe in Chapter 9, Regular Maintenance.
Knowing whether anybody is using a specific table
This recipe will help you when you are in doubt about whether an obscure table is being used anymore, or if it has been left over from past use and is just taking up space.
Getting ready
Make sure that you are a superuser, or at least have full rights to the table in question.
How to do it…
Perform the following steps:
- To see whether a table is currently in active use (that is, whether anyone is using it while you are watching it), run the following query on the database you plan to inspect:
CREATE TEMPORARY TABLE tmp_stat_user_tables AS
SELECT * FROM pg_stat_user_tables;
- Then, wait for a while and see what has changed:
SELECT * FROM pg_stat_user_tables n
JOIN tmp_stat_user_tables t
ON n.relid=t.relid
AND (n.seq_scan,n.idx_scan,n.n_tup_ins,n.n_tup_upd,n.n_tup_del)
<> (t.seq_scan,t.idx_scan,t.n_tup_ins,t.n_tup_upd,t.n_tup_del);
How it works…
The pg_stat_user_tables view shows the current statistics for table usage.
To see whether a table is being used, you can check for changes in its usage counts.
The previous query selects all the tables where any of the usage counts for SELECT or data manipulation have changed.
There's more...
There is a function called pg_stat_reset() that drops a bomb on all usage statistics! This is NOT recommended because these statistics are used by autovacuum.
It is often useful to have historical usage statistics for tables when you're trying to solve performance problems or understand usage patterns.
Various tools are available, such as EnterpriseDB's Postgres Enterprise Manager (PEM): https://www.enterprisedb.com/products/postgres-enterprise-manager-best-gui-tools-database-management.
You can also collect the data yourself using a table like this:
CREATE TABLE backup_stat_user_tables AS
SELECT current_timestamp AS snaptime,*
FROM pg_stat_user_tables
WITH NO DATA;
Then, using either a cron or a PostgreSQL-specific scheduler such as pg_agent, you can execute the following query, which adds a snapshot of current usage statistics with a timestamp:
INSERT INTO backup_stat_user_tables
SELECT current_timestamp AS snaptime,*
FROM pg_stat_user_tables;
Knowing when a table was last used
Once you know that a table is not currently being used, the next question is, When was it last used?
Getting ready
You need to use a user with appropriate privileges.
How to do it…
PostgreSQL does not have any built-in last used information about tables, so you have to use other means to figure it out.
If you have set up a cron job to collect usage statistics, as described in the previous chapter, then it is relatively easy to find out the last date of change using a SQL query.
Other than this, there are two possibilities, neither of which give you reliable answers.
You can either look at the actual timestamps of the files that the data is stored in, or you can use the xmin and xmax system columns to find out the latest transaction ID that changed the table data.
In this recipe, we will cover the first case and focus on the date information in the table's files.
The following PL/pgSQL function looks for the table's data files to get the value of their last access and modification times:
CREATE OR REPLACE FUNCTION table_file_access_info(
IN schemaname text, IN tablename text,
OUT last_access timestamp with time zone,
OUT last_change timestamp with time zone
) LANGUAGE plpgsql AS $func$
DECLARE
tabledir text;
filenode text;
BEGIN
SELECT regexp_replace(
current_setting('data_directory') || '/' || pg_relation_filepath(c.oid),
pg_relation_filenode(c.oid) || '$', ''),
pg_relation_filenode(c.oid)
INTO tabledir, filenode
FROM pg_class c
JOIN pg_namespace ns
ON c.relnamespace = ns.oid
AND c.relname = tablename
AND ns.nspname = schemaname;
RAISE NOTICE 'tabledir: % - filenode: %', tabledir, filenode;
-- find latest access and modification times over all segments
SELECT max((pg_stat_file(tabledir || filename)).access),
max((pg_stat_file(tabledir || filename)).modification)
INTO last_access, last_change
FROM pg_ls_dir(tabledir) AS filename
-- only use files matching <basefilename>[.segmentnumber]
WHERE filename ~ ('^' || filenode || '([.]?[0-9]+)?$');
END;
$func$;
postgres=# select * from table_file_access_info('public','job_status');
NOTICE: tabledir: /Library/PostgreSQL/14/data/base/13329/ - filenode: 169733
last_access | last_change
---------------------------+---------------------------
2019-04-19 22:42:00+05:30 | 2019-04-19 09:36:40+05:30
How it works...
The table_file_access_info(schemaname, tablename) function returns the last access and modification times for a given table, using the filesystem as a source of information.
The last query uses this data to get the latest time any of these files were modified or read by PostgreSQL. Beware that this is not a very reliable way to get information about the latest use of any table, but it gives you a rough upper-limit estimate of when it was last modified or read (for example, consider the autovacuum process for accessing a table).
There's more…
Recently, there have been discussions about adding last-used data to the information about tables that PostgreSQL keeps, so it is quite possible that answering the question when did anybody last use this table? will be much easier in the next version of PostgreSQL.
Usage of disk space by temporary data
In addition to ordinary persistent tables, you can also create temporary tables. Temporary tables have disk files for their data, just as persistent tables do, but those files will be stored in one of the tablespaces listed in the temp_tablespaces parameter or, if not set, the default tablespace.
PostgreSQL may also use temporary files for query processing for sorts, hash joins, or hold cursors if they are larger than your current work_mem parameter setting.
So, how do you find out how much data is being used by temporary tables and files? You can do this by using any untrusted embedded language, or directly on the database host.
Getting ready
You have to use an untrusted language because trusted languages run in a sandbox, which prohibits them from directly accessing the host filesystem.
How to do it…
Perform the following steps:
- First, check whether your database defines special tablespaces for temporary files, as follows:
SELECT current_setting('temp_tablespaces');
- As explained later on in this recipe, if the setting is empty, this means that PostgreSQL is not using temporary tablespaces, and temporary objects will be located in the default tablespace for each database.
- On the other hand, if temp_tablespaces has one or more tablespaces, then your task is easy because all temporary files, both those used for temporary tables and those used for query processing, are inside the directories of these tablespaces. The following query (which uses WITH queries and string and array functions) demonstrates how to check the space that's being used by temporary tablespaces:
WITH temporary_tablespaces AS (SELECT
unnest(string_to_array(
current_setting('temp_tablespaces'), ',')
) AS temp_tablespace
)
SELECT tt.temp_tablespace,
pg_tablespace_location(t.oid) AS location,
pg_tablespace_size(t.oid) AS size
FROM temporary_tablespaces tt
JOIN pg_tablespace t ON t.spcname = tt.temp_tablespace
ORDER BY 1;
The following output shows very limited use of temporary space (I ran the preceding query while I had two open transactions that had just created small, temporary tables using random data through generate_series()):
temp_tablespace | location | size
-----------------+--------------+---------
pgtemp1 | /srv/pgtemp1 | 3633152
pgtemp2 | /srv/pgtemp2 | 376832
(2 rows)
Even though you can obtain similar results using different queries, or just by checking the disk usage from the filesystem through du (once you know the location of tablespaces), I would like to focus on these functions:
- pg_tablespace_location(oid): This provides the location of the tablespace with the given oid.
- pg_tablespace_size(oid) or pg_tablespace_size(name): This allows you to check the size being used by a named tablespace directly within PostgreSQL.
- In PostgreSQL 12+, you can use pg_ls_tmpdir(oid) to view the file's names, sizes, and last modification time, to allow you to see full details of the temporary file's location(s).
Because the amount of temporary disk space being used can vary a lot in an active system, you may want to repeat the query several times to get a better picture of how the disk usage changes. (With psql, use watch, as explained in the Checking whether a user is connected recipe.)
Note
Further information on these functions can be found at http://www.postgresql.org/docs/current/static/functions-admin.html.
On the other hand, if the temp_tablespaces setting is empty, then the temporary tables are stored in the same directory as ordinary tables, and the temporary files that are used for query processing are stored in the pgsql_tmp directory inside the main database directory.
Look up the cluster's home directory using the following query:
SELECT current_setting('data_directory') || '/base/pgsql_tmp'
The size of this directory gives us the total size of current temporary files for query processing.
The total size of the temporary files that are used by a database can be found in the pg_stat_database system view, and specifically in the temp_files and temp_bytes fields. These values are cumulative numbers, not current usage, so expect them to increase over time. The following query returns the cumulative number of temporary files and the space being used by every database since the last reset (stats_reset):
SELECT datname, temp_files, temp_bytes, stats_reset
FROM pg_stat_database
WHERE datname is not null;
The pg_stat_database view holds very important statistics. I recommend that you look at the official documentation at http://www.postgresql.org/docs/current/static/monitoring-stats.html#PG-STAT-DATABASE-VIEW for detailed information and to get further ideas on how to improve your monitoring skills.
How it works…
Because all temporary tables and other, larger temporary on-disk data are stored in files, you can use PostgreSQL's internal tables to find the locations of these files, and then determine the total size of these files.
You can control the max file size by setting the temp_file_limit parameter, which is unset by default, noting that this is the total amount of all temporary files, not a limit on just one temporary table. Note that this imposes a limit on all types of temporary files used by queries.
There's more…
While the preceding information about temporary tables is correct, it is not the entire story.
Finding out whether a temporary file is in use anymore
Because temporary files are not as carefully preserved as ordinary tables (this is one of the benefits of temporary tables, as less bookkeeping makes them faster), it may sometimes happen that a system crash leaves a few temporary files, which can (in the worst case) take up a significant amount of disk space. In PostgreSQL 14+, temporary files are removed at restart with the default setting of the remove_temp_files_after_crash = on parameter. In earlier releases, you may need to clean up such files by shutting down the PostgreSQL server and then deleting all files from the pgsql_tmp directory, while the database is shut down.
Logging temporary file usage
If you set log_temp_files = 0 or a larger value, then the creation of all temporary files that are larger than this value in kilobytes is logged to the standard PostgreSQL log.
If, while monitoring the log and the pg_stat_database view, you notice an increase in temporary file activity, you should consider increasing work_mem, either globally or (preferably) on a query/session basis. While temporary files don't get synced to disk, they do cause file I/O.
Understanding why queries slow down
In production environments with large databases and high concurrent access, it might happen that queries that used to run in tens of milliseconds suddenly take several seconds.
Likewise, a summary query for a report that used to run in a few seconds may take half an hour to complete.
Here are some ways to find out what is slowing them down.
Getting ready
Any questions of the type why is this different today from what it was last week? are much easier to answer if you have some kind of historical data collection setup.
The tools we mentioned in the Providing PostgreSQL information recipe that can be used to monitor general server characteristics, such as CPU and RAM usage, disk I/O, network traffic, load average, and so on are very useful for seeing what has changed recently, and for trying to correlate these changes with the observed performance of some database operations.
Also, collecting historical statistics data from pg_stat_* tables, whether daily, hourly, or even every 5 minutes if you have enough disk space, is very useful for detecting possible causes of sudden changes or a gradual degradation in performance.
If you are gathering both of these, then that's even better. If you have none, then the question is actually: Why is this query slow?
But don't despair! There are a few things you can do to try to restore performance.
How to do it…
First, analyze your database tables using the following code, for all the tables in your slow query:
db_01=# analyze my_table;
ANALYZE
Time: 6231.313 ms
db_01=#
This is the first thing you should try as it is usually cheap and is meant to be done quite often anyway. Don't run it on the whole database since that is probably overkill and could take some time.
If this restores the query's performance or at least improves the current performance considerably, then this means that autovacuum is not doing its task well, and the next thing to do is find out why.
You must ensure that the performance improvement is not due to caching the pages that are required by the requested query. Make sure that you repeat your query several times before classifying it as slow. Looking at pg_stat_statements (which will be covered later in this chapter) can help you analyze the impact of a particular query in terms of caching, and is done by inspecting two fields: shared_blks_hit and shared_blks_read.
How it works…
The ANALYZE command updates statistics about data size and data distribution in all tables. If a table's size has changed significantly without its statistics being updated, then PostgreSQL's statistics-based optimizer may choose a bad plan. Manually running the ANALYZE command updates the statistics for all tables.
There's more…
There are a few other common problems.
Do queries return significantly more data than they did earlier?
If you've initially tested your queries on almost empty tables, you may be querying much more data than you need.
As an example, if you select all users' items and then show the first 10 items, this query runs very fast when the user has 10 or even 50 items, but not so well when they have 50,000.
Ensure that you don't ask for more data than you need. Use the LIMIT clause to return less data to your application (and to give the optimizer at least a chance to select a plan that processes less data when selecting: it may also have a lower startup cost). In some cases, you can evaluate the use of cursors for your applications.
Do queries also run slowly when they run alone?
If you can, then try to run the same slow query when the database has no (or very few) other queries running concurrently. If it runs well in this situation, then it may be that the database host is just overloaded (CPU, memory, or disk I/O) or other applications are interfering with PostgreSQL on the same server. Consequently, a plan that works well under a light load is not very good anymore. It may even be that this is not a very good query plan to begin with, and you were fooled by modern computers being fast:
db=# select count(*) from t;
count
---------
1000000
(1 row)
Time: 329.743 ms
As you can see, scanning 1 million rows takes just 0.3 seconds on a laptop that is a few years old if these rows have already been cached.
However, if you have a few such queries running in parallel, and also other queries competing for memory, this query is likely to slow down an order of magnitude or two.
See Chapter 10, Performance and Concurrency, for general advice on performance tuning.
Is the second run of the same query also slow?
This test is related to the previous test, and it checks whether the slowdown is caused by some of the necessary data not fitting into the memory or because it's being pushed out of memory by other queries.
If the second run of the query is fast, then you probably lack enough memory. Again, see Chapter 10, Performance and Concurrency, for details about this.
Table and index bloat
Table bloat is something that can develop over time if some maintenance processes can't be run properly. In other words, due to the way Multiversion Concurrency Control (MVCC) works, your table will contain a lot of older versions of rows, if these versions can't be removed promptly.
There are several ways this can develop, but all involve lots of updates or deletes and inserts, while autovacuum is prevented from doing its job of getting rid of old tuples. It is possible that, even after the old versions are cleaned up, the table stays at its newly acquired and large size, thanks to visible rows being located at the end of the table and preventing PostgreSQL from shrinking the file. There have been cases where a one-row table has grown to several gigabytes in size.
If you suspect that some tables may be bloated, then run the following query:
SELECT pg_relation_size(relid) AS tablesize,schemaname,relname,n_live_tup
FROM pg_stat_user_tables
WHERE relname = <tablename>;
Then, see whether the relationship between tablesize to n_live_tup makes sense. You may also think you need to look at n_dead_tup, but even after dead tuples are removed, the bloat they have caused will still be there.
For example, if the table size is tens of megabytes, and there are only a small number of rows, then you have bloat, and proper VACUUM strategies are necessary (as explained in Chapter 9, Regular Maintenance).
It is important to check that the statistics are up to date. You may need to run ANALYSE on the table and run the query again.
See also
The following will aid your understanding of this topic:
- The Collecting daily usage statistics section shows one way to collect information on table changes.
- Chapter 9, Regular Maintenance.
- Chapter 10, Performance and Concurrency.
- The How many rows in a table? recipe in Chapter 2, Exploring the Database, for an introduction to MVCC.
- The auto_explain contrib module, at http://www.postgresql.org/docs/current/static/auto-explain.html.
Analyzing the real-time performance of your queries
The pg_stat_statements extension adds the capability to track the execution statistics of queries that are run in a database, including the number of calls, total execution time, the total number of returned rows, and internal information on memory and I/O access.
It is evident how this approach opens up new opportunities in PostgreSQL performance analysis by allowing database admins to get insights directly from the database through SQL and in real time.
Getting ready
The pg_stat_statements module is available as a contrib module of PostgreSQL. The extension must be installed as a superuser in the desired databases. It also requires administrators to add the library to the postgresql.conf file, as follows:
shared_preload_libraries = 'pg_stat_statements'
This change requires restarting the PostgreSQL server.
Finally, to use it, the extension must be installed in the desired database through the usual CREATE EXTENSION command (run as a superuser):
gabriele=# CREATE EXTENSION pg_stat_statements;
CREATE EXTENSION
How to do it…
Connect to a database where you have installed the pg_stat_statements extension, preferably as a superuser.
You can start by retrieving a list of the top 10 most frequent queries:
SELECT query FROM pg_stat_statements ORDER BY calls DESC LIMIT 10;
Alternatively, you can retrieve the queries with the highest average execution time:
SELECT query, total_exec_time/calls AS avg, calls
FROM pg_stat_statements ORDER BY 2 DESC;
These are just examples. I strongly recommend that you look at the PostgreSQL documentation at http://www.postgresql.org/docs/current/static/pgstatstatements.html for more detailed information on the structure of the pg_stat_statements view.
How it works…
Since the pg_stat_statements shared library has been loaded by the PostgreSQL server, Postgres starts collecting statistics for every database in the instance.
The extension simply installs the pg_stat_statements view and the pg_stat_statements_reset() function in the current database, allowing the database admin to inspect the available statistics.
By default, read access to the pg_stat_statements view is granted to every user who can access the database (even though standard users are only allowed to see the SQL statements of their queries).
The pg_stat_statements_reset() function can be used to discard the statistics that have been collected by the server up to that moment and set all the counters to 0. It requires a superuser to be run.
There's more…
A very important pg_stat_statements feature is normalizing queries that can be planned (SELECT, INSERT, DELETE, and UPDATE). You may have noticed some ? characters in the query field being returned by the queries we outlined in the previous section. The normalization process intercepts constants in SQL statements run by users and replaces them with a placeholder (identified by a question mark).
Consider the following queries:
SELECT * FROM bands WHERE name = 'AC/DC';
SELECT * FROM bands WHERE name = 'Lynyrd Skynyrd';
After the normalization process, these two queries appear as one in pg_stat_statements:
gabriele=# SELECT query, calls FROM pg_stat_statements;
query | calls
---------------------------------------+-------
SELECT * FROM bands WHERE name = ?; | 2
The extension comes with a few configuration options, such as the maximum number of queries to be tracked.
Investigating and reporting a bug
When you find out that PostgreSQL is not doing what it should, then it's time to investigate.
Getting ready
It is a good idea to make a full copy of your PostgreSQL installation before you start investigating. This will help you restart several times and be sure that you are investigating the results of the bug, and not chasing your tail by looking at changes that were introduced by your last investigation and debugging attempt.
Do not forget to include your tablespaces in the full copy.
How to do it…
Try to make a minimal repeatable test scenario that exhibits this bug. Sometimes, the bug disappears while doing this, but mostly, it is needed to make the process easy. It is almost impossible to fix a bug that you can't observe and repeat at will.
If it is about query processing, then you can usually provide a minimal dump file (the result of running pg_dump) of the specific tables, together with a SQL script that exhibits the error.
If you have corrupt data, then you may want to make a subset of the corrupted data files available for people who have the knowledge and time to look at it. Sometimes, you can find such people on the PostgreSQL hackers' list, while other times, you will have to hire someone or even fix it yourself. The more preparatory work you do yourself and the better you formulate your questions, the higher the chance you have of finding help quickly.
When reporting a bug, always include at least the PostgreSQL version you are using and the operating system that you are using it on.
More detailed information on this process is available on the PostgreSQL wiki. By following the official recommendations at http://wiki.postgresql.org/wiki/Guide_to_reporting_problems, you will have a higher chance of getting your questions answered.
How it works…
If everything works well, then the following process should take a week or two:
- A user submits a well-researched bug report to the PostgreSQL hackers' list.
- Some discussions follow on the list, and the user may be asked to provide some additional information.
- Somebody finds out what is wrong and proposes a fix.
- The fix is discussed on the hackers' list.
- The bug is fixed. There is a patch for the current version, and the fix is sure to be included in the next version.
- Sometimes, the fix is backported to older versions.
Unfortunately, any step may go wrong due to various reasons, such as nobody feeling that this is their area of expertise, the right people not having time and hoping for someone else to deal with it, and these other people not reading the list at the right moment. If this happens, follow up on your question in a day or two to try and understand why there was no reaction.
For guaranteed response times to support queries, you should consider engaging with a specialist PostgreSQL support provider such as EDB: http://www.enterprisedb.com/. Other companies also offer support, but make sure to choose one that actively makes significant contributions to PostgreSQL, because that is what pays for the development of open source and makes the whole process "sustainable." Check their credentials!