
C H A P T E R 6
Interlude: Home Engineering from Requirements to Implementation
In this chapter, we are going to take a little break from the usual scheme of things so you can learn about various sensors and how to use them in your projects. We will use several new pieces of hardware: photoresistors and tilt, flex, FSR (force sensitive resistor), digital temperature and humidity, and temperature sensors. We will also use two new libraries to communicate with the temperature and humidity sensors: DHT22 (thanks to nethoncho) and the Wire library (thanks to the Arduino development team). These are all key parts in completing our hypothetical customer's request for a wireless temperature monitor that uses Bluetooth communication.
![]() Note We will be using two different temperature sensors in this chapter so that you can learn more about I2C circuits and how to use them.
Note We will be using two different temperature sensors in this chapter so that you can learn more about I2C circuits and how to use them.
We'll start by discussing some of the math we need to use a voltage divider circuit. We'll then turn our attention to each sensor and both libraries. After we have a better understanding of the sensors, we will be doing several projects that utilize each one of the sensors.
Understanding the Voltage Divider
When using a voltage divider, you may have to figure out what values you need for the resistors. Say we want to find voltage on a 6V battery; this can be done with a voltage divider. See Figure 6-1.
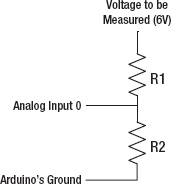
Figure 6-1. Voltage divider circuit
The first step is to make sure you do not use a ton of amps from the battery. We will use 100uA, and the voltage out will be 4V. Now that we have these values, we can figure out the total resistance of our voltage divider by using Ohm's Law.
RT = 6V/100uA
RT = 60kohms
Next, we need to solve for R2 as follows:
R2 = (voltage out/voltage in) * Total Resistance
R2 = (4V/6V) * 60kohms
R2 = 40kohms
Now that we have the value of R2, we can find R1 using this equation:
R1 = RT – R2
R1 = 60kohms – 40kohms
R1 = 20kohms
This should get you started on using a voltage divider. We will be using voltage dividers extensively in this chapter to scale sensors to the analog input pins. For additional information on voltage dividers, please see http://en.wikipedia.org/wiki/Voltage_Divider. The next section will discuss the new hardware in this chapter.
Hardware Explained: Sensors
Throughout this chapter, we will be using sensors on the Arduino so that it can recognize its surroundings. Many sensors are available today, but we will focus on only a few of them: photoresistors, and the tilt, flex, force sensitive resistor (FSR), digital temperature and humidity, and digital temperature sensors. The next few sections will discuss each of these sensors and how they achieve their abilities to understand their surroundings.
Photoresistor
A photoresistor (see Figure 6-2) gets it resistance from the sun. If it is dark, the sensor will read up in the millions of Ohms, but as light is shined at it, it will have a lower resistance. This sensor requires a voltage divider to get a correct signal.
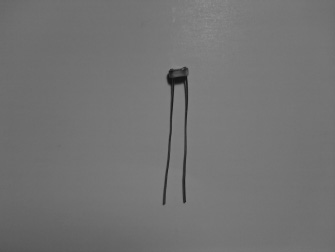
Figure 6-2. Photoresistor
Tilt Sensor
The tilt sensor (see Figure 6-3) is used to check whether or not something is level. It has a small metal ball inside the cap; when it is tilted, the ball connects with the outer cylinder and sends HIGH to the Arduino (or any other microcontroller). This sensor acts like a switch and requires a pull-up resistor.
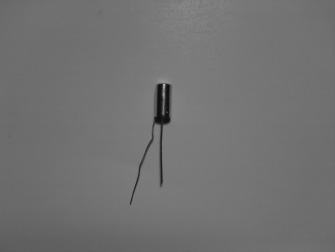
Figure 6-3. Tilt sensor
Flex Sensor
The flex sensor, as the name says, will tell you how much something is bending. This sensor is a large resistor, and when it is flat, it is at 25kohms, and when it is fully bent, it will go up to 125kohms. You need to use a voltage divider with this sensor to get a correct reading from the analog inputs on the Arduino. Figure 6-4 shows the flex sensor.

Figure 6-4. Flex sensor
Force Sensitive Resistor (FSR)
The FSR sensor (shown in Figure 6-5) can detect force applied to it. It also is a large resistor and will go past 1Mohm when it is not being pressed. The FSR I am using has limits of 100g and 10kg. You need a voltage divider to get connect data from the analog inputs on the Arduino for this sensor as well.
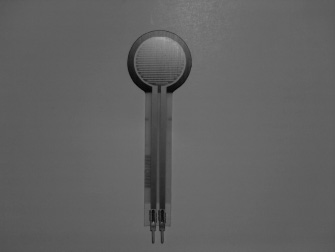
Figure 6-5. Force sensitive resistor (FSR)
Digital Temperature and Humidity Sensor
The DHT22 sensor shown in Figure 6-6 can detect temperature (C and F) and humidity. It has everything it requires built into it, so it will work very well with the Arduino. This sensor is used in conjunction with the DHT22 Library (which will be discussed later in this chapter).

Figure 6-6. Temperature and humidity sensor
Digital Temperature Sensor (I2C)
We will use the inter-integrated circuits (I2C) digital temperature sensor in the final project; this sensor has a very high resolution, so it is very accurate. It sensor requires us to use the Wire library (which will be discussed later in this chapter) to communicate with it. Figure 6-7 illustrates the digital temperature sensor. Since this sensor is a bit more complicated than the others, here is a link to the data sheet if you'd like more information: http://www.sparkfun.com/datasheets/Sensors/Temperature/tmp102.pdf.

Figure 6-7. Digital temperature sensor
Libraries Explained: Wire Library and DHT22 Library
Now that we have discussed the new hardware, we need to go over some new libraries that will allow us to communicate with both of the temperature sensors: the Wire library and the DHT22 library.
Wire Library
This library will allow us to communicate with I2C with the Arduino. The Wire library comes with the Arduino IDE, so there is no need to download it. To use the Wire library, you will need to include the wire.h header file, like this:
#include <Wire.h>
This section will discuss how to use the library and its commands: Wire.begin(), Wire.requestForm(), and Wire.receive() (these are just a few of the commands, but they will be used in the last part of this chapter when we assemble our company's project):
Wire.begin(): This function initiates the Wire library. To use it, add it in the setup structure just like theSerial.begin()function.Wire.requestForm(): This function requests data from the I2C device. The data can then be retrieved using theWire.receive() function.Wire.receive(): This function gathers a byte of data from the I2C device.
That is it for the Wire library; while it is not the most verbose library, it can still be tricky to understand. We will use this library in the last project to communicate with the TMP102 digital temperature sensor.
DHT22 Library
The DHT22 library is used in conjunction with the DHT22 sensor. To download this library, go to the following link: http://github.com/nethoncho/Arduino-DHT22. This sensor will allows us to receive temperature data and humidity data. The first thing you will need to do is include the header for the DHT22 library, like this:
#include <DHT22.h>
Here are a few functions from the DHT22 library:
readData(): This function reads in data from the DHT22 sensor just like theanalogRead()function reads in data from the analog inputs.getTemperatureC(): This function will return the temperature in Celsius. It can later be converted to Fahrenheit with a simple formula we will discuss later in this chapter.getHumidity: This function will return the humidity in the area.
Now that we have gone over both of the libraries we will use for this chapter, we can move on to the projects for this chapter. We will be using all of the sensors we discussed in the previous section, including the TMP102 sensor.
Understanding the Basics of Sensors
In this section, Projects 6-1 through 6-5 will help you understand how to use sensors. Some of these projects will incorporate a couple of pieces of hardware we have used in the past (microSD shield and the monochrome LCD), but for the most part, you will be learning how to configure the sensors to work with the Arduino. The projects are flower pot analyzer, using a FSR sensor, using a flex sensor, digital level using a tilt sensor, and using a DHT22 sensor with a monochrome LCD.
Project 6-1: Flower Pot Analyzer
In this project, we will be using the photoresistor to tell us whether we are putting flowers in a sunny spot. We will need to use an analog input and store the data to a microSD card.
Gathering the Hardware
Figure 6-8 shows some of the hardware being used in this project:
- Arduino Duemilanove (or UNO)
- microSD shield
- Photoresistor
- 1-to-10kohm resistor
- Small solderless breadboard
- Enclosure
- Extra wire

Figure 6-8. Hardware for this project (Not pictured: small solderless breadboard, enclosure, and extra wire)
Configuring the Hardware
The following steps will guide you through the hardware configuration for this project:
- Create the enclosure for the flower pot analyzer. We will start with cutting a square in the lid of the enclosure (see Figure 6-9).

Figure 6-9. Square cut out of the lid of the enclosure
- Put double-sided tape around the square we just cut out.
- Take a piece of clear plastic, and cut it to a size that will fit on the hole on the plastic lid (see Figure 6-10).
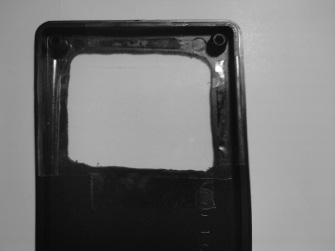
Figure 6-10. Clear screen attached with double-sided tape
- Now that the enclosure has a sunroof, we need to add the small breadboard into the enclosure (see Figure 6-11).
- Put the microSD shield on top of the Arduino, and set it inside the enclosure.
- Connect the photoresistor to the Arduino, and connect ground to one end of the photoresistor.
- Connect the 1kohm resistor to the other end of the photoresistor.

Figure 6-11. Add bread board to project
- Connect analog pin 0 to the power end of the photoresistor.
- Connect the power (+5V) to the other end of the 1kohm resistor.
- Connect a 9V battery connector to the Arduino. You should now have the hardware configured. Figures 6-12 and 6-13 illustrate the final hardware configuration.
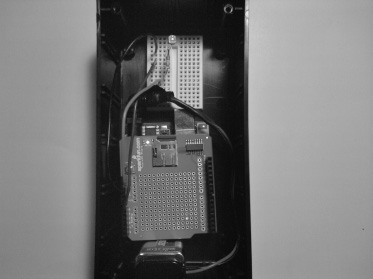
Figure 6-12. Hardware configuration, without the cover

Figure 6-13. Hardware Configuration, with the sunroof
You may have noticed that the photoresistor uses a special circuit called a voltage divider; this circuit is useful, because it will split the voltage into different parts allowing us to scale a sensor from 0 (When it is bright and 1023 when it is dark) to 1023.
![]() Note I do not recommend using this project in a rain storm, as the enclosure is not waterproof.
Note I do not recommend using this project in a rain storm, as the enclosure is not waterproof.
Writing the Software
We will need to use the SdFat library from the previous chapter. Also, we will need to use analog pin 0. The microSD shield will use the SPI pins to send weather data to a microSD card. Listing 6-1 presents the code for this project.
Listing 6-1. Flower Pot Analyzer
#include <SdFat.h>

#include <SdFatUtil.h>


//Create the variables to be used by SdFat Library

Sd2Card card;

SdVolume volume;

SdFile root;

SdFile file;


char name[] = "weather.txt";     // holds the name of the new file

int photoPin = A0;

int weatherVal = 0;


void setup()

{

   pinMode(photoPin, INPUT);

   pinMode(10, OUTPUT);       // Pin 10 must be set as an output for the SD communication to

                              // work.

   card.init();               // Initialize the SD card and configure the I/O pins.

   volume.init(card);         // Initialize a volume on the SD card.

   root.openRoot(volume);     // Open the root directory in the volume.

}


void loop()

{

  weatherVal = analogRead(photoPin);


  if (weatherVal >= 800)

  {

   file.open(root, name, O_CREAT | O_APPEND | O_WRITE);    // Open or create the file 'name'

                                                           // in 'root' for writing

                                                           // to the end of the file.


   file.println("Dark");

   file.close();            // Close the file.

   delay(1000);     // Wait 1 second

  }

  else if (weatherVal >= 300 && weatherVal <= 500)

  {

   file.open(root, name, O_CREAT | O_APPEND | O_WRITE);    // Open or create the file 'name'

                                                           // in 'root' for writing

                                                           // to the end of the file.

   file.println("Cloudy");
   file.close();            // Close the file.

   delay(1000);     // Wait 1 second

  }

  else if (weatherVal < 300 && weatherVal >= 0)

  {

   file.open(root, name, O_CREAT | O_APPEND | O_WRITE);    // Open or create the file 'name'

                                                           // in 'root' for writing

                                                           // to the end of the file.

   file.println("Sunny");

   file.close();            // Close the file.

   delay(1000);     // Wait 1 second

  }

}
Let's review the code.
The first thing we do in this program is include the header files so that we can use the SdFat library. Next, we create instances of the SdFat library that we will use throughout the rest of the program. After that, we create the file the data will be stored in, set photoPin to analog pin 0, and create the weatherVal variable. We then enter the setup structure, where we set the analog pin 0 to an input and initialize the SD card and I/Os. Next, we enter the loop structure where we set the weatherVal equal to the reading on analog pin 0. We then go through a few if statements and else-if statements. The if statements will only be true if weatherVal is greater-than-or-equal-to 800. If this is true, then "Dark" will be written to the microSD card. The first else-if statement will only be true if weatherVal is greater-than-or-equal-to 300, and weatherVal is less-than-or-equal-to 500. If this is true, then "Cloudy" will be sent to the microSD card. The last else-if statement will only be true if weatherVal is less-than 300, and weatherVal is greater-than-or-equal-to 0. If this is true, then "Sunny" will be sent to the microSD card. When you run the program, depending on the light in the flower pot, data will be sent to the microSD card explaining how much sun the flowers are receiving every second. You can make this project more robust by adding in a real time clock to make a fully featured data logger.
Project 6-2: Using a FSR Sensor
This sensor will allow us to detect weight by using the map() function as we have in the previous chapters. We will then display weight on the serial monitor.
Gathering the Hardware
Figure 6-14 shows some of the hardware being used in this project:
- Arduino Duemilanove (or UNO)
- 10kohm resistor
- Force Sensitive Resistor (FSR)
- Solderless breadboard
- Extra wire
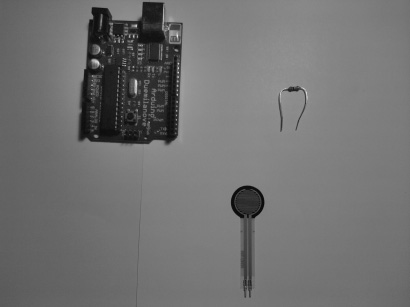
Figure 6-14. Hardware for this project (Not pictured: small solderless breadboard, enclosure, and extra wire)
Configuring the Hardware
The following steps will guide you through the hardware configuration for this project.
- Connect the FSR to the breadboard.
- Connect the 10kohm resistor to one of the FSR's pins.
- Connect ground to the other pin of the FSR.
- Connect analog pin 0 to the same pin to which the resistor is connected.
- Connect power (+5V) to the other end of the 10kohm resistor.
- Finally, put some double-sided tape on the back of the FSR and connect it to the breadboard. Figure 6-15 illustrates the hardware configuration for this project.

Figure 6-15. Hardware configuration for this project
Writing the Software
We will need to use an analog pin for the FSR and write the weight information in a user-friendly way to the serial monitor. Listing 6-2 provides the code for this project.
Listing 6-2. Write Weight to the Serial Monitor
int forcePin = A0;

int forceVal = 0;

int scaleVal = 0;


void setup()

{

  Serial.begin(9600);

  pinMode(forcePin, INPUT);

}

void loop()

{

  forceVal = analogRead(forcePin);

  scaleVal = map(forceVal, 1023, 0, 0, 20); // This is reverse mapping. The reason

                                            // we are doing reverse mapping is because

                                            // the FSR reads a high resistance when no

                                            // weight is applied to the FSR and a lower

                                            // resistance when weight is sensed.

  Serial.print("Pounds ");

  Serial.println(scaleVal);

  delay(1000);


}
This code is very basic; all it is doing is mapping the FSR reading from 0 to 20lbs. These sensors are not very accurate, but they get the job done. Now that you understand how to use an FSR, we can move on to learning about the Flex sensor.
![]() Note You may have to adjust your
Note You may have to adjust your map() function (see Chapter 3 for more information on the map() function) depending on your FSR sensor.
Project 6-3: Using a Flex Sensor
This is another short project just to get us used to using the Flex sensor (we will be using this sensor again in Chapter 8). This sensor is handy if you need to do limit testing for flexibility of a material or sensing if something has moved (like a window).
Hardware for this Project
Figure 6-16 shows some of the hardware being used in this project:
- Arduino Duemilanove (or UNO)
- Flex sensor
- 100kohm resistor
- Solderless breadboard
- Extra wire

Figure 6-16. Hardware for this project (not pictured: solderless breadboard and extra wire)
Configuring the Hardware
The following steps will guide you through the hardware configuration for this project.
- Connect the Flex sensor to the solderless breadboard.
- Connect ground from the Arduino to one of the Flex sensor's pins.
- Connect the 100kohm resistor to the other pin on the Flex sensor.
- Connect power (+5V) to the other end of the 100kohm resistor, and connect analog pin 0 to the same pin on the Flex sensor that has the 100kohm resistor attached to it. Figure 6-17 illustrates the hardware configuration for this project.

Figure 6-17. Hardware configuration for this project
Writing the Software
This program will be set up just like the previous project, except we will have to scale the values differently because we are using a 100kohm resistor. See Listing 6-3.
Listing 6-3. Send Flex Information to the Serial Monitor
int flexPin = A0;

int flexVal = 0;


void setup()

{

  Serial.begin(9600);

  pinMode(flexPin, INPUT);
}

void loop()

{

  flexVal = analogRead(flexPin);

  flexVal = map(flexVal, 200, 1023, 0, 1023);

  Serial.print("Flex: ");

  Serial.println(flexVal);

  delay(1000);

}
This program is just like the previous project except we use different parameters to scale the flex sensor properly. Without any scaling, you may see numbers from 200 to 1023, but because we scale the values, the serial monitor will display values from 0 to 1023. In the next project, we will be creating a stand-alone level with an LCD.
Project 6-4: Digital Level
While our digital level may not tell you how many degrees you are off on that kitchen counter, this project can tell you that it is not level. We will be using a monochrome LCD for this project so that we can bring the digital level anywhere.
Gathering the Hardware
Figure 6-18 shows some of the hardware being used in this project:
- Arduino Duemilanove (or UNO)
- Tilt sensor
- Monochrome LCD
- 10K potentiometer
- 1kohm resistor
- Solderless bread board
- Extra wire
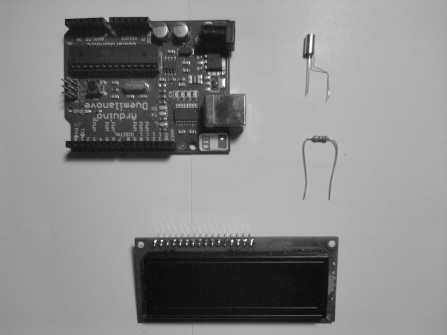
Figure 6-18. Hardware for this project (Not pictured: solderless breadboard, 10K potentiometer, and extra wire)
Configuring the Hardware
To configure this project, we first need to attach the monochrome LCD to the solderless breadboard.
- Attach the 10k potentiometer to the solderless breadboard.
- Connect pins 1, 5, and 16 on the LCD to ground.
- Connect pins 2 and 15 on the LCD to power (+5V).
- Connect ground and power up to the potentiometer.
- Connect the potentiometer's wiper to pin 3 on the LCD.
Now that the potentiometer and the monochrome LCD's power and ground lines are connected, we need to connect the RS, E, and data bus lines from the monochrome LCD to the Arduino.
- Connect pin 4 on the LCD to digital pin 7 on the Arduino.
- Connect pin 6 on the LCD to digital pin 8 on the Arduino.
- Connect pins 11, 12, 13, and 14 to digital pins 9, 10, 11, 12 on the Arduino. The monochrome LCD should now be connected to the Arduino.
Now, we need to connect the tilt sensor.
- Connect the tilt sensor to the solderless breadboard.
- Connect ground to one end of the tilt sensor. After that, connect a 1kohm resistor to the other end of the tilt sensor.
- Connect power (+5V) to the other end of the 1kohm resistor.
- Connect digital pin 4 to the same lead on the tilt sensor that has the 1kohm resistor.
That should do it for the hardware configuration, which is illustrated in Figure 6-19.
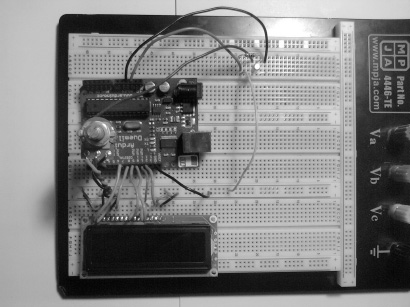
Figure 6-19. Hardware configuration for this project
Writing the Software
The program for this project will need to communicate with the monochrome LCD, so we will need to use the LiquidCrystal library as we have for the past couple of chapters. We will also need to use a digital pin for the tilt sensor (because we are using a pull-up resistor, we do not have to use a digitalWrite() function in the setup structure). See Listing 6-4.
Listing 6-4. Digital Level
// include the library code:

#include <LiquidCrystal.h>


// initialize the library with the numbers of the interface pins

LiquidCrystal lcd(7,8,9,10,11,12);


int tiltPin = 4;

int tiltState = 0;


void setup()
{

  pinMode(tiltPin, INPUT);

  // set up the LCD's number of columns and rows:

  lcd.begin(16, 2);

  lcd.clear();


}

void loop()

{

  tiltState = digitalRead(tiltPin);


  if(tiltState == HIGH)

  {

   lcd.home();

   lcd.print("Not Level");

   delay(1000);

   lcd.clear();

  }

  if(tiltState == LOW)

  {

   lcd.setCursor(0,1);

   lcd.print("Level");

   delay(1000);

   lcd.clear();

  }


}
In this code, we first include the header files so that we can use the LiquidCrystal library. Then, we create an instance of the LiquidCrystal class. After that, we initialize tiltPin and tiltState. Next, we enter the setup structure, where we set tiltPin to be an input and set up the monochrome LCD. After that, we enter the loop structure to set tiltState equal to the digital read on pin 4 (tiltPin). Next, we have a few conditional statements that will write “Not Level” to the LCD if the tilt sensor is HIGH, or “Level” if the tilt sensor is LOW. The next project we will be using one of the new libraries we discussed at the beginning of this chapter. We will also be working with a new sensor that can detect humidity and temperature.
Project 6-5: Using a DHT22 Sensor with a Monochrome LCD
In this project, we will be using a new library called the DHT22 library, which will allow us to use the DHT22 sensor. Also, we will need to use a monochrome LCD to display the humidity and temperature in degrees Fahrenheit.
Gathering the Hardware
Figure 6-20 shows some of the hardware being used in this project:
- Arduino Duemilanove (or UNO)
- Monochrome LCD
- DHT22 sensor
- 10k trimpot (or 10k potentiometer)
- 10kohms resistor
- Solderless breadboard
- Extra wire
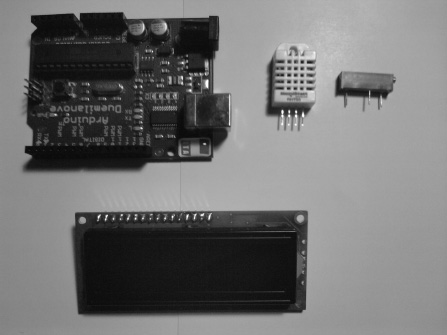
Figure 6-20. Hardware for this project (Not pictured: solderless breadboard, 10kohm resistor, and extra wire)
Configuring the Hardware
Just like the previous project, we will be using the monochrome LCD and the Arduino to display humidity and temperature data:
- Attach the monochrome LCD to the solderless breadboard.
- Attach the 10k trimpot to the solderless breadboard.
- Connect pins 1, 5, and 16 on the LCD to ground.
- Then connect pins 2 and 15 on the LCD to power (+5V).
- Connect ground to the trimpot. After that, connect the trimpot's wiper to pin 3 on the LCD.
Now that the trimpot and the monochrome LCD's power and ground lines are connected, we need to connect the RS, E, and data bus lines from the monochrome LCD to the Arduino:
- Connect pin 4 on the LCD to digital pin 7 on the Arduino.
- Connect pin 6 on the LCD to digital pin 8 on the Arduino.
- Connect pins 11, 12, 13, and 14 to digital pins 9, 10, 11, 12 on the Arduino.
The monochrome LCD should now be connected to the Arduino. Now, we need to connect the DHT22 sensor to the Arduino:
- Connect the DHT22 to the solderless breadboard.
- Connect the 10kohm resistor from pin 1 on the DHT22 and pin 2 on the DHT22.
- Connect pin 1 to power (+5V) and pin 2 to digital pin 2 on the Arduino.
- Connect pin 4 on the DHT22 to ground on the Arduino. Figure 6-21 illustrates the hardware configuration for this project.
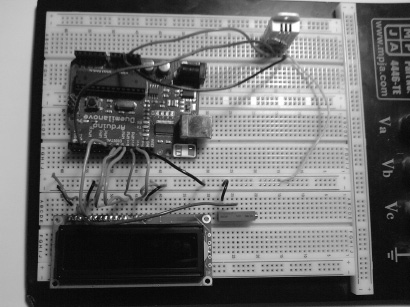
Figure 6-21. Hardware configuration for this project
Writing the Software
We will need to utilize both the LiquidCrystal and DHT22 libraries to write humidity and temperature data to the LCD. We will also need to convert the temperature data from Celsius to Fahrenheit. We will use this formula to convert that data:
Tf = temperature in Fahrenheit
Tc = temperature in Celsius
Tf = (9/5) * Tc + 32
See Listing 6-5.
Listing 6-5. Display Temperature and Humidity on a Monochrome LCD
// include the library code:

#include <LiquidCrystal.h>

#include <DHT22.h>


int tempPin = 2;


// Create instance

DHT22 DHT22Sen(tempPin);


// initialize the library with the numbers of the interface pins

LiquidCrystal lcd(7,8,9,10,11,12);


float tempF = 0.00;

float tempC = 0.00;


void setup()

{

  // set up the LCD's number of columns and rows:

  lcd.begin(16, 2);

  lcd.clear();

}


void loop()

{


  delay(2000);

  DHT22Sen.readData();


  lcd.home();

  lcd.print("Temp: ");

  tempC = DHT22Sen.getTemperatureC();

  tempF = (tempC * 9.0 / 5.0) + 32;

  lcd.print(tempF);

  lcd.print("F ");

  lcd.setCursor(0,1);

  lcd.print("Hum:  ");

  lcd.print(DHT22Sen.getHumidity());

  lcd.println("%");


}
First, we include the header files necessary to use the LyquidCrystal and DHT22 libraries. After that, we initialize tempPin to digital pin 2 and create an instance of the DHT22 type. Next, we create an instance of the LiquidCrystal type and initialize tempC and tempF to 0. We then enter the setup structure and begin communicating with the monochrome LCD. Then, we enter the loop structure, where we first delay for 2 seconds. After that, we read from the DHT22 sensor and then print “Temp: ” to the LCD. After that, we set tempC equal to the temperature reading on the DHT22 sensor, and we convert the Celsius data to Fahrenheit data using this code:
tempF = (tempC * 9.0 / 5.0) + 32;
Notice how the tempC variable is inside the parentheses instead of on the outside, because the compiler does not discriminate based on the type of arithmetic performed; it just reads from left to right. After the conversion is completed, we write tempF's value to the monochrome LCD. Next, we send the humidity data to the monochrome LCD.
Now that you have the knowledge to use sensors, we can check in with the company and proceed with a project using a different type of digital temperature sensor and requirements document.
Project 6-6: Wireless Temperature Monitor
Now that you understand how to use the sensors and libraries necessary, we're ready to jump into this chapter's final project. This project will extend your knowledge of setting up sensors, and we will work with the Wire Library for the first time.
Requirements Gathering and Creating the Requirements Document
The customer has set up a meeting and has several requirements for a wireless temperature monitor. The customer would like to use the TMP102 temperature sensor with the Arduino UNO (or Duemilanove). The sensor will need to operation within a 10% margin of error limit. It needs to have a range of 30 feet in the open air and display temperature in Fahrenheit on the serial monitor in this format: “Temperature: XX.XXF”.
We know that the Arduino is a 5V system, which means that we cannot use this sensor unless we bring the voltage down to a 3.3V level in order to interface with the TMP102. We will have to use a logic level converter so that we can use a 3.3V system, rather then the 5V system. The company only wants a prototype of the wireless temperature system, so we can use a solderless breadboard for this project. Now that we have our notes from the meeting, we can create a requirements document.
Gathering the Hardware
Figure 6-22 shows some of the hardware being used in this project:
- Arduino UNO (or Duemilanove)
- Bluetooth Mate Silver
- Logic level converter
- TMP102 sensor
- 9V battery
- 9V battery connector
- Solderless breadboard
- Extra wire
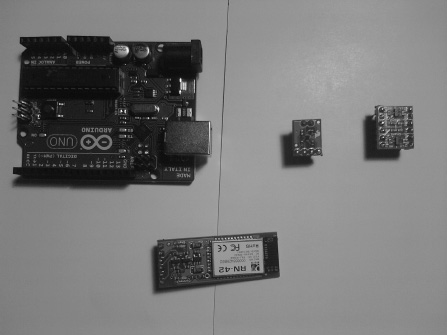
Figure 6-22. Hardware for this project (Not pictured: solderless breadboard, 9V battery, 9V battery connector, and extra wire)
Outlining the Software Requirements
These are the basic software requirements for our project:
- Use the Wire library to communicate with the TMP102 sensor (I2C)
- Convert from Celsius to Fahrenheit using the formula (9/5) * Tc + 32 (modify this equation to work on the Arduino).
- The sensor will need to be within a 10% margin of error, so add any values to make this sensor accurate
- Write the temperature to the serial monitor in this format: “Temperature: XX.XXF”.
Now that we have the hardware and software requirements, we can make a flowchart that the software will follow. This will help us later in the debugging stages if we have any problems. Figure 6-23 illustrates this project's flowchart.
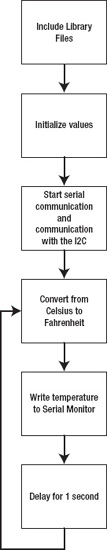
Figure 6-23. Flowchart for this project
Configuring the Hardware
As with Projects 6-4 and 6-5, our customer's project involves three main tasks. In this case, they are adding the Bluetooth Mate Silver, adding the logic level converter, and adding the sensor. This section outlines the steps involved in each.
First, we'll connect the Bluetooth Mate Silver, logic level converter, and the TMP102 sensor to the solderless bread board and configure the Bluetooth Mate Silver. Figure 6-24 illustrates this process.
- Connect the RX pin on the Arduino to the pin 3 on the Bluetooth Mate Silver.
- Connect the TX pin on the Arduino to pin 2 on the Bluetooth Mate Silver.
- Connect pin 1 on the Bluetooth Mate Silver to pin 5 on the Bluetooth Mate Silver.
- Connect pin 4 to +5V and pin 6 to ground on the Bluetooth Mate Silver.
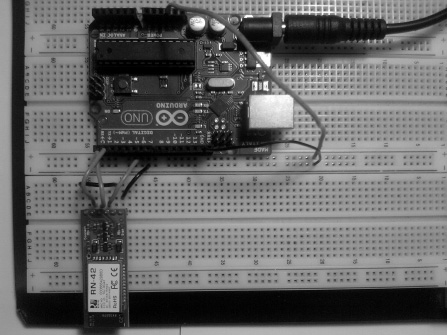
Figure 6-24. Configuring the Blue Tooth Mate Silver
Now that the Bluetooth Mate Silver is connected, we need to configure the logic level converter and the TMP102 sensor. Figures 6-25 and 6-26 illustrate this process.
- Connect the high voltage pin on the logic level converter to +5V on the Arduino.
- Connect the low voltage pin on the logic level converter to +3.3V on the Arduino.
- Connect Channel 2 High Voltage TX0 line to analog pin 5 on the Arduino.
- Connect Channel 1 High Voltage TX0 line to analog pin 4 on the Arduino.
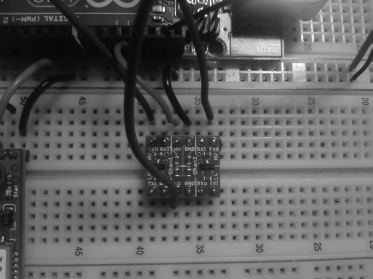
Figure 6-25. Close up of the logical converter
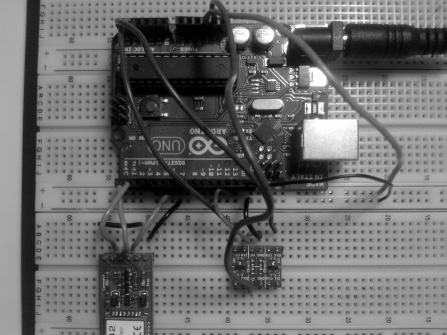
Figure 6-26. Configuration of logical converter
Now, we need to connect the logic level converter to the TMP102 sensor. Figures 6-27 and 6-28 illustrate this process.
- Connect Channel 1 Low Voltage TXI line to the SDA pin on the TMP102 sensor.
- Connect Channel 2 Low Voltage TXI line to the SCL pin on the TMP102 sensor.
- Connect 3.3V to the TMP102's V+ pin and ground to the TMP102's GND pin and ADD0 pin.
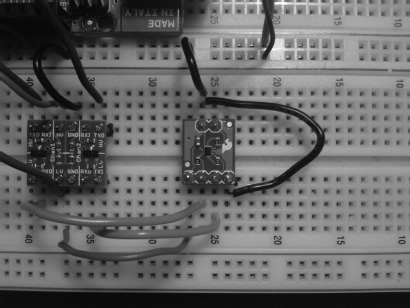
Figure 6-27. Configuration of TMP102 temperature sensor

Figure 6-28. Hardware configuration for this project
Writing the Software
For this project, we will need to communicate with the TMP102 sensor using the Wire library. We will also need to convert the temperature data from Celsius to Fahrenheit. After that, we will need to write the temperature data to the serial monitor. Listing 6-6 provides the code for this project (this code is provided by the Arduino development team).
Listing 6-6. Send Temperature Data to the Serial Monitor
#include <Wire.h>

byte res;

byte firstByte;

byte lastByte;

int val;

float tempC = 0.00;

float tempF = 0.00;


void setup()

{

  Serial.begin(115200);

  Wire.begin();

}


void loop()

{

  res = Wire.requestFrom(72,2); // requests address and quantity to request bytes from slave

                                // device, for example the TMP102 (slave device)

  if (res == 2) {

    firstByte = Wire.receive(); // Read on byte from TMP102

    lastByte = Wire.receive(); // read least significant data

    val = ((firstByte) << 4);   // firstByte

    val |= (lastByte >> 4);    // lastByte

    tempC = val*0.0625; // Converted to celsius

    tempF = (tempC * 9 / 5) + 32; // Convert to Fahrenheit

    Serial.print("Temperature: ");

    Serial.print(tempF - 5); // this is due to the +/- 10% error that may occurr

    Serial.println("F");

    delay(1000);

  }


}
![]() Note To upload this code to the Arduino, you will need to disconnect the TX and RX lines that the Bluetooth Mate Silver is connected to. Then, connect your USB to the Arduino and upload the code.
Note To upload this code to the Arduino, you will need to disconnect the TX and RX lines that the Bluetooth Mate Silver is connected to. Then, connect your USB to the Arduino and upload the code.
We first include the header files that will allow us to communicate with the TMP102 sensor. Then, we initialize all of the variables to store the TMP102's information. After that, we enter the setup structure and begin serial communication. Also, we start the communication between the Arduino and the TMP102. Next, we enter the setup structure and request 2 bytes from the TMP102 sensor. After that, we receive the significant bits from the TMP102 and receive the least significant values from the TMP102 sensor. We convert the val variable to Celsius and the temperature value from Celsius to Fahrenheit. Finally, we write the temperature data to the serial monitor in this format: “Temperature: XX.XXF”.
For more information on I2C, you can visit http://en.wikipedia.org/wiki/I2c.
Debugging the Arduino Software
This program will not have many logical errors, because we do not use any conditional statements or loops. You may have run into some syntax errors if you forgot to put a semicolon after a statement. You also may not have configured the Arduino IDE properly. Make sure that you use the Bluetooth's COM port, and not the USB COM port, to see the data on the serial monitor. Also, make sure the baud rate is set to 115200 on the serial monitor; otherwise, you will not see any data.
Troubleshooting the Hardware
The main problem you may run into is that your wiring is incorrect. Make sure that you followed the instructions in the “Configuring the Hardware” section, and you should not have this problem. Also, you may need to reconnect your RX and TX lines from the Arduino to the Bluetooth Mate Silver, if you had to disconnect them to upload the code to your Arduino. The other concern is that you may have connected 5V to the TMP102 sensor instead of 3.3V.
Final Prototype
If everything is working, you should have a finished prototype like the one shown in Figure 6-29 to deliver to the customer.
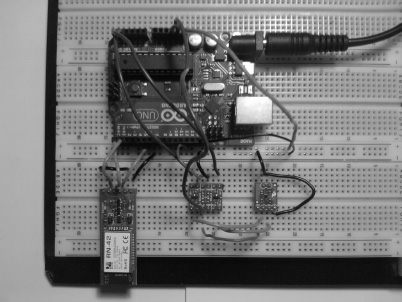
Figure 6-29. Finished prototype
Summary
In this chapter, we first went over the voltage divider circuit and how we use it to scale voltage levels that work with various sensors. After that, you learned about the various sensors that we would use throughout this chapter. Then, we went over the DHT22 and Wire libraries. The DHT22 library was used to communicate with the DHT22 sensor, and the Wire library is used to communicate with a variety of I2Cs. Next, we began to use sensors to create various projects that would help us understand how to use sensors with the Arduino. This chapter's final project gave us a break from the robot that we have been working in the previous chapters, but it still gave us a challenge using the engineering process. We created a wireless temperature system that has a margin of error less than 10%.