
In the previous chapters, we looked into how to use machine learning with images and text data to do object detection and classification, as well as sentiment analysis, toxicity classification and question answering.
These are probably the most common examples of what machine learning can do. However, this list is not exhaustive and many more inputs can be used.
In this chapter, we’re going to explore different kinds of input data and build a few experimental projects to understand how to use machine learning with audio and hardware data, as well as using models focused on body and movement recognition.
5.1 Audio data
When you first read the words “audio data,” you might think that this section of the book is going to focus on music; however, I am going to dive into using sound more generally.
We don’t really think about it often but a lot of things around us produce sounds that give us contextual information about our environment.
For example, the sound of thunder helps you understand the weather is probably bad without you having to look out the window, or you can recognize the sound of a plane passing by before you even see it, or even hearing the sound of waves indicates you are probably close to the ocean, and so on.
Without realizing, recognizing, and understanding the meaning of these sounds impacts our daily lives and our actions. Hearing a knock on your door indicates someone is probably behind waiting for you to open it, or hearing the sound of boiling water while you are cooking suggests that it is ready for you to pour something in it.
Using sound data and machine learning could help us leverage the rich properties of sounds to recognize certain human activities and enhance current smart systems such as Siri, Alexa, and so on.
This is what is called acoustic activity recognition .

Illustration of personal devices that possess a microphone
So far, the smart systems some of us may be using recognize words to trigger commands, but they have no understanding of what is going on around them; your phone does not know you are in the bathroom, your Alexa device does not know you might be in the kitchen, and so on. However, they could and this could be used to create more tailored and useful digital experiences.
Before we dive into the practical part of this chapter and see how to build such systems in JavaScript using TensorFlow.js, it is helpful to start by understanding the basics of what sound is, and how it is translated to data we can use in code.
5.1.1 What is sound?
Sound is the vibration of air molecules.
If you have ever turned the volume of speakers really loud, you might have noticed that they end up moving back and forth with the music. This movement pushes on air particles, changing the air pressure and creating sound waves.
The same phenomenon happens with speech. When you speak, your vocal cords vibrate, disturbing air molecules around and changing the air pressure, creating sound waves.
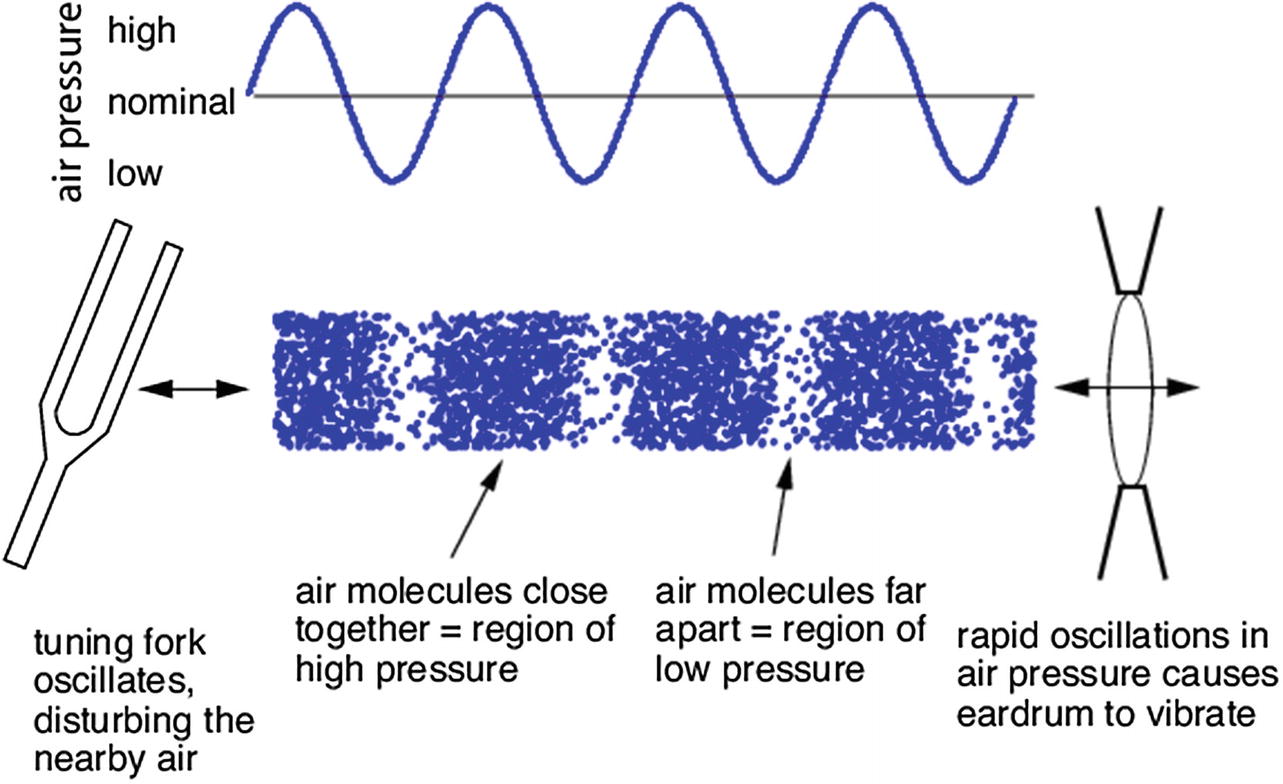
Illustration of how sound waves work. Source: www.researchgate.net/figure/Sound-as-a-pressure-wave-The-peaks-represent-times-when-air-molecules-are-clustered_fig2_215646583
When you hit a tuning fork, it will start vibrating. This back and forth movement will change the surrounding air pressure. The movement forward will create a higher pressure and the movement backward will create a region of lower pressure. The repetition of this movement will create waves.
On the receiver side, our eardrums vibrate with the changes of pressure and this vibration is then transformed into an electrical signal sent to the brain.
So, if sound is a change in air pressure, how do we transform a sound wave into data we can use with our devices?
To be able to interpret sound data, our devices use microphones.
There exist different types of microphones, but in general, these devices have a diaphragm or membrane that vibrates when exposed to changes of air pressure caused by sound waves.
These vibrations move a magnet near a coil inside the microphone that generate a small electrical current. Your computer then converts this signal into numbers that represent both volume and frequency.
5.1.2 Accessing audio data
In JavaScript, the Web API that lets developers access data coming from the computer’s microphone is the Web Audio API.
If you have never used this API before, it’s totally fine; we are going to go through the main lines you need to get set up everything.
Setup to use the Web Audio API in JavaScript
This code sample takes into consideration cross-browser compatibility.
Then, to start listening to input coming from the microphone, we need to wait for a user action on the page, for example, a click.
JavaScript code sample to set up the audio context on click
In the preceding code sample, we are using navigator.mediaDevices.getUserMedia to get access to the microphone. If you have ever built applications that were using audio or video input devices before, you might be familiar with writing navigator.getUserMedia(); however, this is deprecated and you should now be using navigator.mediaDevices.getUserMedia().
Writing it the old way will still work but is not recommended as it will probably not be supported in the next few years.
Function to filter through the raw data to get the frequency data we will use
We also call requestAnimationFrame to continuously call this function and update the data we are logging with live data.
Complete code sample to get input data from the microphone in JavaScript

Screenshot of the data returned by the preceding code sample
These arrays represent the frequencies that make up the sounds recorded by the computer’s microphone. The default sample rate is 44,100Hz, which means we get about 44,000 samples of data per second.
In the format shown earlier (arrays of integers), finding patterns to recognize some type of activity seems pretty difficult. We wouldn’t really be able to identify the difference between speaking, laughing, music playing, and so on.
To help make sense of this raw frequency data, we can turn it into visualizations.
5.1.3 Visualizing audio data
There are different ways to visualize sound. A couple of ways you might be familiar with are waveforms or frequency charts.
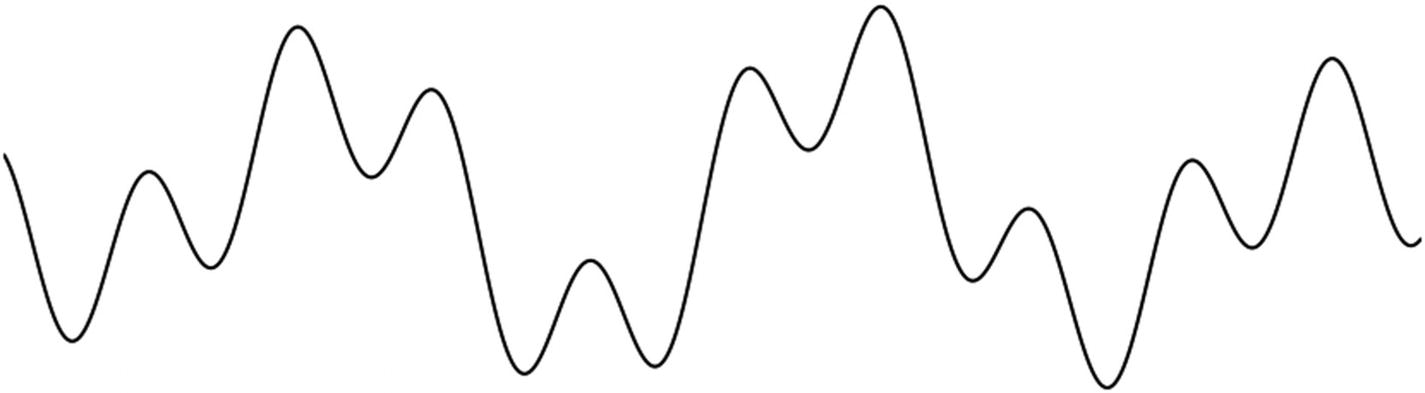
Illustration of a waveform visualization. Source: https://css-tricks.com/making-an-audio-waveform-visualizer-with-vanilla-javascript/
On the x axis (the horizontal one) is the unit of time and on the y axis (vertical one) is the frequencies. Sound happens over a certain period of time and is made of multiple frequencies.
This way of visualizing sound is a bit too minimal to be able to identify patterns. As you can see in the illustration earlier, all frequencies that make up a sound are reduced to a single line.

Illustration of a frequency chart visualization
You might be familiar with this type of audio visualization as they are probably the most common one.
This way of visualizing can maybe give you some insights about a beat as it represents repetitions or maybe about how loud the sound is as the y axis shows the volume, but that’s about it.
This visualization does not give us enough information to be able to recognize and classify sounds we are visualizing.
Another type of visualization that is much more helpful is called a spectrogram.
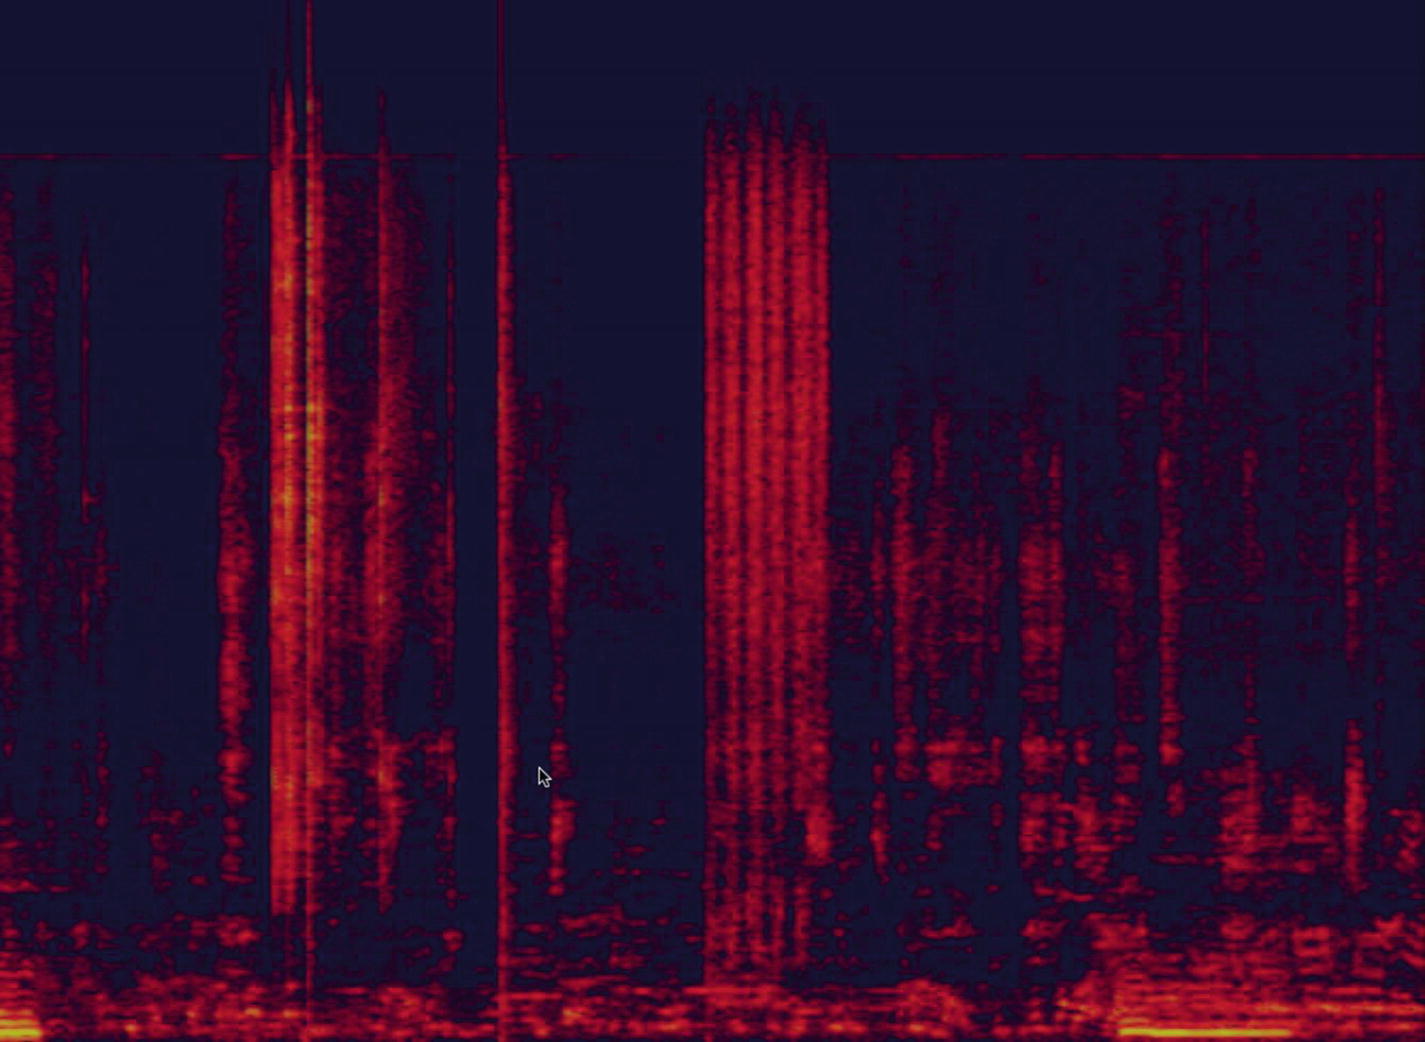
Illustration of a spectrogram
On the y axis is the spectrum of frequencies and, on the x axis, the amount of time. The axes seem similar to the two other type of visualizations we mentioned previously, but instead of representing all frequencies in a single line, we represent the whole spectrum.
In a spectrogram, a third axis can be helpful too, the amplitude. The amplitude of a sound can be described as the volume. The brighter the color, the louder the sound.
Visualizing sounds as spectrograms is much more helpful in finding patterns that would help us recognize and classify sounds.

Illustration of a spectrogram taken while speaking

Illustration of a spectrogram taken while clapping my hands three times
Hopefully, it starts to make more sense! If you compare both spectrograms, you can clearly distinguish between the two activities: speaking and clapping my hands.
If you wanted, you could try to visualize more sounds like coughing, your phone ringing, toilets flushing, and so on.
Overall, the main takeaway is that spectrograms help us see the signature of various sounds more clearly and distinguish them between different activities.
If we can make this differentiation by looking at a screenshot of a spectrogram, we can hope that using this data with a machine learning algorithm will also work in finding patterns and classify this sounds to build an activity classifier.

Spectrograms collected from the research by the Carnegie Mellon University. Source: http://www.gierad.com/projects/ubicoustics/
So, before we dive into using sound with machine learning, let’s go through how we can turn the live data from the microphone that we logged in the console using the Web Audio API to a spectrogram.
Creating a spectrogram
getAudioData function to get frequency data from raw data
Where we wrote our console.log statement, we are going to add the code to create the visualization.
Adding a canvas element to the HTML file
Getting the canvas element and context in JavaScript
Getting the image data from the canvas element and redrawing over it
Looping through frequency data and drawing it onto the canvas
Inside this for loop, we use the beginPath method to indicate that we are going to start drawing something onto the canvas.
Then, we call strokeStyle and pass it a dynamic value that will represent the colors used to display the amplitude of the sound.
After that, we call moveTo to move the visualization 1 pixel to the left and leave space for the new input to be drawn onto the screen at the far right, drawn with lineTo.
Finally, we call the stroke method to draw the line.
Full getAudioData function
You might be wondering why it is important to understand how to create spectrograms. The main reason is that it is what is used as training data for the machine learning algorithm.
Instead of using the raw data the way we logged it in the browser’s console, we instead use pictures of spectrograms generated to transform a sound problem into an image one.
Advancements in image recognition and classification have been really good over the past few years, and algorithms used with image data have been proven to be very performant.
Also, turning sound data into an image means that we can deal with a smaller amount of data to train a model, which would result in a shorter amount of time needed.
Indeed, the default sample rate of the Web Audio API is 44KHz, which means that it collects 44,000 samples of data per second.
If we record 2 seconds of audio, it is 88,000 points of data for a single sample.
You can imagine that as we need to record a lot more samples, it would end up being a very large amount of data being fed to a machine learning algorithm, which would take a long time to train.
On the other hand, a spectrogram being extracted as a picture can be easily resized to a smaller size, which could end up being only a 28x28 pixel image, for example, which would result in 784 data points for a 2-second audio clip.
Now that we covered how to access live data from the microphone in JavaScript and how to transform it into a spectrogram visualization, allowing us to see how different sounds create visually different patterns, let’s look into how to train a machine learning model to create a classifier.
5.1.4 Training the classifier
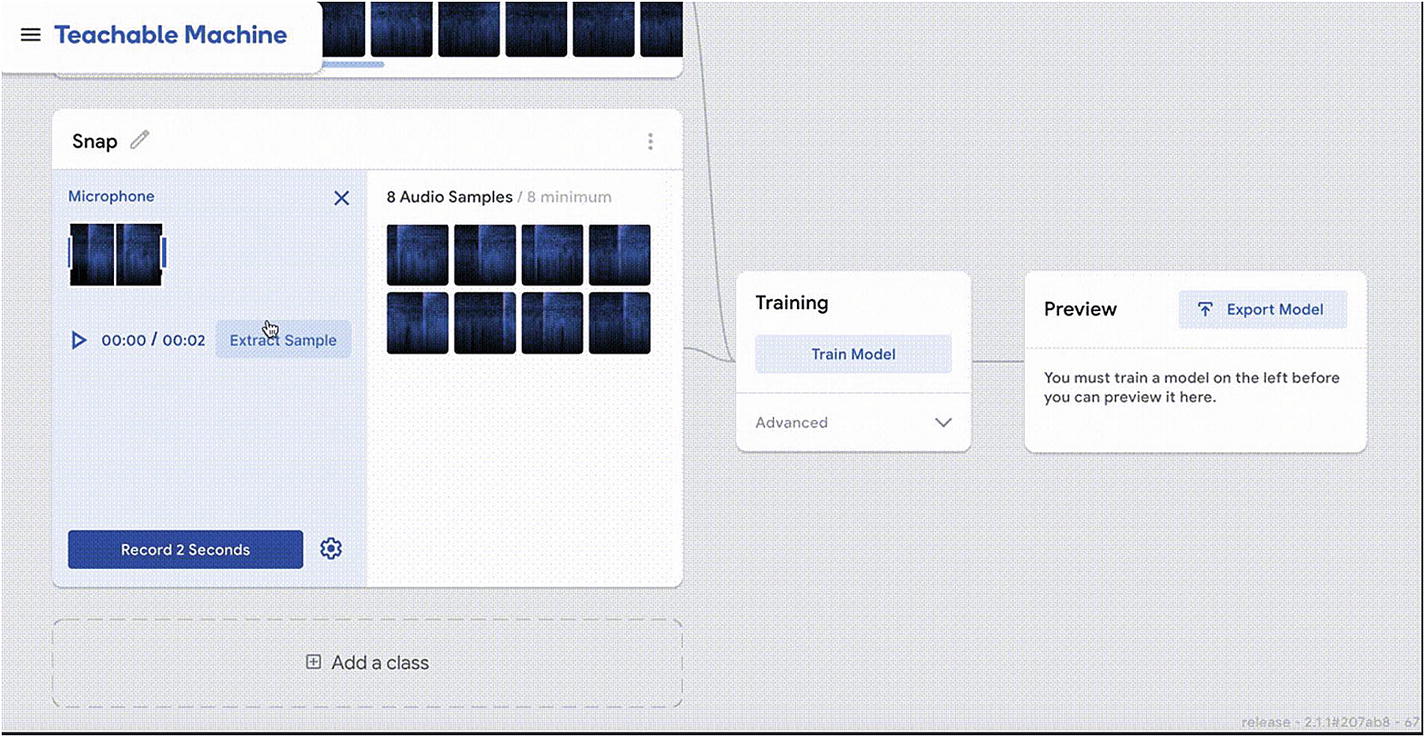
Teachable Machine interface
This project allows us to record samples of sound data, label them, train a machine learning algorithm, test the output, and export the model all within a single interface and in the browser!
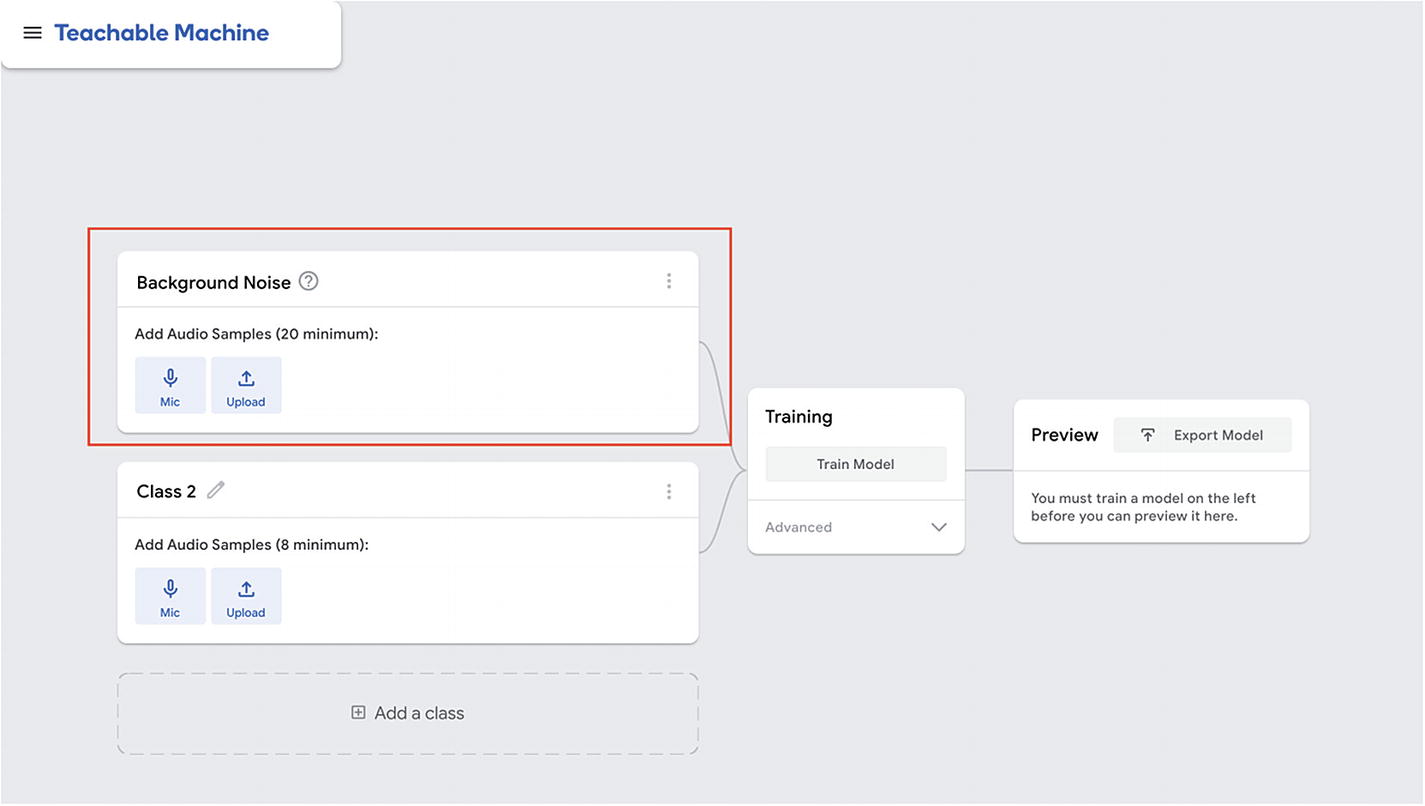
Teachable Machine interface with background noise section highlighted
Then, we can start to record some samples for whatever sound we would like the model to recognize later on.
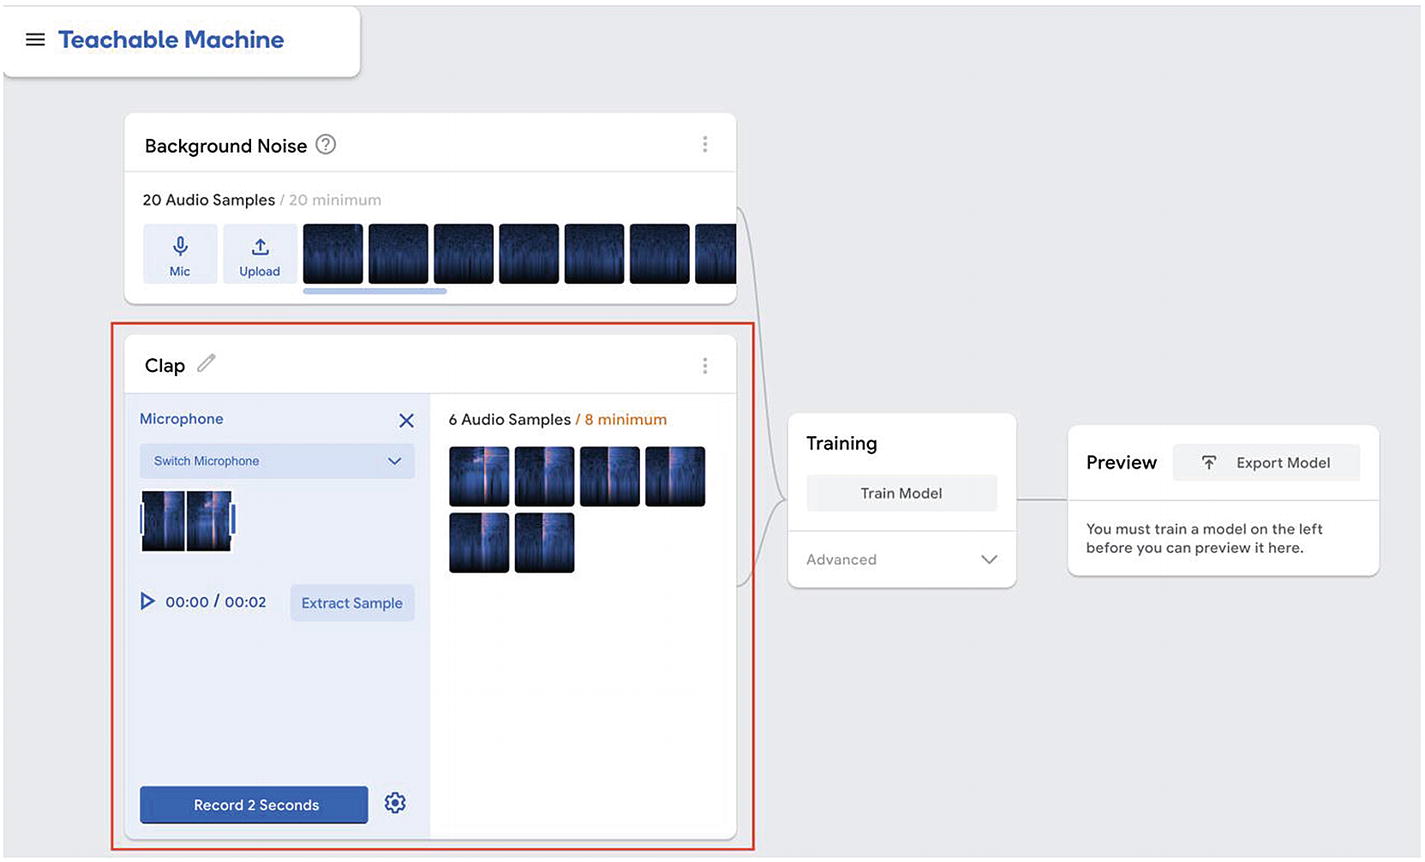
Teachable Machine interface with custom section highlighted
As this experiment uses transfer learning to quickly retrain a model that has already been trained with sound data, we need to work with the same format the original model was trained with.
Eight samples is the minimum but you can record more if you’d like. The more samples, the better. However, don’t forget that it will also impact the amount of time the training will take.
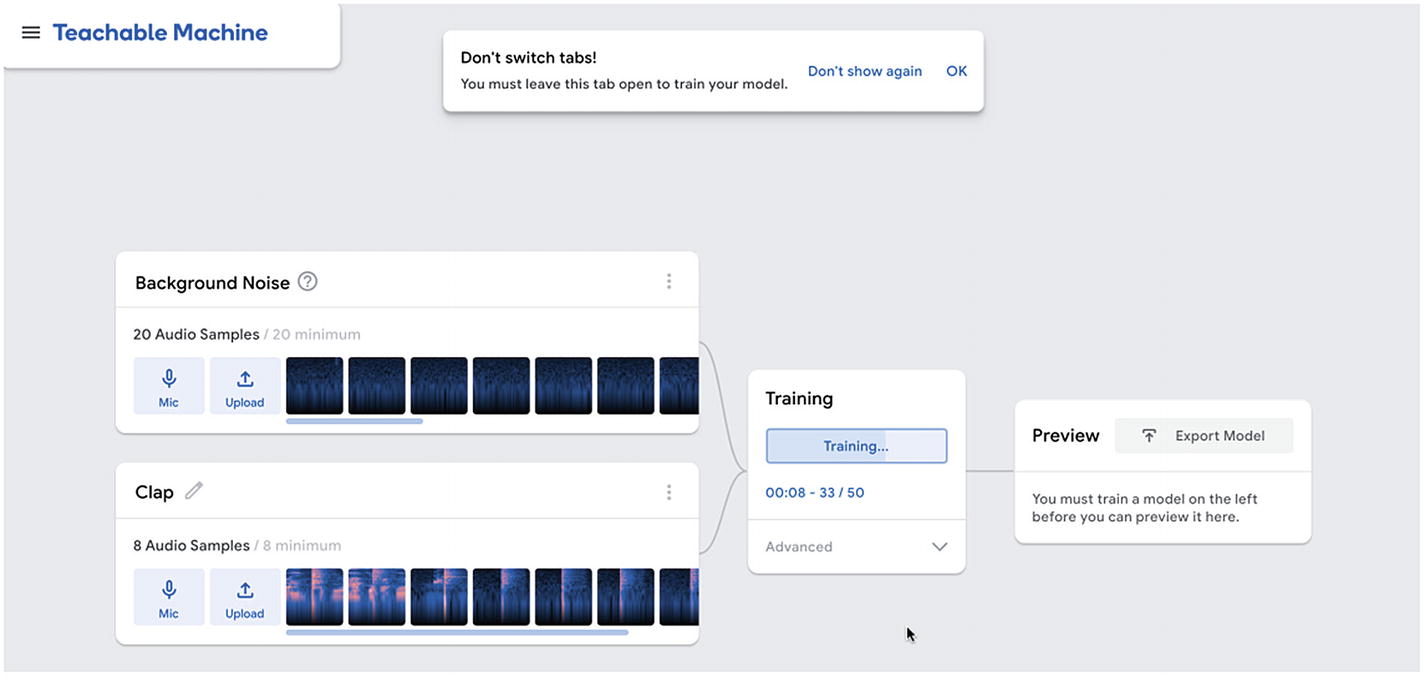
Teachable Machine interface – training the model
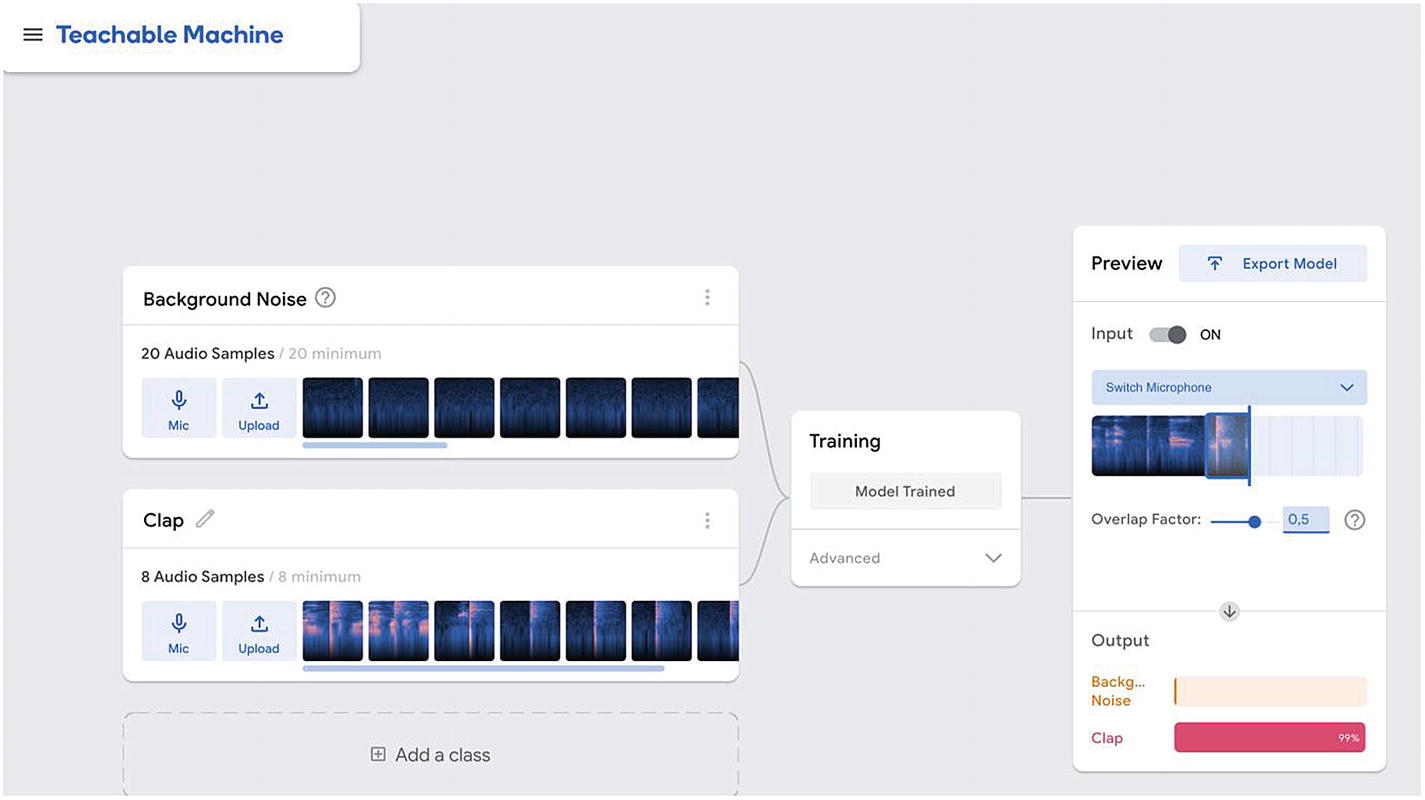
Teachable Machine interface – running live predictions
If you are ready to move on, you can either upload your model to some Google servers and be provided with a link to it, or download the machine learning model that was created.
If you’d like to get a better understanding of how it works in the background, how the machine learning model is created, and so on, I’d recommend having a look at the source code available on GitHub!
Even though I really like interfaces like Teachable Machine as they allow anyone to get started and experiment quickly, looking at the source code can reveal some important details. For example, the next image is how I realized that this project was using transfer learning.
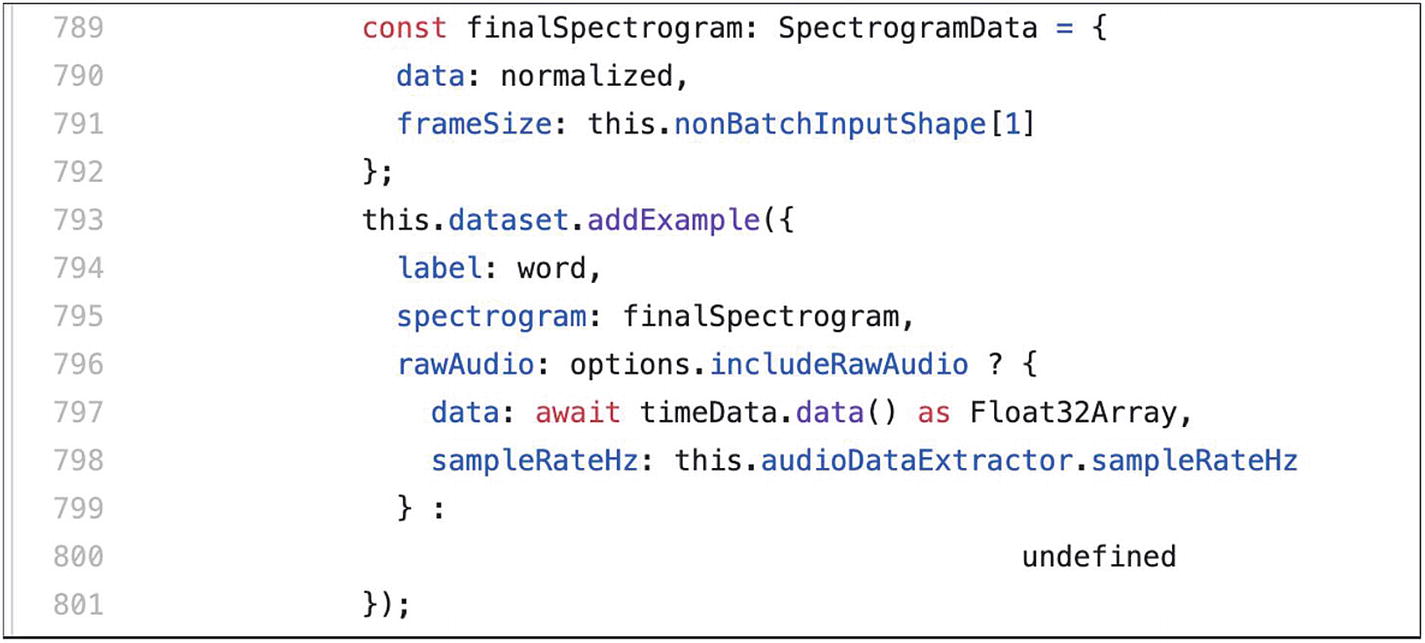
Sample from the open source GitHub repository of Teachable Machine
On line 793, we can see that the method addExample is called. This is the same method we used in the chapter of this book dedicated to image recognition when we used transfer learning to train an image classification model quickly with new input images.
Noticing these details is important if you decide to experiment with re-creating this model on your own, without going through the Teachable Machine interface.
Now that we went through the training process, we can write the code to generate the predictions.
5.1.5 Predictions
Import TensorFlow.js and the speech commands model in an HTML file
As I mentioned earlier, this experiment uses transfer learning, so we need to import the speech commands model that has already been trained with audio data to make it simpler and faster to get started.
The speech commands model was originally trained to recognize and classify spoken words, like “yes”, “no”, “up”, and “down”. However, here, we are using it with sounds produced by activities, so it might not be as accurate as if we were using spoken words in our samples.
Before going through the rest of the code samples, make sure you have downloaded your trained model from the Teachable Machine platform, unzipped it, and added it to your application folder.
The following code samples will assume that your model is stored in a folder called activities-model at the root of your application.
- activities-model/
metadata.json
model.json
weights.bin
index.html
index.js
Variables to refer to the model and its metadata
You may have noticed that I used localhost:8000 in the preceding code; however, feel free to change the port and make sure to update this if you decide to release your application to production.
Loading the model
Live predictions
Full code sample
Calling the function

Example of data returned when calling the function
This array containing the results of the prediction is ordered by label used. In the previous example, I had trained the model with six different labels so each array returned contained six values.
In ean ach array, the value closest to 1 represents the label predicted.
Mapping scores to labels
Full code sample
5.1.6 Transfer learning API
In the previous section, we covered how to record sound samples and train the model using the Teachable Machine experiment, for simplicity. However, if you are looking to implement this in your own application and let users run this same process themselves, you can use the transfer learning API.
This API lets you build your own interface and call API endpoints to record samples, train the model, and run live predictions.
Recording samples

Web interface with a few button elements
Some of these buttons are used to collect sample data, one button to start the training and the last one to trigger the live predictions.
HTML file
Set up the recognizers
Collecting samples
Training
Predict
Full code sample
5.1.7 Applications
Even though the examples I have used so far for our code samples (speaking and coughing) might have seemed simple, the way this technology is currently being used shows how interesting it can be.
Health

Countdown triggered when the user washes their hands
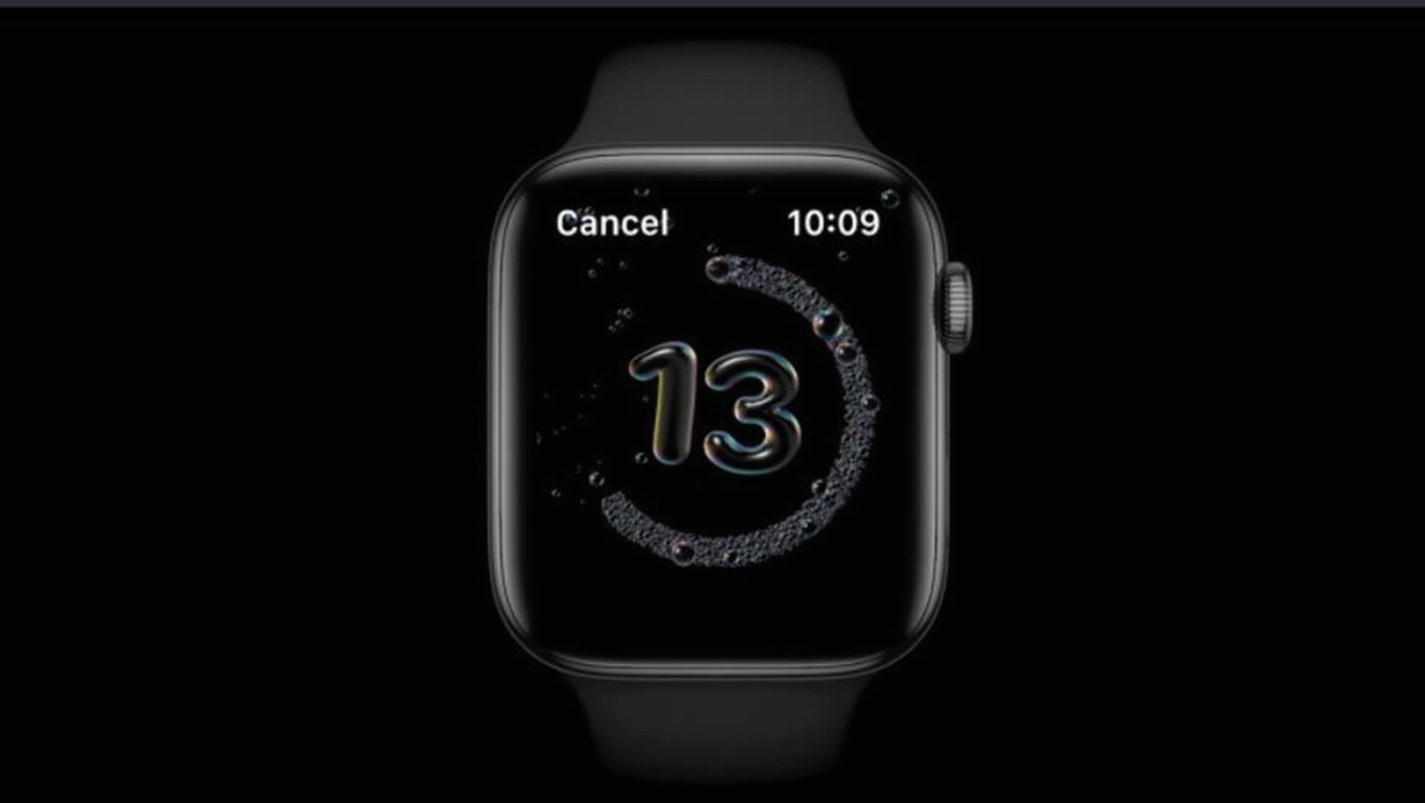
Interface of the countdown on the Apple Watch
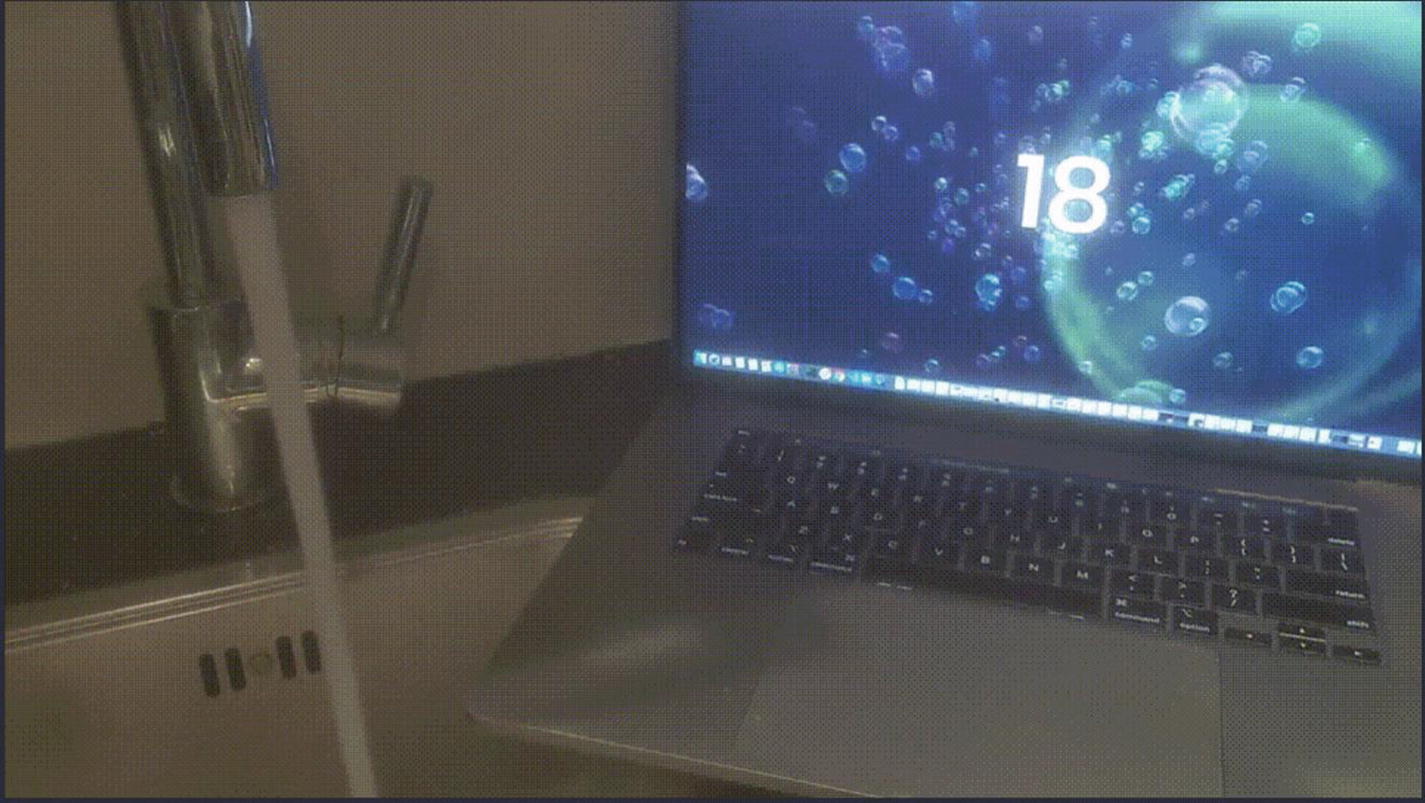
Prototype of similar countdown interface using TensorFlow.js
Biodiversity research and protection
One of my favorite applications for this technology is in biodiversity research and protection of endangered species.
A really good example of this is the Rainforest Connection collective.
This collective uses old cell phone and their built-in microphones to detect the sound of chainsaws in the forest and alert rangers of potential activities of illegal deforestation.
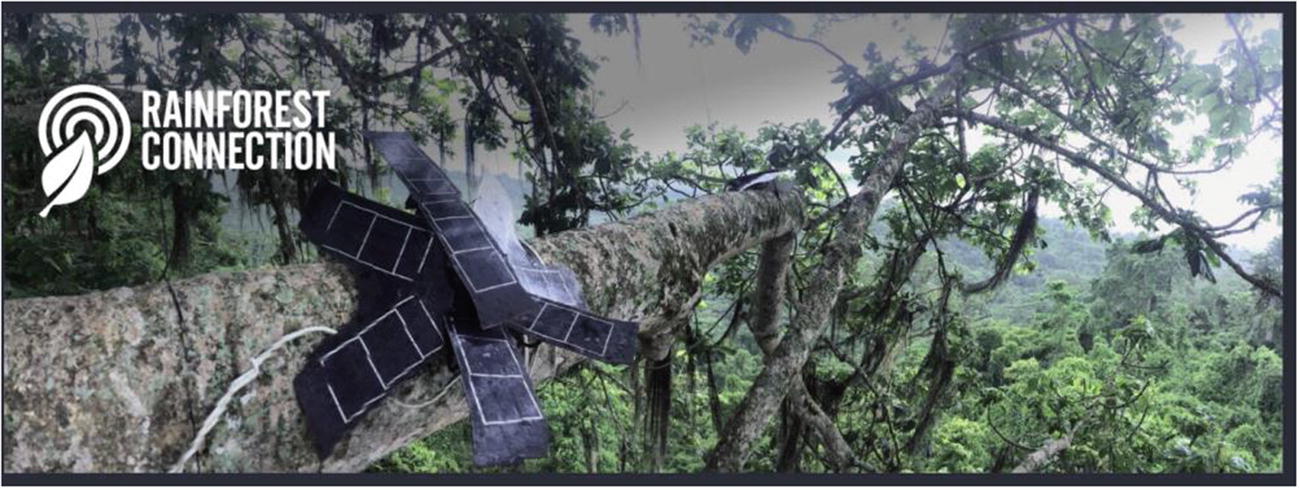
Example of installation made of solar panels and used mobile phones. Source: https://www.facebook.com/RainforestCx/
If this is a project that interests you, they also have a mobile application called Rainforest Connection, in which you can listen to the sound of nature, live from the forest, if you would like to check it out!
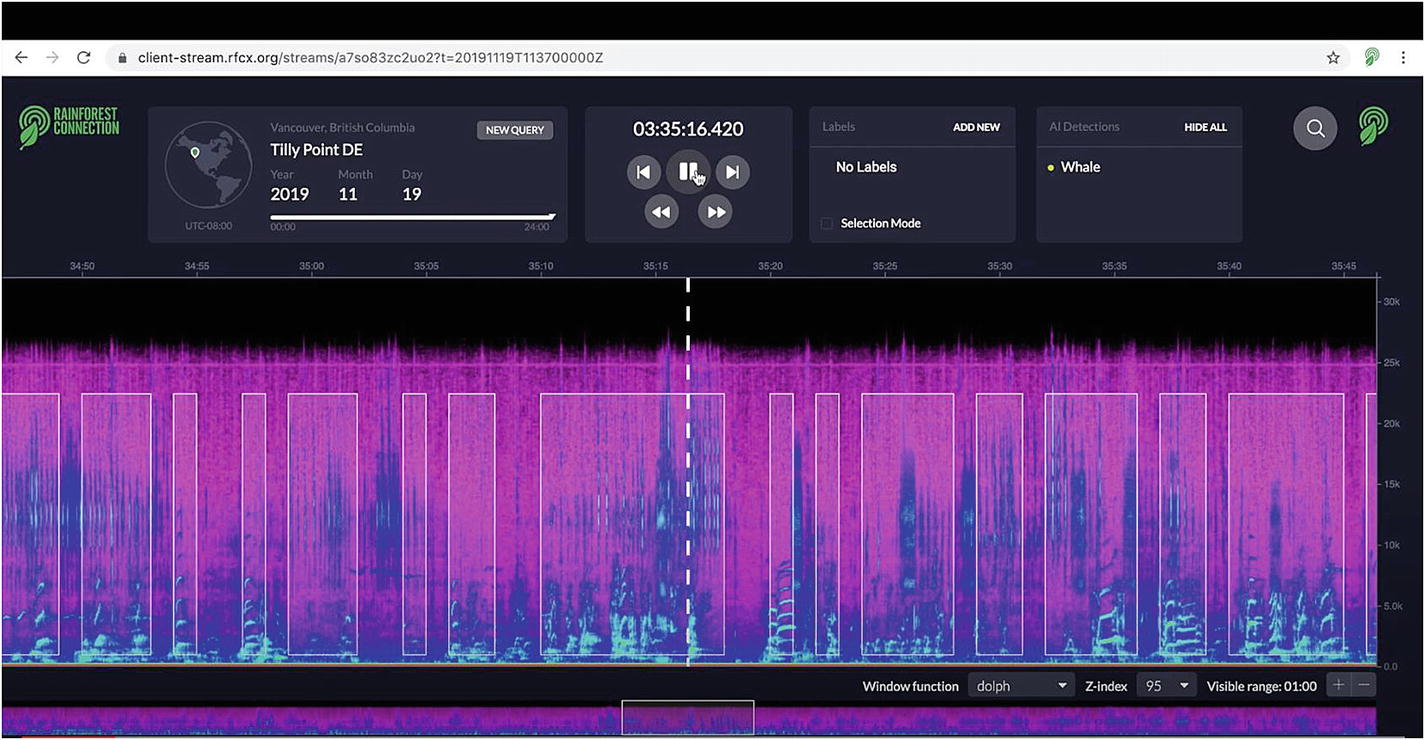
Web interface tracking killer whales. Source: https://venturebeat.com/2020/01/28/googles-ai-powers-real-time-orca-tracking-in-vancouver-bay/
Web Accessibility
Another application you might not have noticed is currently implemented in a service you probably know. Indeed, if you are using YouTube, you may have come across live ambient sound captioning.
If you have ever activated captions on a YouTube video, you may know of spoken words being displayed as an overlay at the bottom.
However, there are more information in a video than what can be found in the transcripts.
Indeed, people without hearing impairment benefit from having access to additional information in the form of contextual sounds like music playing or the sound of rain in a video.
Only displaying spoken words in captions can cut quite a lot of information out for people with hearing impairment.
About 3 years ago, in 2017, YouTube released live ambient sound captioning that uses acoustic recognition to add to the captions details about ambient sounds detected in the soundtrack of a video.
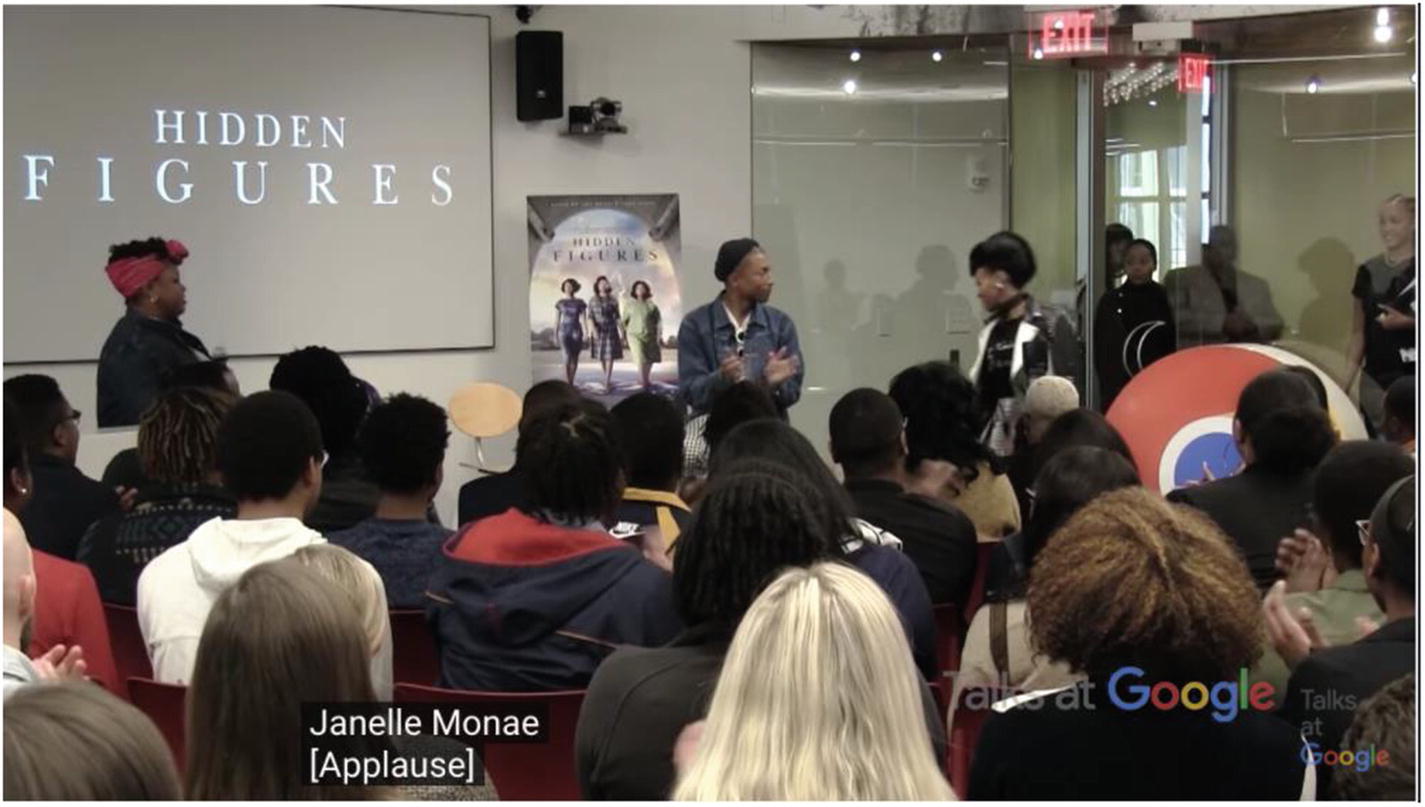
Example of live ambient sound captioning on YouTube
The preceding screenshot is taken from an interview between Janelle Monae and Pharrell Williams where the captions are activated.
Spoken words are displayed as expected, but we can also see ambient sounds like [Applause].
People with hearing impairment can now have the opportunity to get more information about the video than only dialogues.
Applause
Music playing
Laughter
It might not seem like much, but again, this is something we take for granted if we never have to think about the experience some people with disabilities have on these platforms.
Besides, thinking this feature has been implemented about 3 years ago already shows that a major technology company like Google has been actively exploring the potential of using machine learning with audio data and has been working on finding useful applications.
5.1.8 Limits
Now that we covered how to experiment with acoustic activity recognition in JavaScript and a few different applications, it is important to be aware of some of the limitations of such technology to have a better understanding of the real opportunities.
Quality and quantity of the data
If you decide to build a similar acoustic activity recognition system from scratch and write your own model without using transfer learning and the speech commands model from TensorFlow.js, you are going to need to collect a lot more sound samples than the minimum of 8 required when using Teachable Machine.
To gather a large amount of samples, you can either decide to record them yourself or buy them from a professional audio library.
Another important point is to make sure to check the quality of the data recorded. If you want to detect the sound of a vacuum cleaner running, for example, make sure that there is no background noise and that the vacuum cleaner can be clearly heard in the audio track.
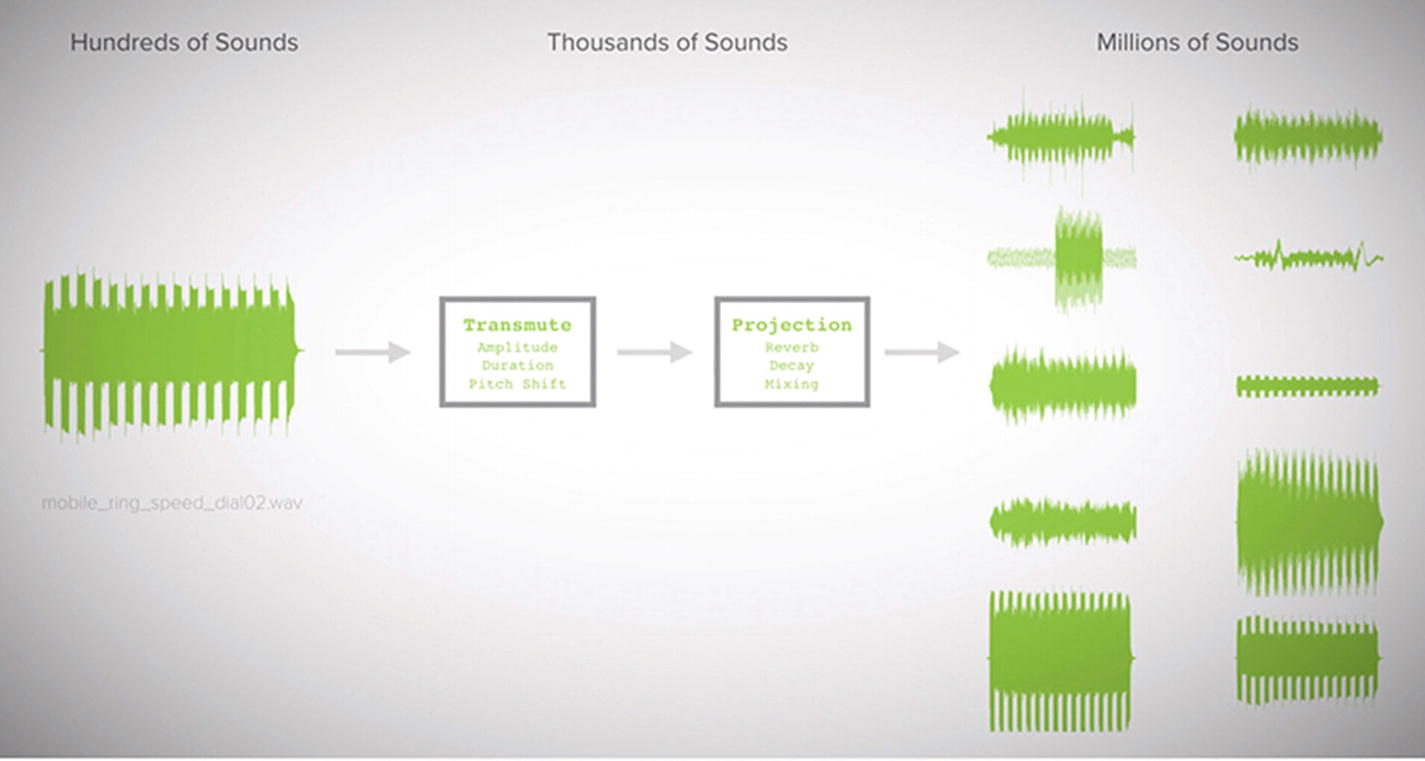
Transforming sounds. Gierad Laput, Karan Ahuja, Mayank Goel, and Chris Harrison. 2018. Ubicoustics: Plug-and-Play Acoustic Activity Recognition. In The 31st Annual ACM Symposium on User Interface Software and Technology (UIST '18). ACM, New York, NY, USA, 213-224. DOI: https://doi.org/10.1145/3242587.3242609
Single activity
At the moment, this technology seems to be efficient in recognizing a single sound at once.
For example, if you trained your model to recognize the sound of someone speaking as well as the sound of running water, if you placed your system in the kitchen and the user was speaking as well as washing the dishes, the activity predicted would only be the one with the highest score in the predictions returned.
However, as the system runs continuously, it would probably get confused between the two activities. It would probably alternate between “speaking” and “running water” until one of the activities stopped.
This would definitely become a problem if you built an application that can detect sounds produced by activities that can be executed at the same time.
For example, let’s imagine you usually play music while taking a shower and you built an application that can detect two activities: the sound of the shower running and speaking.
You want to be able to trigger a counter whenever it detects that the shower is running so you can avoid taking long showers and save water.
You also want to be able to lower the sound of your speakers when it detects that someone is speaking in the bathroom.
As these two activities can happen at the same time (you can speak while taking a shower), the system could get confused between the two activities and detect the shower running for a second and someone speaking the next.
As a result, it would start and stop the speakers one second, and start/stop the counter the next. This would definitely not create an ideal experience.
However, this does not mean that there is no potential in building applications using acoustic activity recognition, it only means that we would need to work around this limitation.
Besides, some research is being done around developing systems that can handle the detection of multiple activities at once. We will look into it in the next few pages.
User experience
When it comes to user experience, there are always some challenges with new technologies like this one.
First of all, privacy.
Having devices listening to users always raises some concerns about where the data is stored, how it is used, is it secure, and so on.
Considering that some companies releasing Internet of Things devices do not always put security first in their products, these concerns are very normal.
As a result, the adoption of these devices by consumers can be slower than expected.
Not only privacy and security should be baked in these systems, it should also be communicated to users in a clear way to reassure them and give them a sense of empowerment over their data.
Secondly, another challenge is in teaching users new interactions .
For example, even though most modern phones now have voice assistants built-in, getting information from asking Siri or Google is not the primary interaction.
This could be for various reasons including privacy and limitations of the technology itself, but people also have habits that are difficult to change.
Besides, considering the current imperfect state of this technology, it is easy for users to give up after a few trials, when they do not get the response they were looking for.
A way to mitigate this would be to release small applications to analyze users’ reactions to them and adapt. The work Apple did by implementing the water detection in their new watchOS is an example of that.
Finally, one of the big challenges of creating a custom acoustic activity recognition system is in the collection of sample data and training by the users.
Even though you can build and release an application that detects the sound of a faucet running because there’s a high probability that it produces a similar sound in most homes, some other sounds are not so common.
As a result, empowering users to use this technology would involve letting them record their own samples and train the model so they can have the opportunity to have a customized application.
However, as machine learning algorithms need to be trained with a large amount of data to have a chance to produce accurate predictions, it would require a lot of effort from users and would inevitably not be successful.
Luckily, some researchers are experimenting with solutions to these problems.
Now, even though there are some limits to this technology, solutions also start to appear.
For example, in terms of protecting users’ privacy, an open source project called Project Alias by Bjørn Karmann attempts to empower voice assistant users.
This project is a DIY add-on made with a Raspberry Pi microcontroller, a speaker, and microphone module, all in a 3D printed enclosure that aims at blocking voice assistants like Amazon Alexa and Google Home from continuously listening to people.
Through a mobile application, users can train Alias to react on a custom wake word or sound. Once it is trained, Alias can take control over the home assistant and activate it for you. When you don’t use it, the add-on will prevent the assistant from listening by emitting white noise into their microphone.
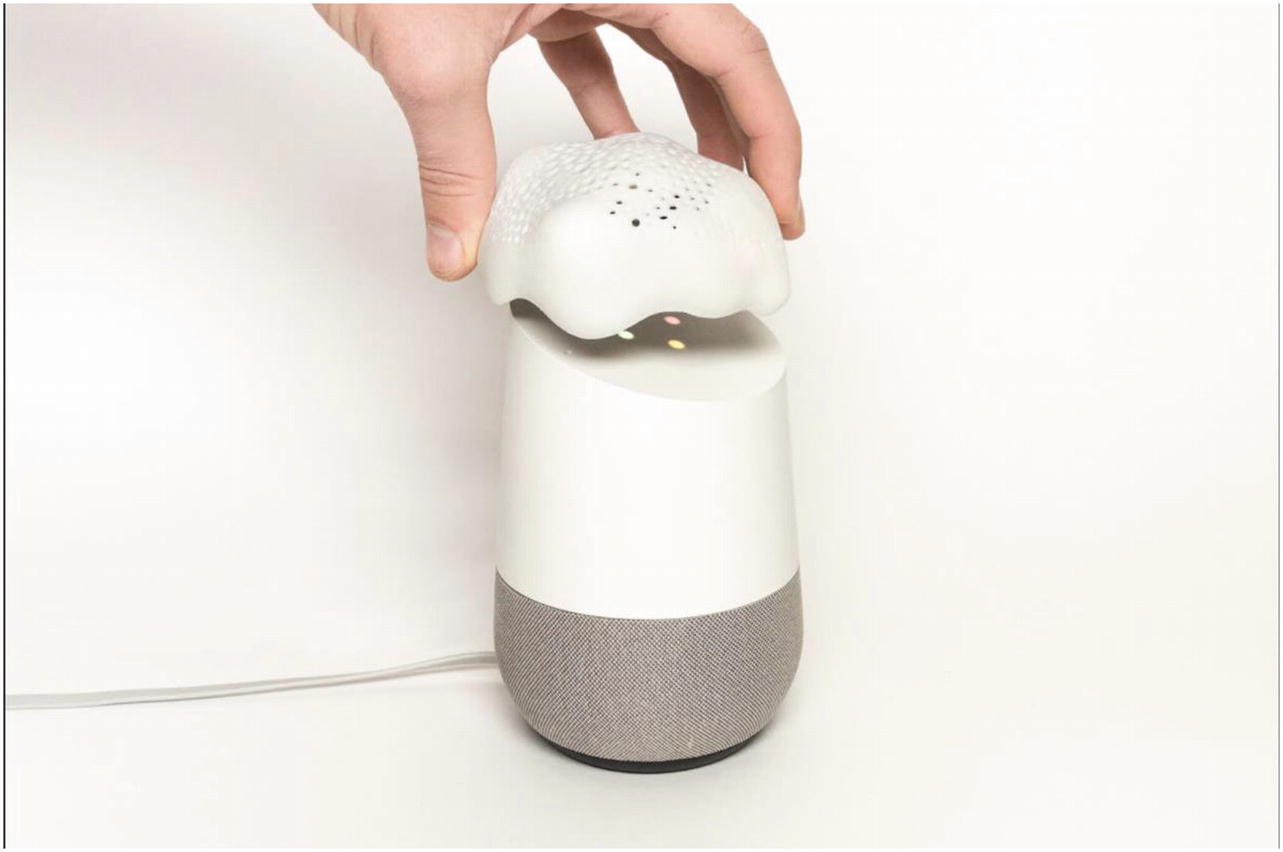
Project Alias. Source: https://bjoernkarmann.dk/project_alias

Project Alias components. Source: https://bjoernkarmann.dk/project_alias
Another project, called Synthetic Sensors, aims at creating a system that can accurately predict multiple sounds at once.
Developed by a team of researchers at the Carnegie Mellon University, this project involves a custom-built piece of hardware made of multiple sensors, including an accelerometer, microphone, temperature sensor, motion sensor, and color sensor.
Microwave door closed
Wood saw running
Kettle on
Faucet running
Toilet flushing
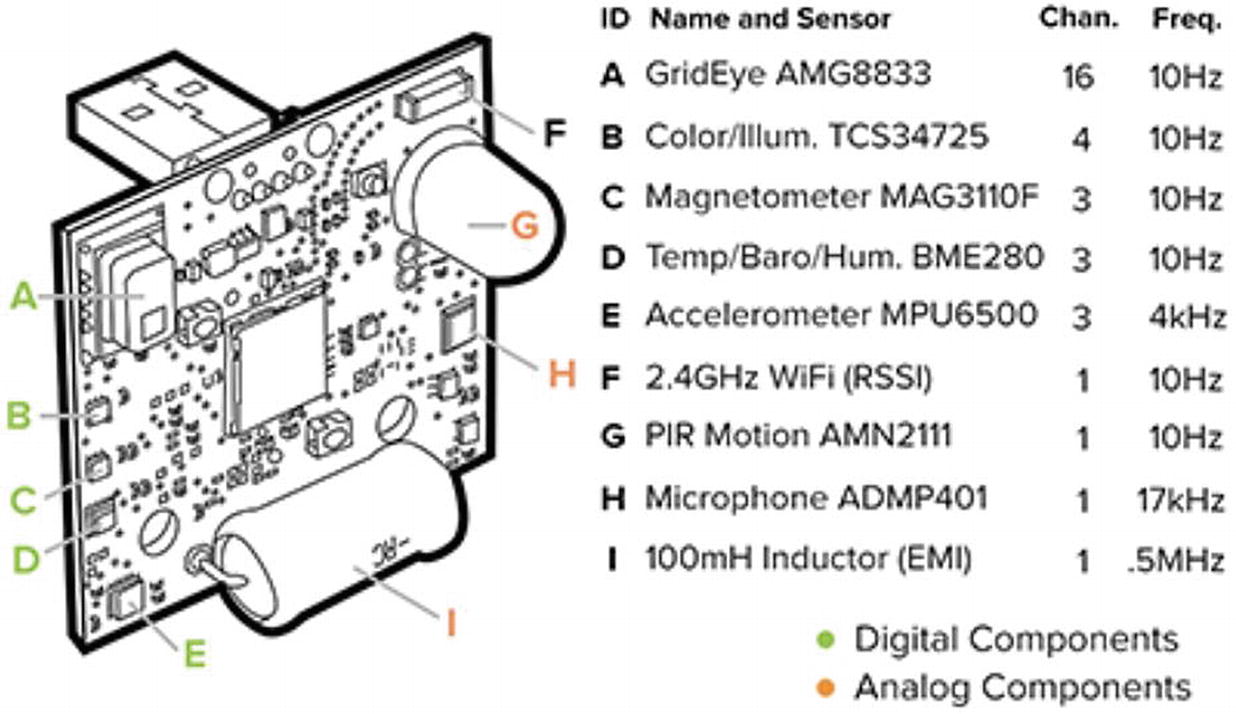
Project Synthetic Sensors hardware. Gierad Laput, Yang Zhang, and Chris Harrison. 2017. Synthetic Sensors: Towards General-Purpose Sensing. In Proceedings of the 2017 CHI Conference on Human Factors in Computing Systems (CHI '17). ACM, New York, NY, USA, 3986-3999. DOI: https://doi.org/10.1145/3025453.3025773.

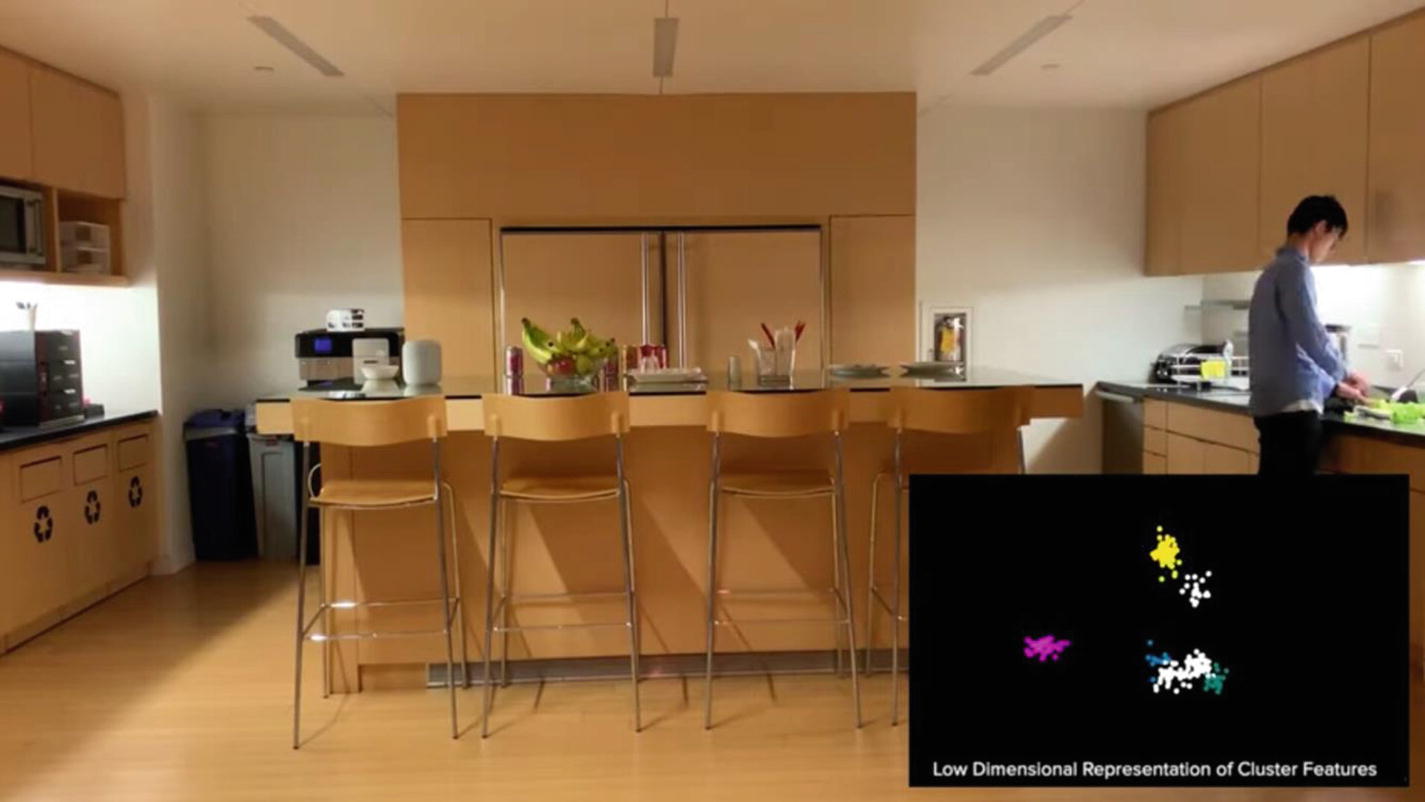
Project Synthetic Sensors example of spectrograms and activities recognition. Gierad Laput, Yang Zhang, and Chris Harrison. 2017. Synthetic Sensors: Towards General-Purpose Sensing. In Proceedings of the 2017 CHI Conference on Human Factors in Computing Systems (CHI '17). ACM, New York, NY, USA, 3986-3999. DOI: https://doi.org/10.1145/3025453.3025773
Finally, in terms of user experience, a research project called Listen Learner aims at allowing users to collect data and train a model to recognize custom sounds, with minimal effort.
The full name of the project is Listen Learner, Automatic Class Discovery and One-Shot Interaction for Activity Recognition.
It aims at providing high classification accuracy, while minimizing user burden, by continuously listening to sounds in its environment, classifying them by cluster of similar sounds, and asking the user what the sound is after having collected enough similar samples.
Wu, J., Harrison, C., Bigham, J. and Laput, G. 2020. Automated Class Discovery and One-Shot Interactions for Acoustic Activity Recognition. In Proceedings of the 38th Annual SIGCHI Conference on Human Factors in Computing Systems. CHI '20. ACM, New York, NY. Source: www.chrisharrison.net/index.php/Research/ListenLearner
5.2 Body and movement tracking
After looking at how to use machine learning with audio data, let’s look into another type of input, that is, body tracking.
In this section, we are going to use data from body movements via the webcam using three different Tensorlfow.js models.
5.2.1 Facemesh

Example of visualization of face tracking with Facemesh. source: https://github.com/tensorflow/tfjs-models/tree/master/facemesh

Map of the keypoints. Source: https://github.com/tensorflow/tfjs-models/tree/master/facemesh
The main difference between this face recognition model and other face tracking JavaScript libraries like face-tracking.js is that the TensorFlow.js model intends to approximate the surface geometry of a human face and not only the 2D position of some key points.

Key points using the webcam and in a 3D visualization. Source: https://storage.googleapis.com/tfjs-models/demos/facemesh/index.html
Loading the model
Importing TensorFlow.js and Facemesh in an HTML file
As we are going to use the video feed from the webcam to detect faces, we also need to add a video element to our file.
Core HTML code needed
Load the model and set up the webcam feed
Predictions
Function to find face landmarks

Output of the landmarks in the console
Output of loop statement in the console
As we can see in the preceding two screenshots, the predictions returned contain an important amount of information.
The annotations are organized by landmark areas, in alphabetical order and containing arrays of x, y, and z coordinates.
The bounding box contains two main keys, bottomRight and topLeft, to indicate the boundaries of the position of the detected face in the video stream. These two properties contain an array of only two coordinates, x and y, as the z axis is not useful in this case.
Finally, the mesh and scaledMesh properties contain all coordinates of the landmarks and are useful to render all points in 3D space on the screen.
Full code sample
Full JavaScript code sample
Project
To put this code sample into practice, let’s build a quick prototype to allow users to scroll down a page by tilting their head back and forth.
We are going to be able to reuse most of the code written previously and make some small modifications to trigger a scroll using some of the landmarks detected.
The specific landmark we are going to use to detect the movement of the head is the lipsLowerOuter and more precisely its z axis.
Looking at all the properties available in the annotations object, using the lipsLowerOuter one is the closest to the chin, so we can look at the predicted changes of z coordinate for this area to determine if the head is tilting backward (chin moving forward) or forward (chin moving backward).
Triggering scroll when z axis changes
In this code sample, I declare a variable that I call zAxis to store the value of the z coordinate I want to track. To get this value, I look into the array of coordinates contained in the lipsLowerOuter property of the annotations object.

Annotations returned with lipsLowerOuter values
This is why the code sample shown just earlier was accessing the z coordinates using predictions[0].annotations.lipsLowerOuter[9][2].
I decided to access the last element ([9]) of the lipsLowerOuter property and its third value ([2]), the z coordinate of the section.
The value 5 was selected after trial and error and seeing what threshold would work for this particular project. It is not a standard value that you will need to use every time you use the Facemesh model. Instead, I decided it was the correct threshold for me to use after logging the variable zAxis and seeing its value change in the browser’s console as I was tilting my head back and forth.
Then, assuming that you declared scrollPosition earlier in the code and set it to a value (I personally set it to 0), a “scroll up” event will happen when you tilt your head backward and “scroll down” when you tilt your head forward.
Finally, I set the property behavior to “smooth” so we have some smooth scrolling happening, which, in my opinion, creates a better experience.
If you did not add any content to your HTML file, you won’t see anything happen yet though, so don’t forget to add enough text or images to be able to test that everything is working!
Complete JavaScript code
This model is specialized in detecting face landmarks. Next, we’re going to look into another one, to detect keypoints in a user’s hands.
5.2.2 Handpose
The second model we are going to experiment with is called Handpose. This model specializes in recognizing the position of 21 3D keypoints in the user’s hands.
Keypoints from Handpose visualized. Source: https://github.com/tensorflow/tfjs-models/tree/master/handpose

Keypoints from Handpose visualized. Source: https://github.com/tensorflow/tfjs-models/tree/master/handpose
To implement this, the lines of code will look very familiar if you have read the previous section.
Loading the model
Import TensorFlow.js and the Handpose model
Similarly to the way the Facemesh model works, we are going to use the video stream as input so we also need to add a video element in your main HTML file.
Then, in your JavaScript file, we can use the same functions we wrote before to set up the camera and load the model. The only line we will need to change is the line where we call the load method on the model.
As we are using Handpose instead of Facemesh, we need to replace facemesh.load() with handpose.load().
Code to set up to load the model and video input
Predicting key points
Once the model is loaded and the webcam feed is set up, we can run predictions and detect keypoints when a hand is placed in front of the webcam.
To do this, we can copy the main() function we created when using Facemesh, but replace the expression model.estimateFaces with model.estimateHands.
Run predictions and log the output
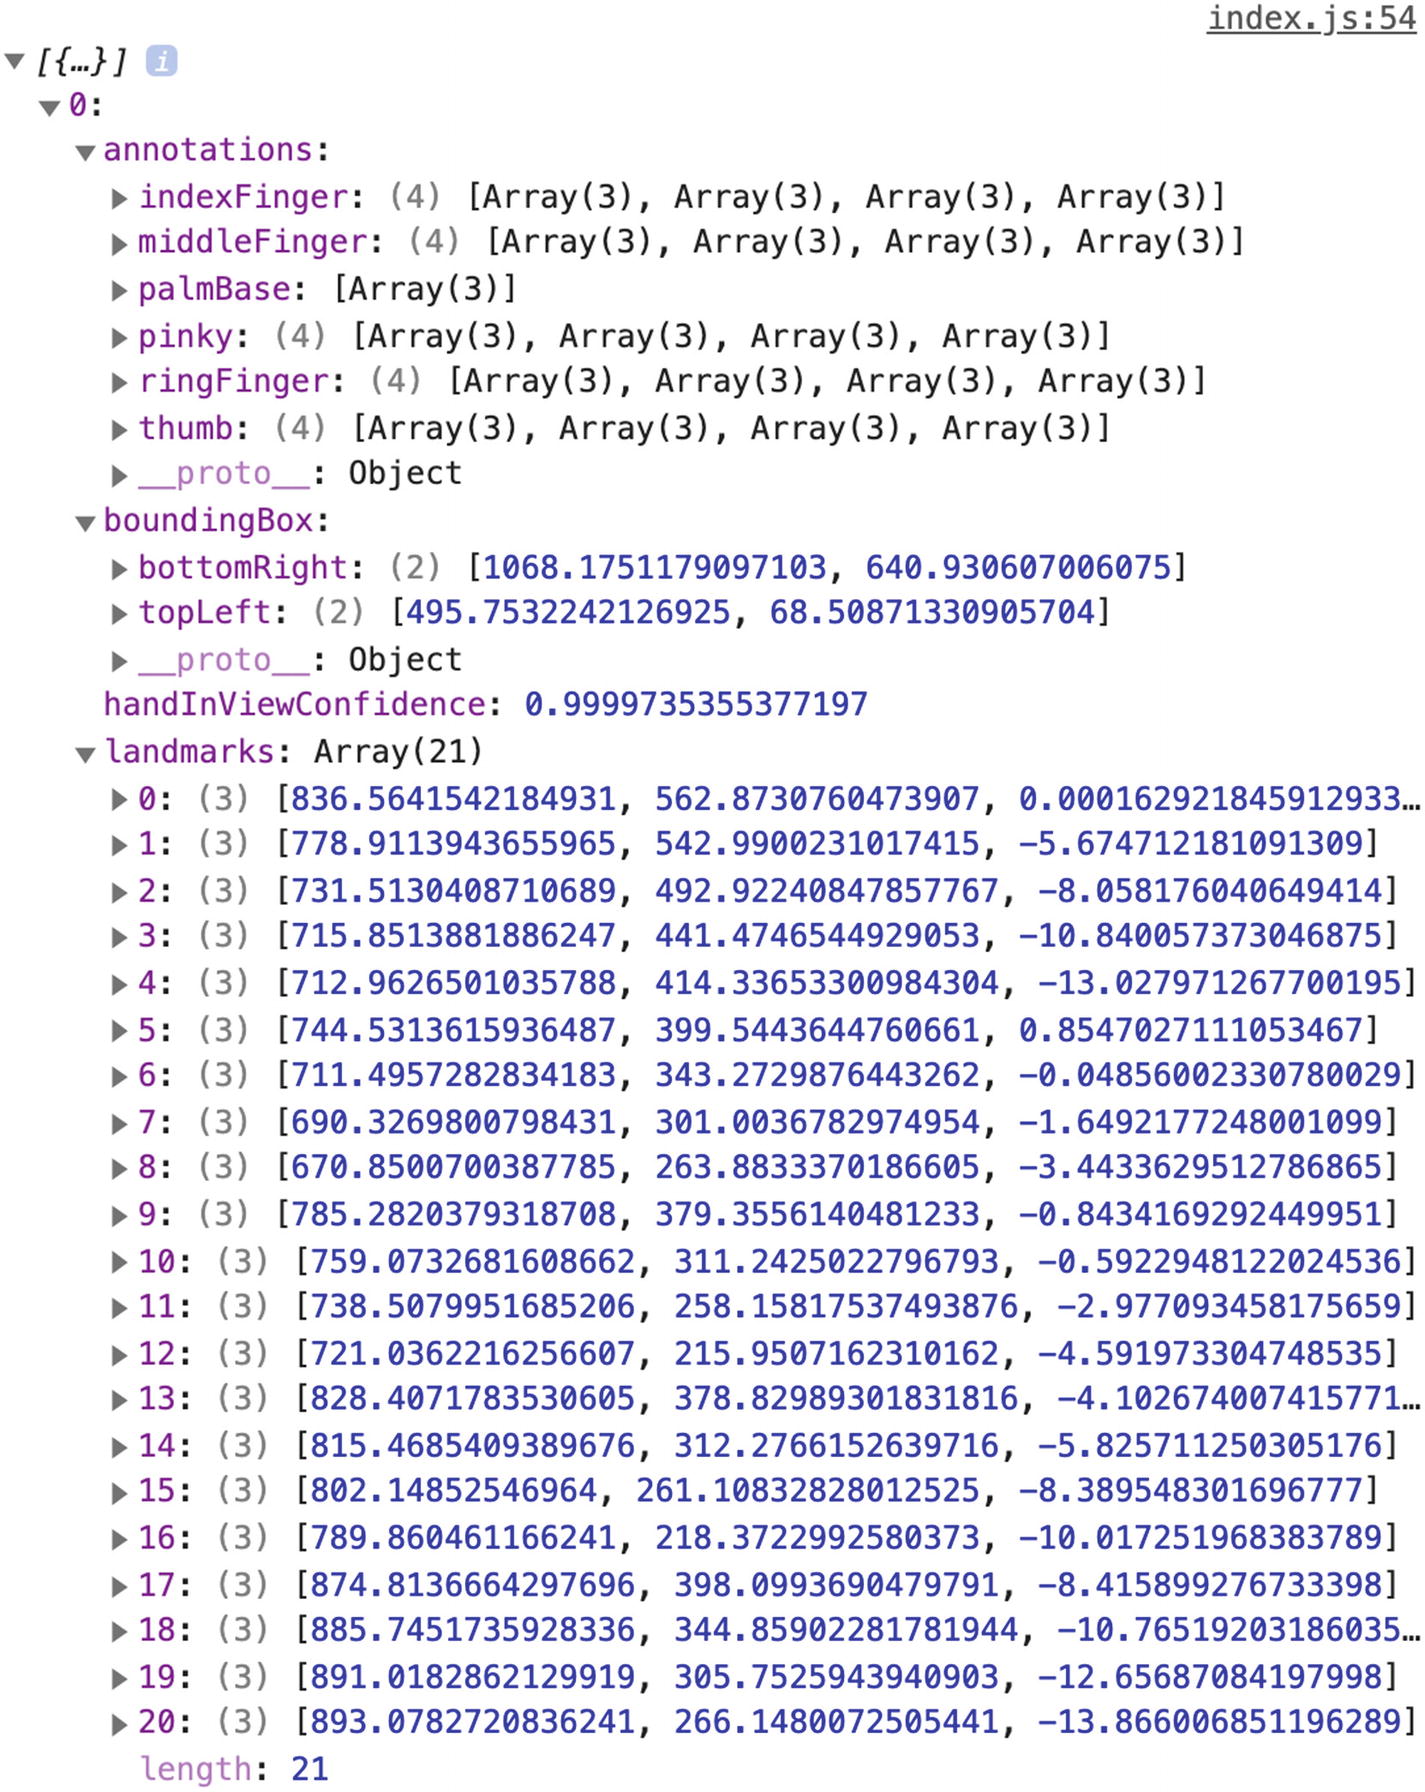
Output when detecting hands
We can see that the format of this data is very similar to the one when using the Facemesh model!
This makes it easier and faster to experiment as you can reuse code samples you have written in other projects. It allows developers to get set up quickly to focus on experimenting with the possibilities of what can be built with such models, without spending too much time in configuration.
The main differences that can be noticed are the properties defined in annotations, the additional handInViewConfidence property, and the lack of mesh and scaledMesh data.
The handInViewConfidence property represents the probability of a hand being present. It is a floating value between 0 and 1. The closer it is to 1, the more confident the model is that a hand is found in the video stream.
At the moment of writing this book, this model is able to detect only one hand at a time. As a result, you cannot build applications that would require a user to use both hands at once as a way of interacting with the interface.
Full code sample
Full code sample
Project
To experiment with the kind of applications that can be built with this model, we’re going to build a small “Rock Paper Scissors” game.
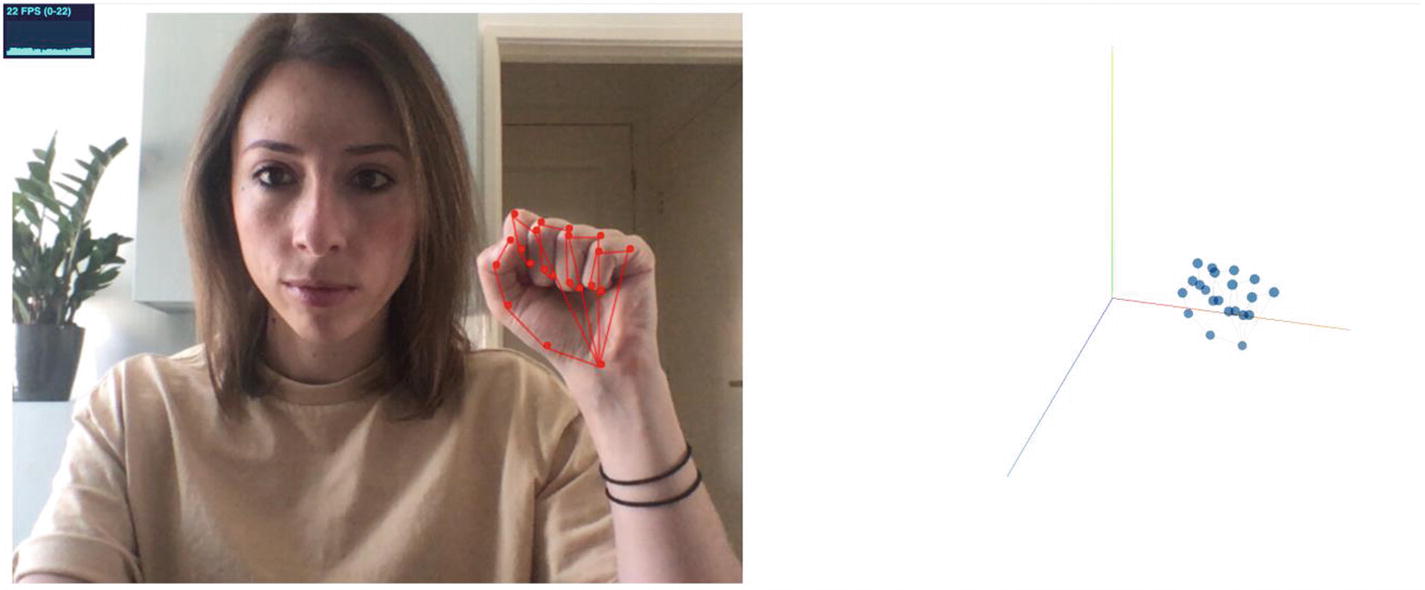
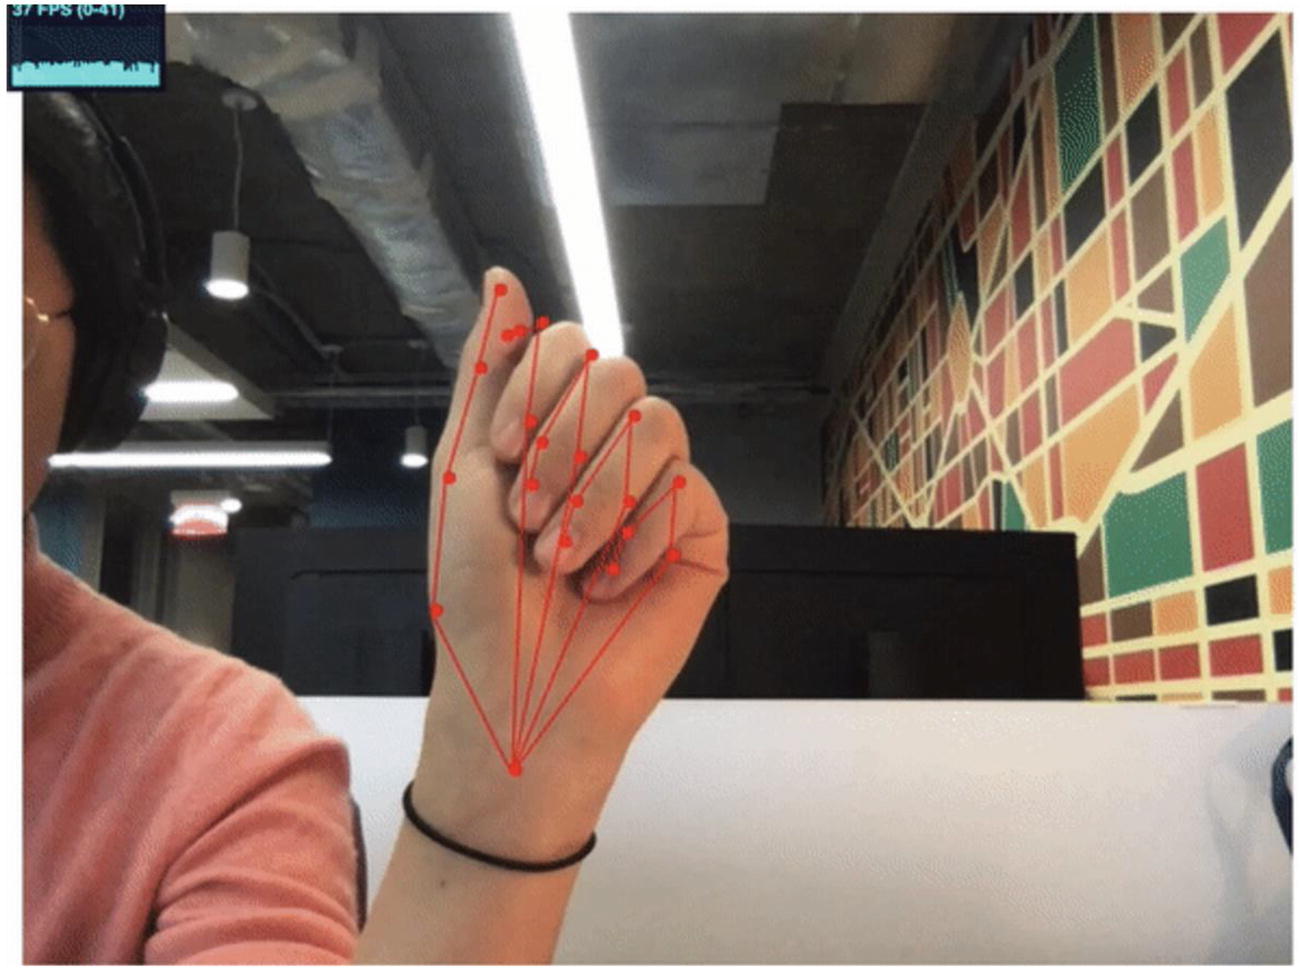
“Rock” gesture visualized
The preceding screenshot represents the “rock” gesture. As we can see, all fingers are folded so the tips of the fingers should be further in their z axis than the keypoint at the end of the first phalanx bone for each finger.
Otherwise, we can also consider that the y coordinate of the finger tips should be higher than the one of the major knuckles, keeping in mind that the top of the screen is equal to 0 and the lower the keypoint, the higher the y value.
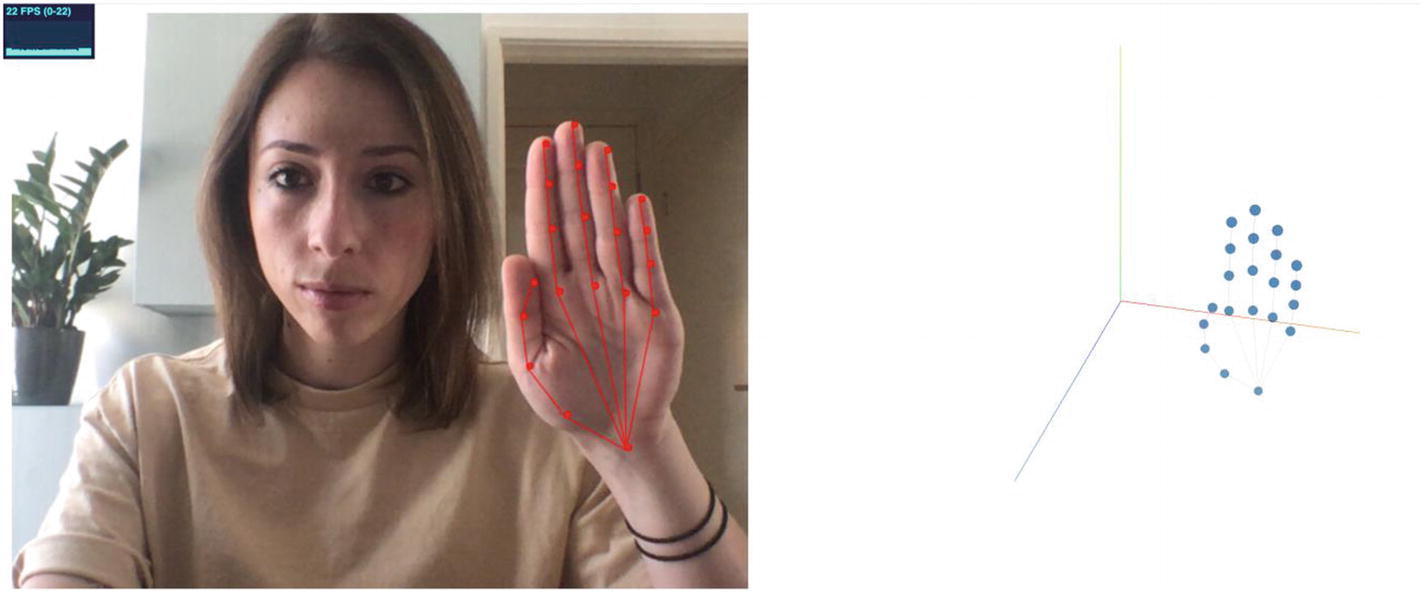
“Paper” gesture visualized
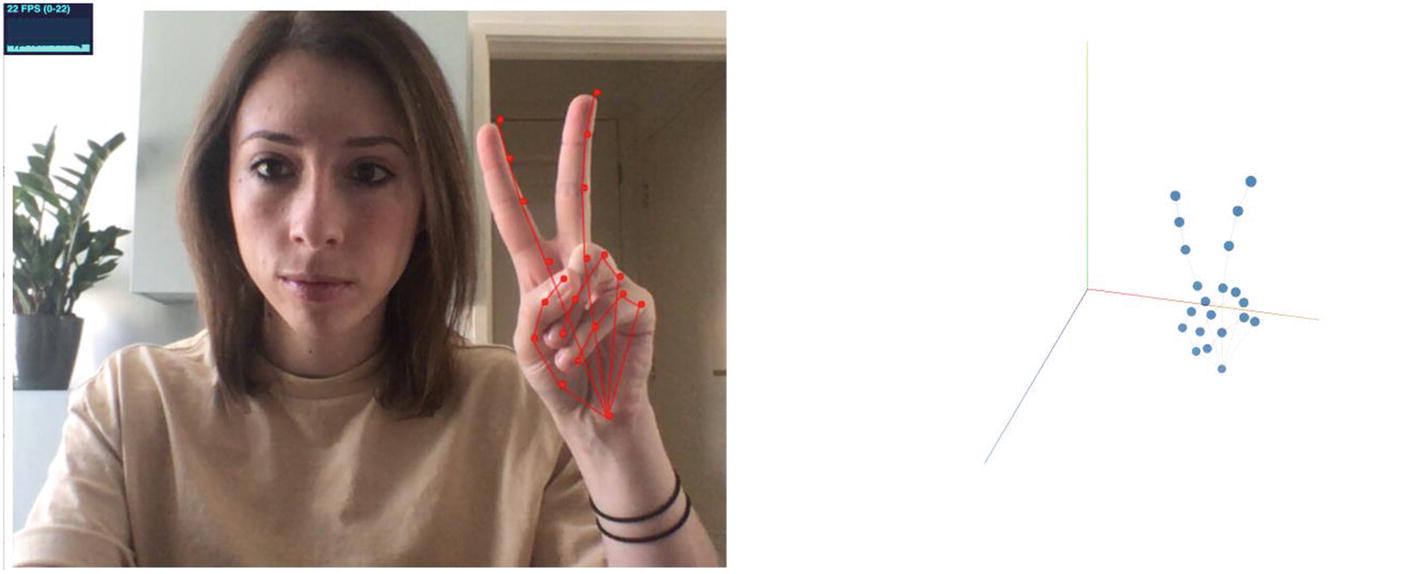
“Scissors” gesture visualized
Finally, the “scissors” gesture could be recognized by looking at the space in x axis between the index finger and the middle finger, as well as the y coordinate of the other fingers.
If the y value of the tip of the ring finger and little finger is lower than their base, they are probably folded.
Reusing the code samples we have gone through in the previous sections, let’s look into how we can write the logic to recognize and differentiate these gestures.
Logic to check if the index finger is folded
We can start by declaring two variables, one to store the y position of the base of the index finger and one for the tip of the same finger.
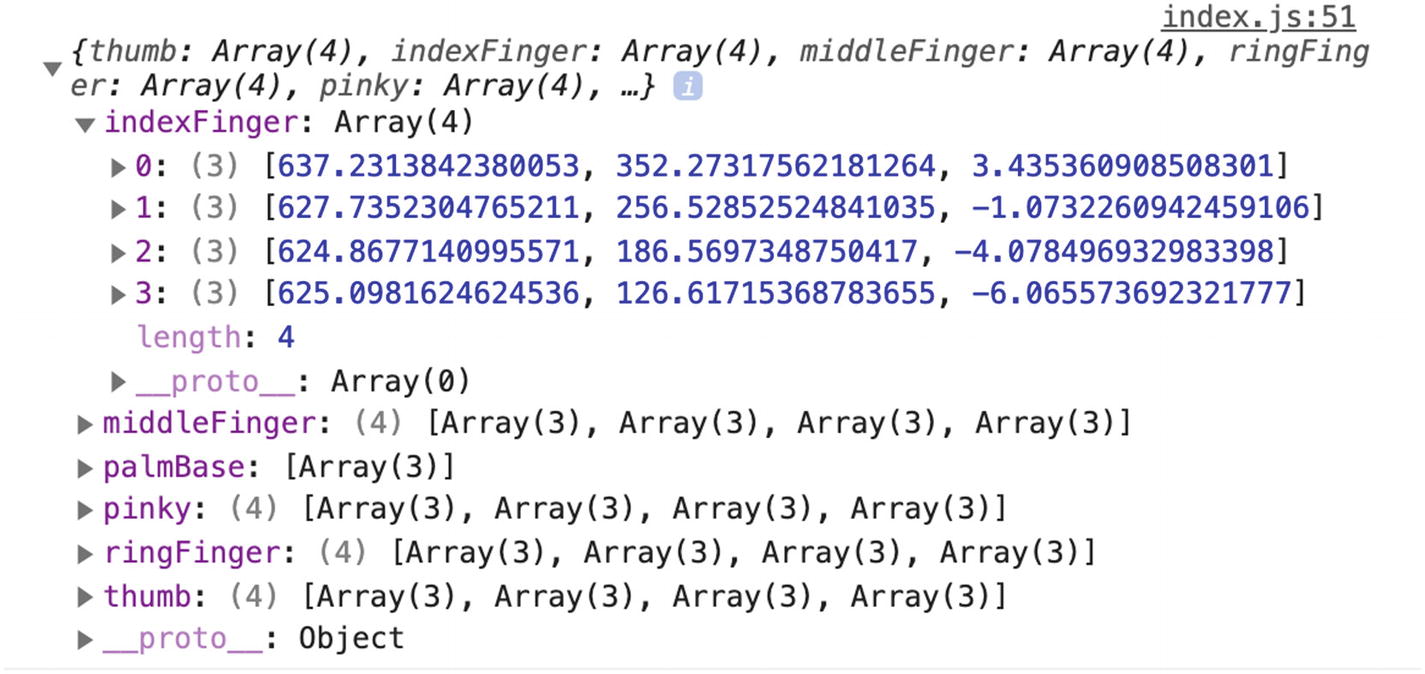
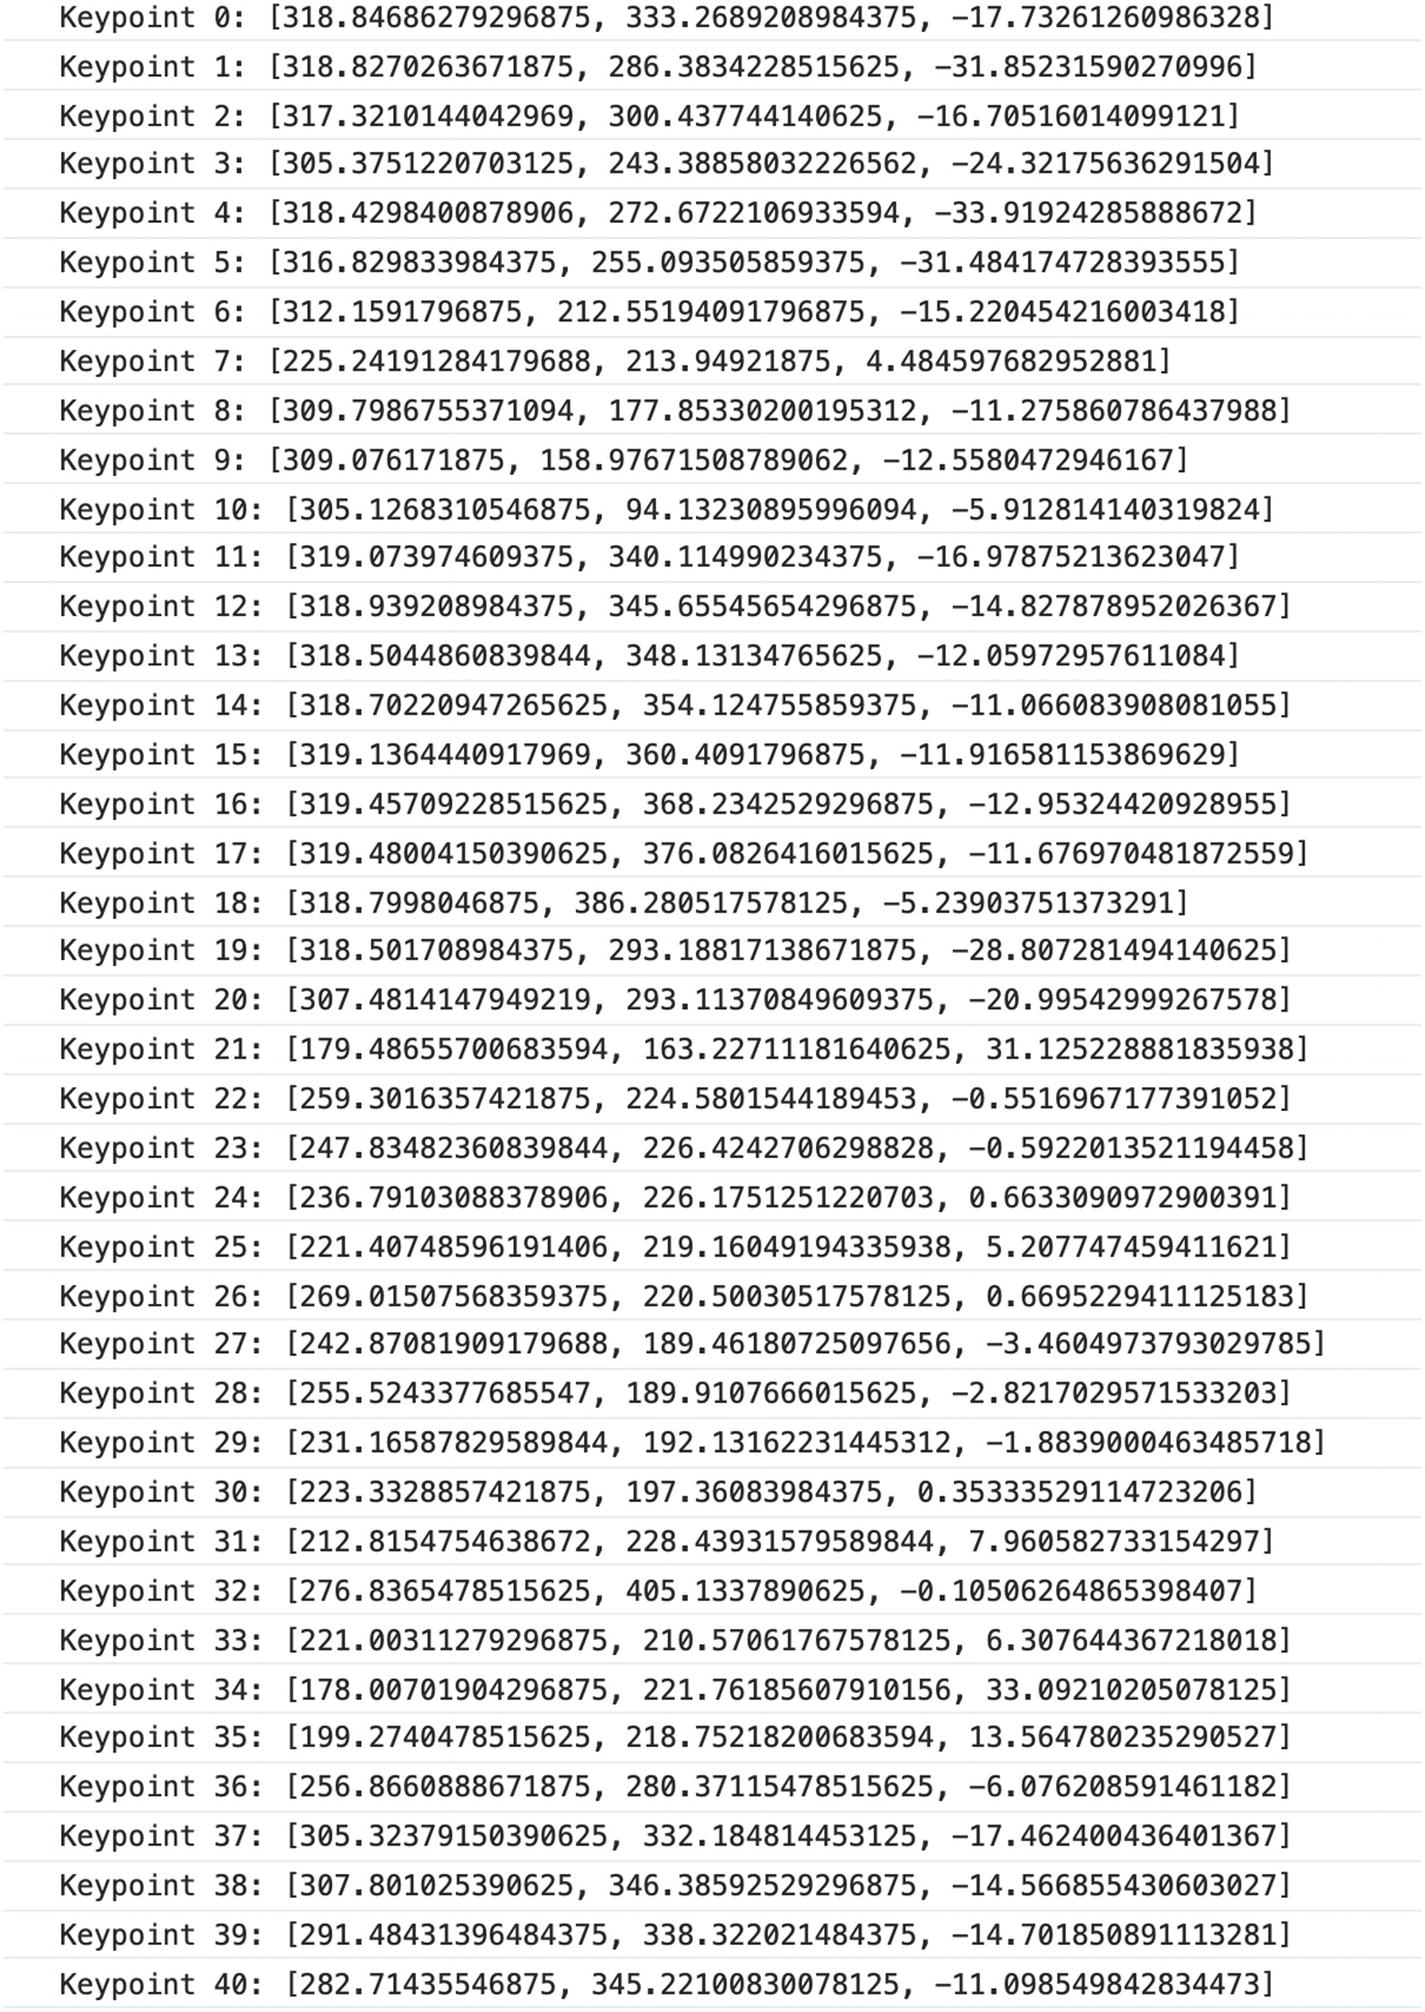
Output data when a hand is detected
The y coordinate in the first array has a value of about 352.27 and the y coordinate in the last array has a value of about 126.62, which is lower, so we can deduce that the first array represents the position of the base of the index finger, and the last array represents the keypoint at the tip of that finger.
We can test that this information is correct by writing the if statement shown earlier that logs the message “index finger folded” if the value of indexTip is higher than the one of indexBase.
And it works!
If you test this code by placing your hand in front of the camera and switch from holding your index finger straight and then folding it, you should see the message being logged in the console!
If we wanted to keep it really quick and simpler, we could stop here and decide that this single check determines the “rock” gesture. However, if we would like to have more confidence in our gesture, we could repeat the same process for the middle finger, ring finger, and little finger.
The thumb would be a little different as we would check the difference in x coordinate rather than y, because of the way this finger folds.
For the “paper” gesture, as all fingers are extended, we could check that the tip of each finger has a smaller y coordinate than the base.
Check the y coordinate of each finger for the “paper” gesture
We start by storing the coordinates we are interested in into variables and then compare their values to set the extended states to true or false.
If all fingers are extended, we log the message “paper gesture!”.
If everything is working fine, you should be able to place your hand in front of the camera with all fingers extended and see the logs in the browser’s console.

Screenshot of hand detected in the webcam feed and paper gesture logged in the console
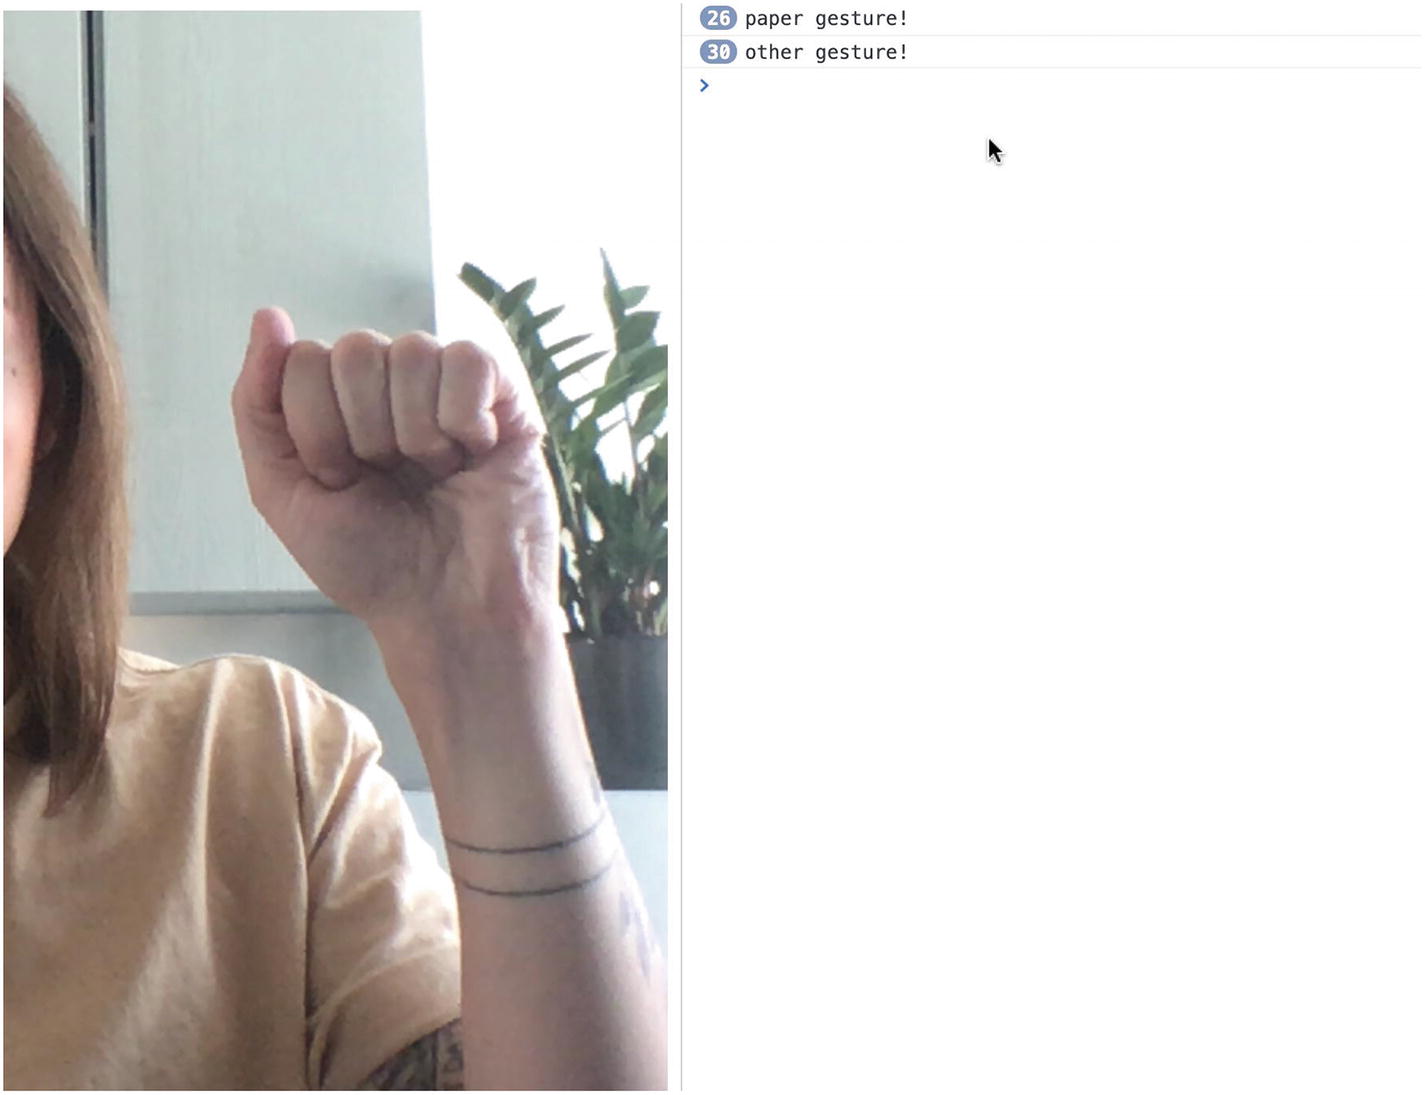
Screenshot of hand detected in the webcam feed and other gesture logged in the console
Check the difference in x coordinate for the index and middle finger tips

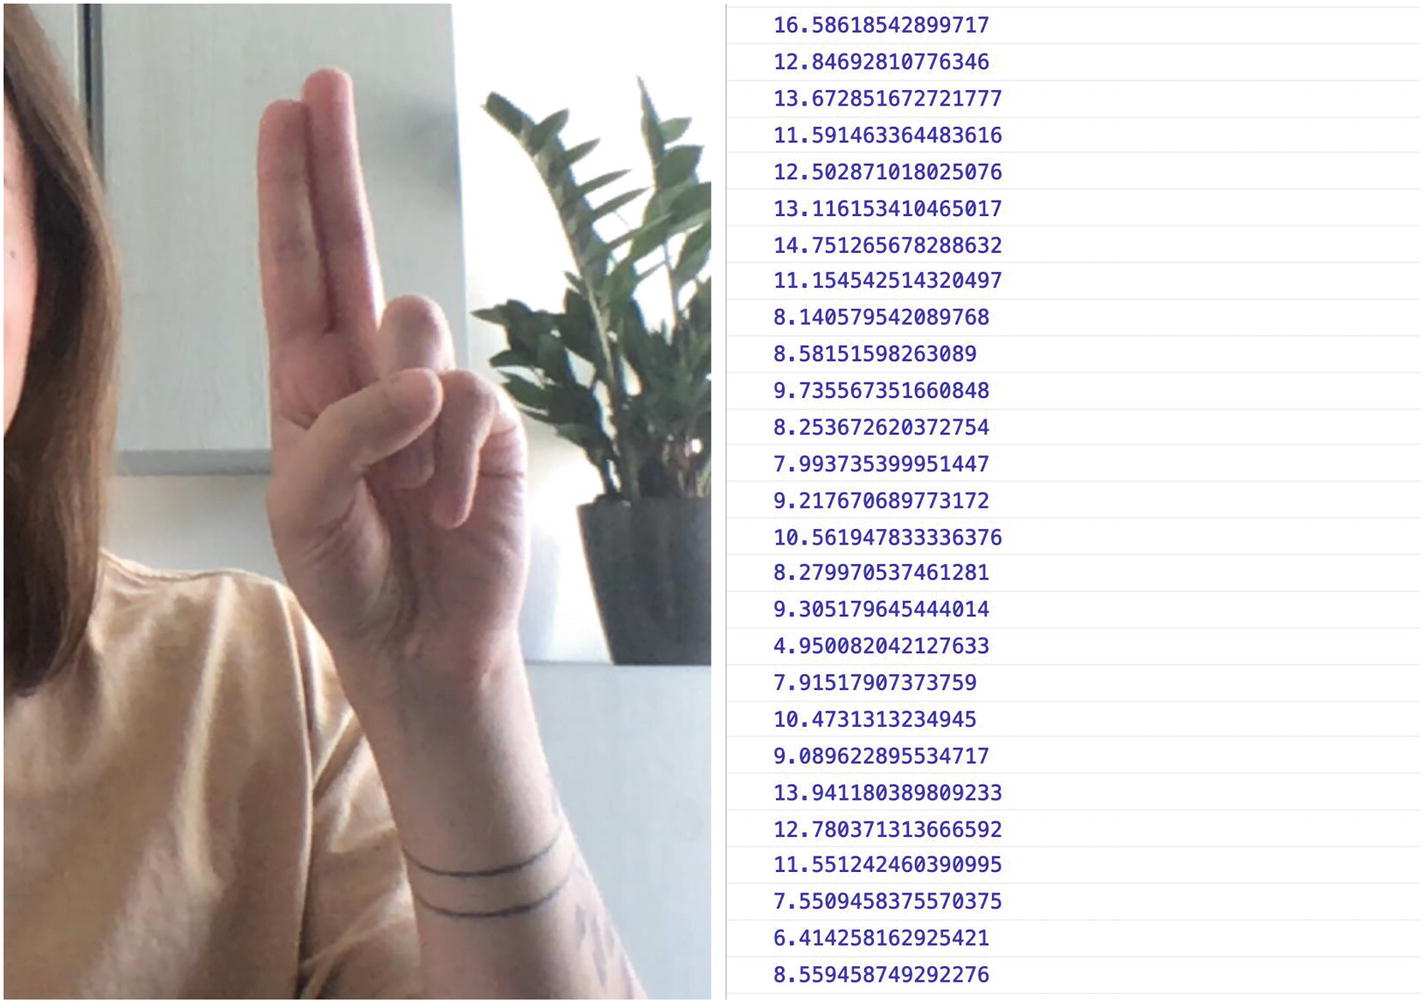
Output data when executing a “scissors” gesture
Output data when executing another gesture
We can see that when we do the “scissors” gesture, the value of the diffFingersX variable is much higher than when the two fingers are close together.
Looking at this data, we could decide that our threshold could be 100. If the value of diffFingersX is more than 100 and the ring and little fingers are folded, the likelihood of the gesture being “scissors” is very high.
Detect “scissors” gesture
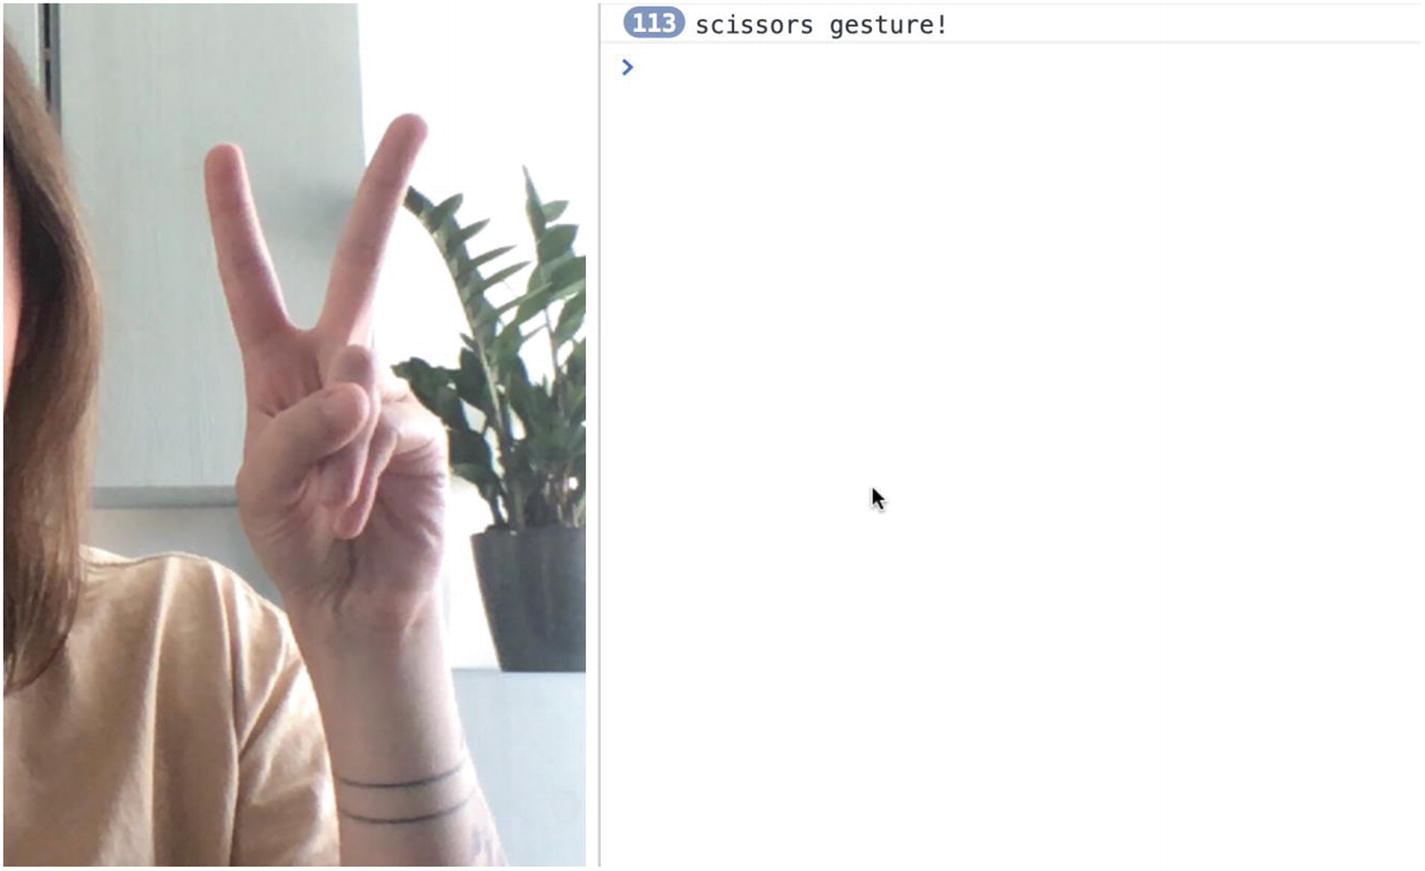
Screenshot of “scissors” gesture detection working
Logic for detecting all gestures
If everything works properly, you should see the correct message being logged in the console when you do each gesture!
Once you have verified that the logic works, you can move on from using console.log and use this to build a game or use these gestures as a controller for your interface, and so on.
The most important thing is to understand how the model works, get familiar with building logic using coordinates so you can explore the opportunities, and be conscious of some of the limits.
5.2.3 PoseNet
Finally, the last body tracking model we are going to talk about is called PoseNet.
PoseNet is a pose detection model that can estimate a single pose or multiple poses in an image or video.
Similarly to the Facemesh and Handpose models, PoseNet tracks the position of keypoints in a user’s body.
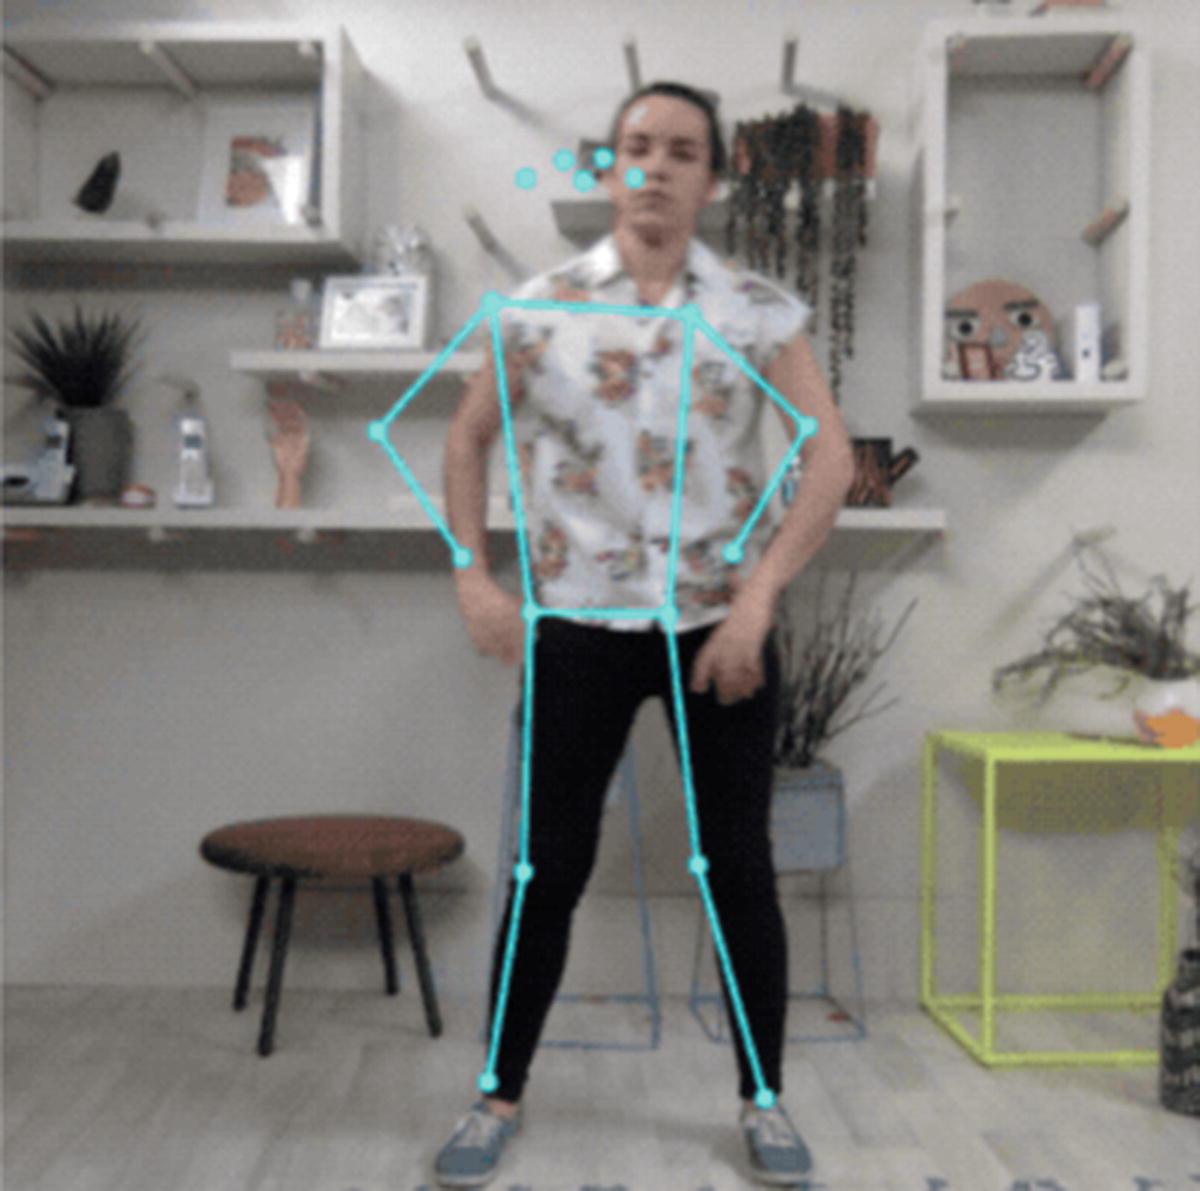
Visualization of the keypoints detected by PoseNet. Source: https://github.com/tensorflow/tfjs-models/tree/master/posenet
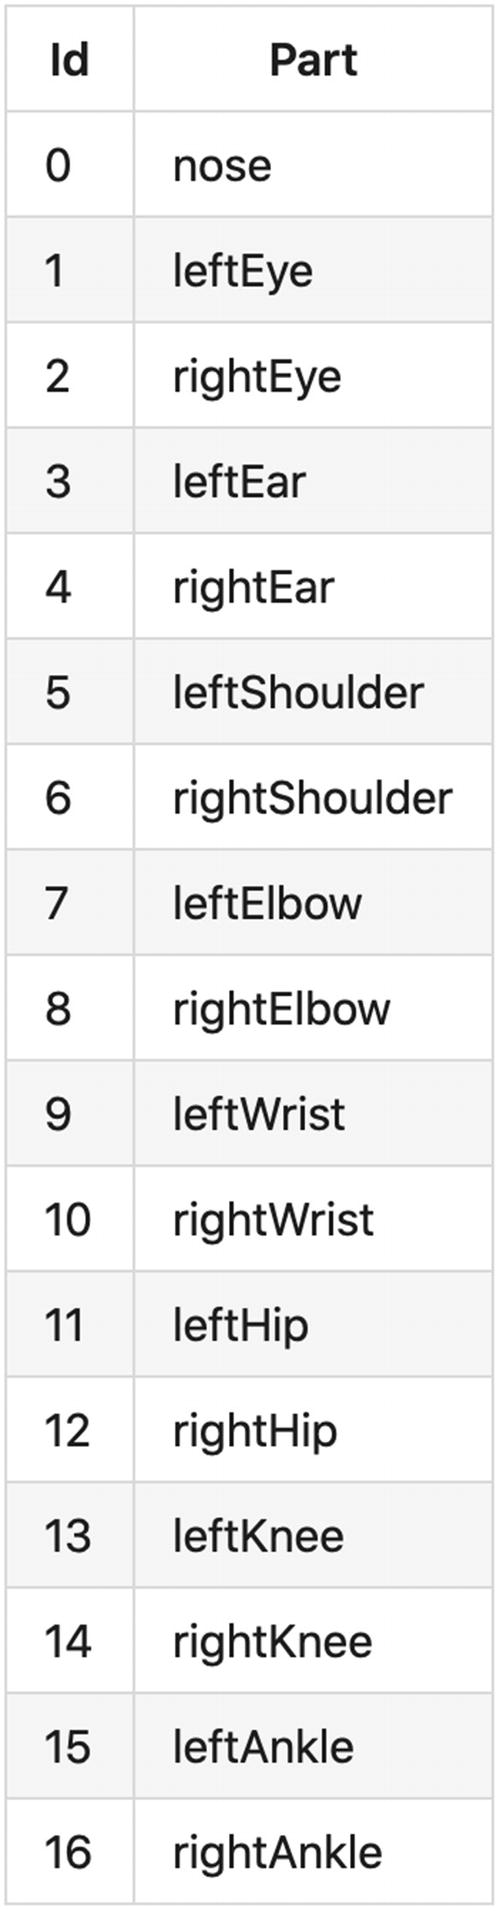
List of keypoints and their ID. Source: https://github.com/tensorflow/tfjs-models/tree/master/posenet
Even though this model is also specialized in tracking a person’s body using the webcam feed, using it in your code is a little bit different from the two models we covered in the previous sections.
Importing and loading the model
Import TensorFlow.js and the PoseNet model in HTML
Loading the model in JavaScript
This default way of loading PoseNet uses a faster and smaller model based on the MobileNetV1 architecture. The trade-off for speed is a lower accuracy.
Alternative ways of loading the model
Loading the model using the ResNet50 architecture
If you feel a bit confused by the different parameters, don’t worry, as you get started, using the default ones provided is completely fine. If you want to learn more about them, you can find more information in the official TensorFlow documentation.
Once the model is loaded, you can focus on predicting poses.
Predictions
Predicting single poses
The image parameter can either be some imageData, an HTML image element, an HTML canvas element, or an HTML video element. It represents the input image you want to get predictions on.
The flipHorizontal parameter indicates if you would like to flip/mirror the pose horizontally. By default, its value is set to false.
If you are using videos, it should be set to true if the video is by default flipped horizontally (e.g., when using a webcam).
The preceding code sample will set the variable pose to a single pose object that will contain a confidence score and an array of keypoints detected, with their 2D coordinates, the name of the body part, and a probability score.
Complete object returned as predictions
Predicting multiple poses
maxDetections indicates the maximum number of poses we’d like to detect. The value 5 is the default but you can change it to more or less.
scoreThreshold indicates that you only want instances to be returned if the score value at the root of the object is higher than the value set. 0.5 is the default value.
nmsRadius stands for nonmaximum suppression and indicates the amount of pixels that should separate multiple poses detected. The value needs to be strictly positive and defaults to 20.
Output array when detecting multiple poses
Full code sample
HTML code to detect poses in an image
JavaScript code
HTML code to detect poses in a video
JavaScript code to detect poses in a video from the webcam
Visualizing keypoints
So far, we’ve mainly used console.log to be able to see the results coming back from the model. However, you might want to visualize them on the page to make sure that the body tracking is working and that the keypoints are placed in the right position.
To do this, we are going to use the Canvas API.
We need to start by adding a HTML canvas element to the HTML file. Then, we can create a function that will access this element and its context, detect the poses, and draw the keypoints.
Accessing the canvas element
Start the detection, draw the webcam feed on a canvas element, and render the keypoints
Some helper functions to draw the keypoints onto the canvas element
The poseDetectionFrame function should be called once the video and model are loaded.
Complete HTML code to visualize keypoints
JavaScript code to visualize keypoints in index.js
JavaScript code to visualize keypoints in utils.js
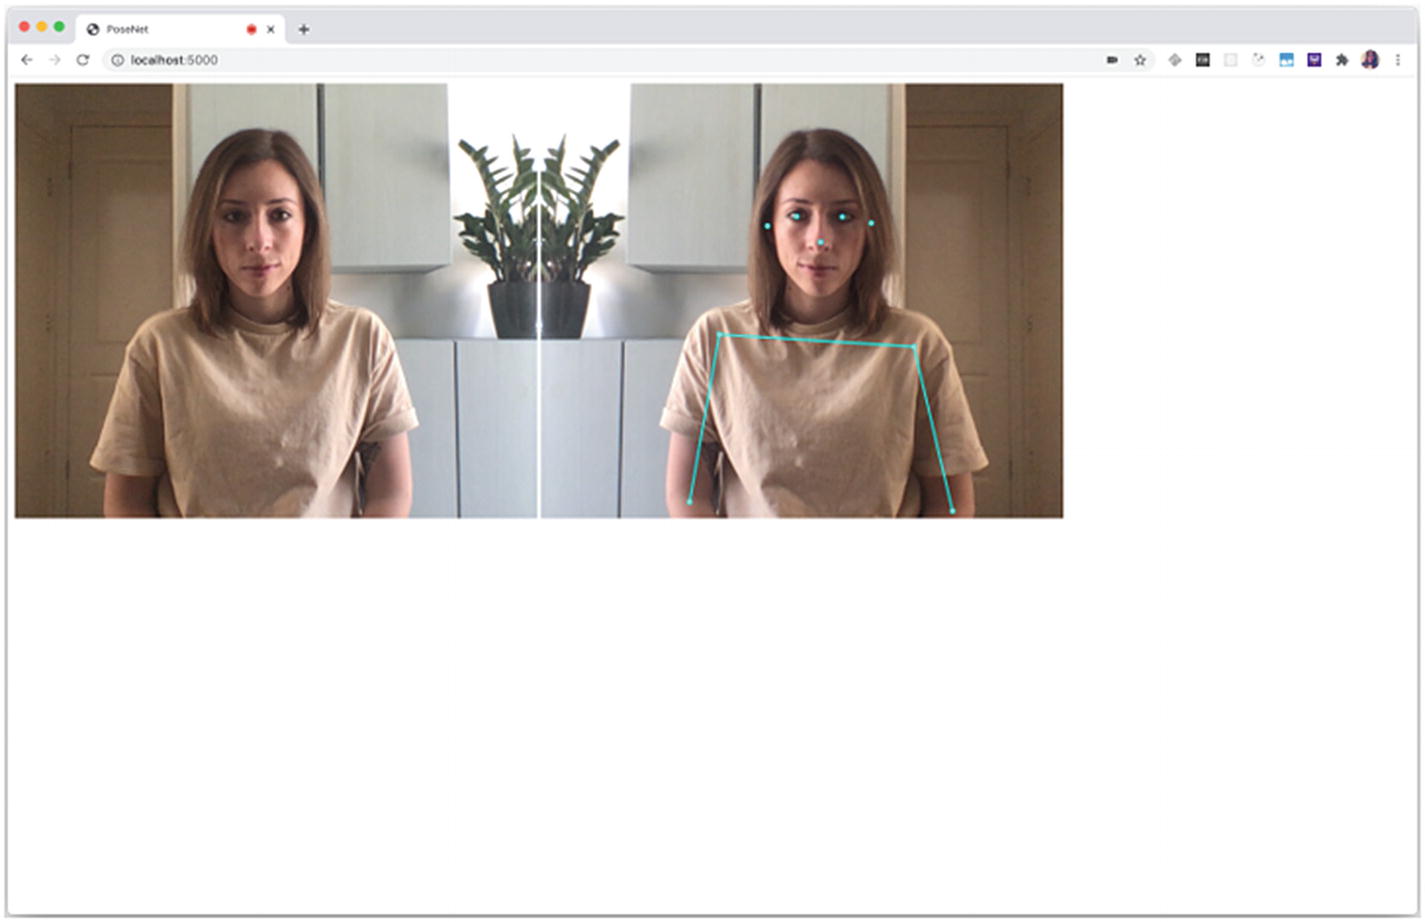
Output of the complete code sample
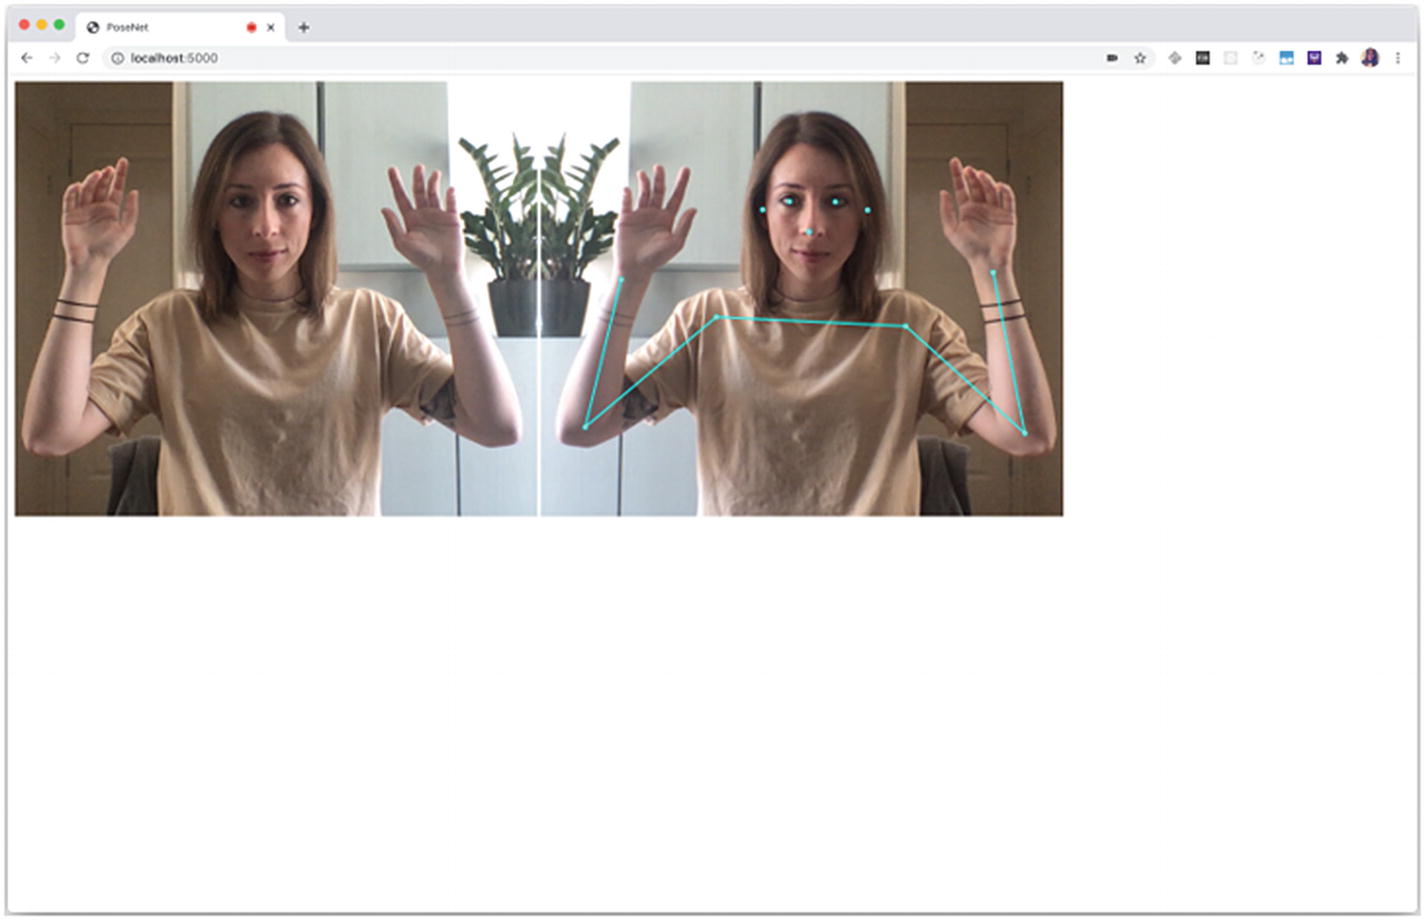
Output of the complete code sample
Now that we have gone through the code to detect poses, access coordinates for different parts of the body, and visualize them on a canvas, feel free to experiment with this data to create projects exploring new interactions.
5.3 Hardware data
For the last section of this chapter and the last part of the book that will contain code samples, we are going to look into something a bit more advanced and experimental. The next few pages will focus on using data generated by hardware and build a custom machine learning model to detect gestures.
Usually, when working with hardware, I use microcontrollers such as Arduino or Raspberry Pi; however, to make it more accessible to anyone reading this book that might not have access to such material, this next section is going to use another device that has built-in hardware components, your mobile phone!
This is assuming you possess a modern mobile phone with at least an accelerometer and gyroscope.
To have access to this data in JavaScript, we are going to use the Generic Sensor API.
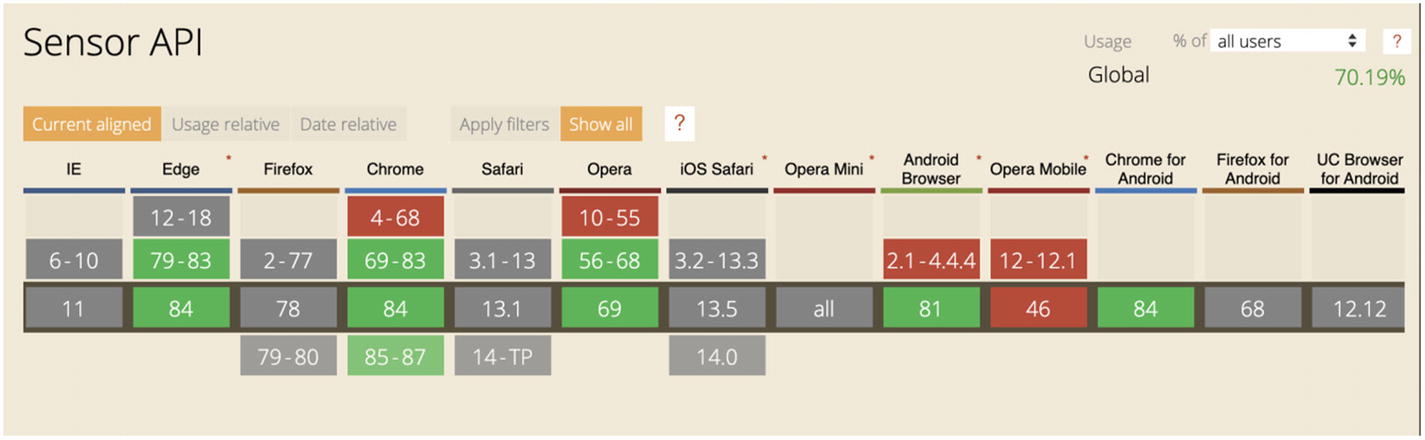
Browser support for the Generic Sensor API. Source: https://caniuse.com/#search=sensor%20api
To build our gesture classifier, we are going to access and record data from the accelerometer and gyroscope present in your phone, save this data into files in your project, create a machine learning model, train it, and run predictions on new live data.
To be able to do this, we are going to need a little bit of Node.js, web sockets with socket.io, the Generic Sensor API, and TensorFlow.js.
If you are unfamiliar with some of these technologies, don’t worry, I’m going to explain each part and provide code samples you should be able to follow.
5.3.1 Web Sensors API
As we are using hardware data in this section, the first thing we need to do is verify that we can access the correct data.
As said a little earlier, we need to record data from the gyroscope and accelerometer.
The gyroscope gives us details about the orientation of the device and its angular velocity, and the accelerometer focuses on giving us data about the acceleration.
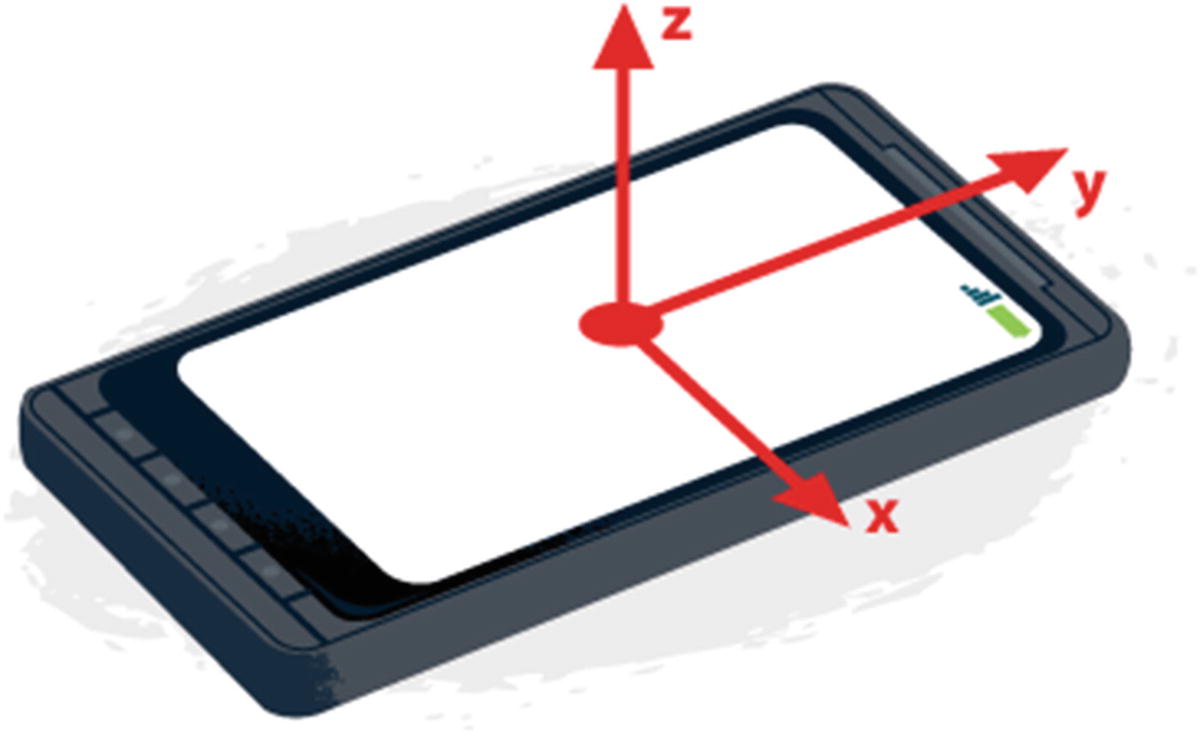
Accelerometer axes on mobile phone. Source: https://developers.google.com/web/fundamentals/native-hardware/device-orientation

Gyroscope axes on mobile phone. Source: https://www.sitepoint.com/using-device-orientation-html5/
5.3.2 Accessing sensors data
In index.js. Declaring variables to contain hardware data
In index.js. Get accelerometer and gyroscope data
In index.js. Use the touchstart event listener to start displaying data
At this point, if you want to check the output of this code, you will need to visit the page on your mobile phone using a tool like ngrok, for example, to create a tunnel to your localhost.
What you should see is the live accelerometer and gyroscope data displayed on the screen when you press it, and when you release it, the data should not update anymore.
At this point, we display the data on the page so we can double check that everything is working as expected.
However, what we really need is to store this data in file when we record gestures. For this, we are going to need web sockets to send the data from the front-end to a back-end server that will be in charge of writing the data to files in our application folder.
5.3.3 Setting up web sockets
To set up web sockets, we are going to use socket.io.
So far, in all previous examples, we only worked with HTML and JavaScript files without any back end.
If you have never written any Node.js before, you will need to install it as well as npm or yarn to be able to install packages.
Once you have these two tools set up, at the root of your project folder, in your terminal, write npm init to generate a package.json file that will contain some details about the project.
Once your package.json file is generated, in your terminal, write npm install socket.io to install the package.
Import the socket.io script in the HTML file
Now, you should be able to use socket.io in the front end. In your JavaScript file, start by instantiating it with const socket = io().
If you have any issue with setting up the package, feel free to refer to the official documentation.
Send motion data via web sockets
We are sending the motion data as a string as we want to write these values down into files.
On touchend, we need to send another event indicating that we want to stop the emission of data with socket.emit('end motion data').
Complete JavaScript code in the index.js file
Now, let’s implement the server side of this project to serve our front-end files, receive the data, and store it into text files.
First, we need to create a new JavaScript file. I personally named it server.js.
To serve our front-end files, we are going to use the express npm package. To install it, type npm install express —-save in your terminal.
Initial setup of the server.js file
You should be able to type node server.js in your terminal, visit http://localhost:3000/record in your browser, and it should serve the index.html file we created previously.
Now, let’s test our web sockets connection by requiring the socket.io package and write the back-end code that will receive messages from the front end.
At the top of the server.js file, require the package with const io = require('socket.io')(http).
In server.js. Web sockets connection
Now, restart the server, visit the page on ‘/record’ on your mobile, and you should see motion data logged in your terminal when you touch your mobile’s screen.
If you don’t see anything, double check that your page is served using https.
At this point, we know that the web sockets connection is properly set up, and the following step is to save this data into files in our application so we’ll be able to use it to train a machine learning algorithm.
To save files, we are going to use the Node.js File System module, so we need to start by requiring it with const fs = require('fs');.
Then, we are going to write some code that will be able to handle arguments passed when starting the server, so we can easily record new samples.
For example, if we want to record three gestures, one performing the letter A in the air, the second the letter B, and the third the letter C, we want to be able to type node server.js letterA 1 to indicate that we are currently recording data for the letter A gesture (letterA parameter) and that this is the first sample (the 1 parameter).
In server.js. Code to handle arguments passed in to generate file names dynamically
Now, when starting the server, you will need to pass these two arguments (gesture type and sample number).
In server.js. Code to create a file and stream when receiving data
We also close the stream when receiving the “end motion data” event so we stop writing motion data when the user has stopped touching their phone’s screen, as this means they’ve stopped executing the gesture we want to record.
To test this setup, start by creating an empty folder in your application called ‘data’, then type node server.js letterA 1 in your terminal, visit back the web page on your mobile, and execute the gesture of the letter A in the air while pressing the screen, and when releasing, you should see a new file named sample_letterA_1.text in the data folder, and it should contain gesture data!
Complete code sample in the server.js file
Before moving on to writing the code responsible for formatting our data and creating the machine learning model, make sure to record a few samples of data for each of our three gestures; the more, the better, but I would advise to record at least 20 samples per gesture.
5.3.4 Data processing
For this section, I would advise to create a new JavaScript file. I personally called it train.js.
In this file, we are going to read through the text files we recorded in the previous step, transform the data from strings to tensors, and create and train our model. Some of the following code samples are not directly related to TensorFlow.js (reading folders and files, and formatting the data into multidimensional arrays), so I will not dive into them too much.
The first step here is to go through our data folder, get the data for each sample and gesture, and organize it into arrays of features and labels.
For this, I used the line-reader npm package, so we need to install it using npm install line-reader.
We also need to install TensorFlow with npm install @tensorflow/tfjs-node.
In train.js. Loop through files to transform raw data into objects of features and labels
I am not going to dive deeper into the preceding code sample, but I added some inline comments to help.

Sample output of formatted data
At this point, our variable allData holds all features and labels for each gesture sample, but we are not done yet. Before feeding this data to a machine learning algorithm, we need to transform it to tensors, the data type that TensorFlow.js works with.
The following code samples are going to be more complicated as we need to format the data further, create tensors, split them between a training set and a test set to validate our future predictions, and then generate the model.
I have added inline comments to attempt to explain each step.
In train.js. Sorting and formatting the data
Running this should result in justFeatures and justLabels being multidimensional arrays containing features and labels indices, respectively.
For example, justLabels should look like [ [ 0, 0, 0, 0, 0, 0, 0, 0, 0, 0, 0, 0, 0, 0, 0, 0, 0, 0, 0, 0 ], [ 1, 1, 1, 1, 1, 1, 1, 1, 1, 1, 1, 1, 1, 1, 1, 1, 1, 1, 1, 1 ], [ 2, 2, 2, 2, 2, 2, 2, 2, 2, 2, 2, 2, 2, 2, 2, 2, 2, 2, 2, 2 ] ].
In train.js. Transforming multidimensional arrays into tensors
In train.js. Convert data to tensors
In train.js. Shuffle the data
In train.js. Split the data into training and test set
Example of output tensor
The values in the “shape” array will differ depending on how many samples of data you train and the number of lines per file.
In train.js. Full code sample for formatting the data
It is a lot to take in if you are new to machine learning and TensorFlow.js, but we are almost there. Our data is formatted and split between a training set and a test set, so the last step is the creation of the model and the training.
5.3.5 Creating and training the model
In train.js. Create, train, and save a model
At the end of our format function, call this createModel function using createModel(trainingFeatures, trainingLabels, testingFeatures, testingLabels).
Now, if everything works fine and you run node train.js in your terminal, you should see the model training and find a model folder in your application!
Complete code sample in train.js
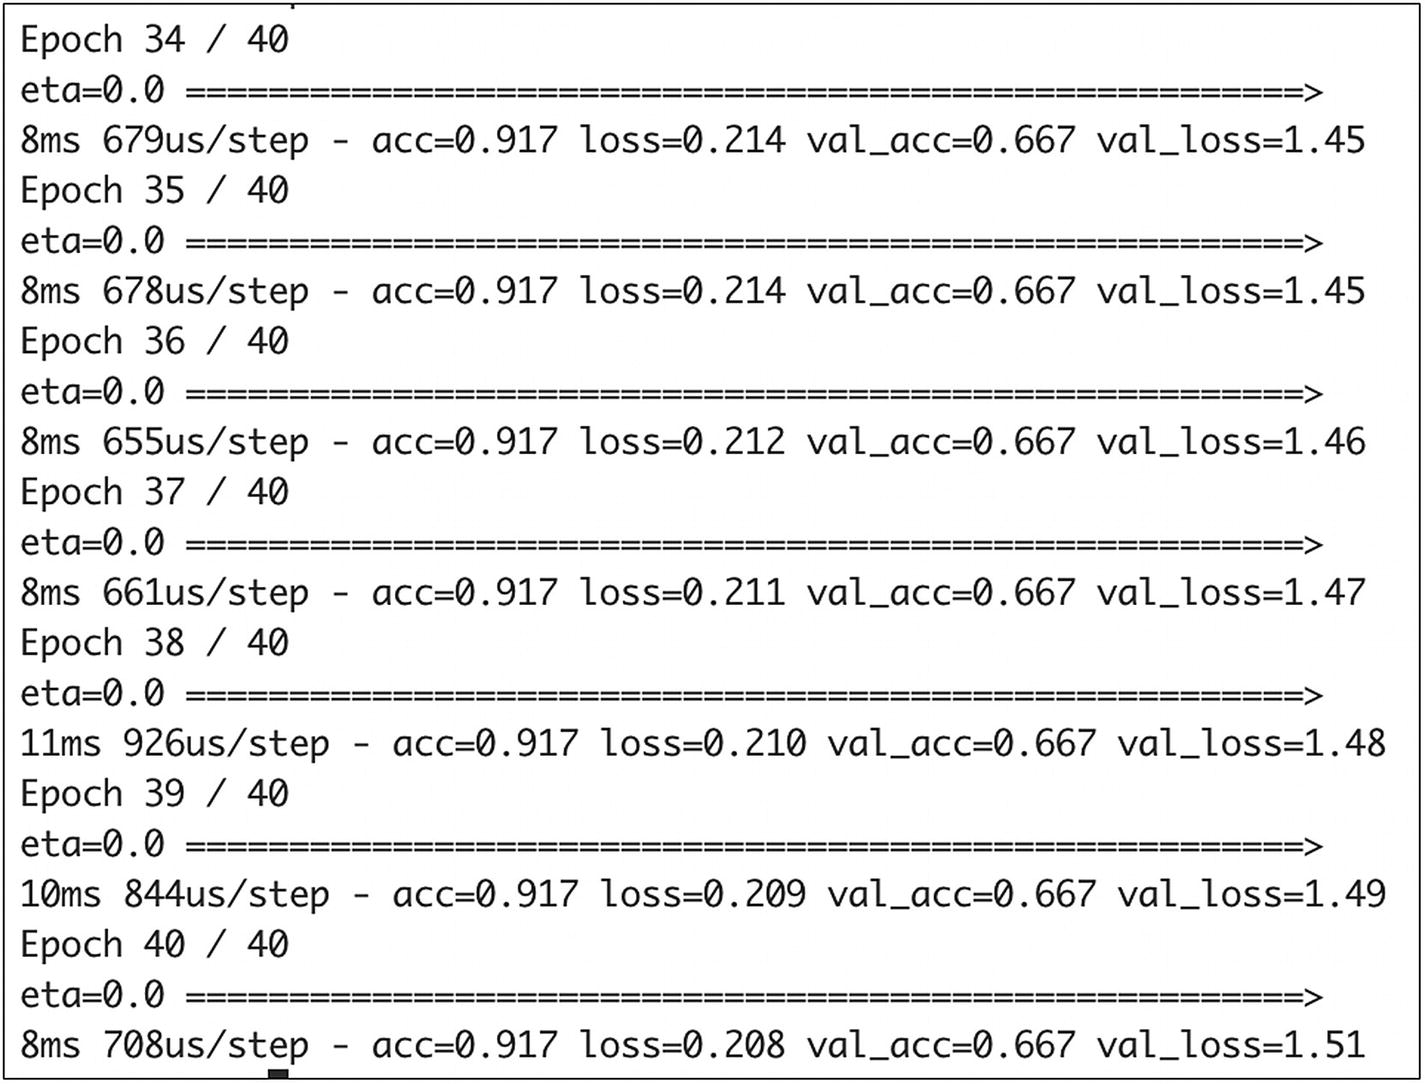
Sample output of the training steps
The output of the model shows us that the last step of the training showed an accuracy of 0.9, which is really good!
Now, to test this with live data, let’s move on to the last step of this project, using our model to generate predictions.
5.3.6 Live predictions
For this last step, let’s create a new JavaScript file called predict.js .
We are going to create a new endpoint called ‘/predict’, serve our index.html file, use similar web sockets code to send motion data from our phone to our server, and run live predictions.
In index.js. Update the shape of the motion data sent via web sockets
As the live data is going to have to be fed to the model, it is easier to send an object of numbers rather than go through the same formatting we went during the training process.
In predict.js. Complete code for the predict.js file
If you run the preceding code sample using node predict.js, visit the page on '/predict' on your phone, and execute one of the three gestures we trained. While holding the screen down, you should see a prediction in the terminal once you release the screen!

Possible error when a gesture is executed too fast
Now that our live predictions work, you could move on to changing some parameters used to create the model to see how it impacts the predictions, or train different gestures, or even send the prediction back to the front end using web sockets to create an interactive application. The main goal of this last section was to cover the steps involved into creating your own machine learning model.
Over the last few pages we learned to access hardware data using the Generic Sensor API, set up a server and web sockets to communicate and share data, save motion data into files, process and transform it, as well as create, train, and use a model to predict live gestures!
Hopefully it gives you a better idea of all the possibilities offered by machine learning and TensorFlow.js.
However, it was a lot of new information if you are new to it, especially this last section was quite advanced and experimental, so I would not expect you to understand everything and feel completely comfortable yet.
Feel free to go back over the code samples, take your time, and play around with building small prototypes if you are interested.