
CHAPTER 6
Forecasting
CHAPTER OBJECTIVES
After reading this chapter, you should be able to:
- Understand the meaning and importance of forecasting
- Explain the types of forecasting
- Elucidate the principles of forecasting
- Enumerate the key elements of forecasting
- Elucidate the steps in the forecasting process
- Understand the techniques of forecasting
- List the challenges to forecasting
- State the guidelines for effective forecasting
India’s Inspirational Managers
Azim Premji is the chairman of Wipro, a leading global IT company with presence in over 50 countries. Due to his astute foresightedness and bold leadership, the then USD 1.5 million company manufacturing hydrogenated cooking fats evolved into a US$8.36 billion (2018) company by diversifying and integrating into its conglomerate services—medical systems, technology products and consumer goods. When IBM had to quit India due to policy differences with the Indian government in the late 1970s, Azim Premji foresaw a perfect opportunity for Wipro in IT and IT-allied fields. He predicted that a right blend of business skills, technical strength and post-sales services would be a winning formula for Wipro in this sector. Azim’s prediction became true as Wipro emerged as a major player in the IT business, which now accounts for over 90 per cent of Wipro’s profits. Azim has successfully developed the “Wipro Way”—a process which directly impacts customer benefits by improving time-to-market, enhancing predictability and reliability, and cutting costs. As the head of the Corporate Executive Council, Wipro Limited, Azim Premji has also been active in deliberating the long-term vision and goals of the corporation.
Introduction
Forecasting is the process of predicting what will occur in the future. In simple terms, forecast is an estimate of future events. The purpose of forecasting in organizations is to make the best use of the presently available information to guide the future activities of the organization. Forecasts have direct as well as indirect impact on almost all activities of organizations. For instance, forecasting is an important and unavoidable task of organizational decision-making and planning activities. The primary aim of forecasting is to improve the accuracy and quality of decisions. Good forecasts can lead to better planning and decision making, lower costs, enhanced customer satisfaction and better competitive advantage in the market.1 In contrast, poor forecasting can lead to disastrous decisions.
Though forecasting is an uncertain process, it is vital for survival in today’s dynamic business environment. Managers try to forecast with as much accuracy as possible, but it is becoming increasingly difficult in today’s fast changing business world. If business forecasts are to become reliable sources of decision making, organizations must provide due important to accurate forecasting. To enhance the accuracy of forecasting, organizations are now making large new investments in technology, process and people to solve business problems.2
Business forecasting is used to predict and project future results for arriving at critical business decisions. Top decision areas in organizations where forecasting are considered as important are production planning, budgeting and strategic planning.3 Besides, forecasting is also useful for contingency planning, new product decisions, operations planning and control, investment decisions, capacity planning, employee hiring and crisis management. Good forecasts bring benefits to organizations in the form of better customer services, less inventory, less investment in excess capacities and fewer changeovers in policies and practices.4 However, forecasting is often described as a difficult, unrewarding and sometimes, useless exercise. This is because forecasters are mostly noticed when they do something wrong and rarely recognized for any right forecasts.
Definitions of Forecasting
The definitions on forecasting primarily focus on the prediction of future. We shall now look at a few definitions on forecasting.
“Forecasting relates to what will happen if the firm tries to implement a given strategy in a given possible environment.” —Armstrong.5
“Forecasting is the process of making statements about the value of variables whose values have not yet been realized.” —Helisse Levine.6
“Forecasting is a process that has as its objective the prediction of a future event.” —Benito E. Flores.7
“Forecasting is a systematic attempt to probe the future by inference from known facts.” —Louis A. Allen.8
We may define forecasting as a systematic effort at predicting the future events by inferring the relevant facts on hand.
Importance of Business Forecasting
Forecasting is fundamental to any planning process. It has both short-term utility and long-term utility to business organizations. In today’s business world, forecasting is becoming increasingly important as organizations focus more on customer satisfaction and controlling the cost of goods and services. Accountants usually forecast the cost and revenues while HR managers predict the changes in workforce. Similarly, financial managers forecast the cash flows and inventory requirements. Production managers use forecasts to determine the raw material requirements and also the preferred quantity of finished goods in stock. We shall now discuss the importance of business forecasting from different perspectives.9
- Better anticipation—Repeatedly, managers have to anticipate and project the future results based on the past and present organizational performances for making decisions. Forecasting enables managers to make informed decisions through better anticipation and superior prediction of uncertain events with the help of relevant information gathered and analysed. For instance, if organizations predict an economic recession, they can cut back on their inventories, production quotas, and hiring. In contrast, if an economic boom is predicted for the future, organizations can plan additional investments to get the maximum benefit from it.
- Develops situational awareness—Forecasting enables managers to have a better understanding of the organization’s environment. They can take more effective and accurate decisions by improving on their situational awareness and knowledge.
- Better responsiveness—Better and faster responsiveness to changes in external organizational environment is possible through forecasting. This responsiveness allows organizations to respond faster and smarter to the developments in a dynamic environment. Forecasting also enables organizations to see the changes that have occurred, both planned and unplanned events, and respond to these changes quickly.
- Improved coordination—Planning and goal-setting require the inclusion and coordination of the activities of various segments within a business environment. Forecasting demonstrates how these activities are actually interconnected. Forecasting normally results in better co-ordination of inter-departmental activities and a greater chance of attaining the overall organizational objectives.
- Better customer services—Forecasting enables organizations to feel the pulse of their customers and respond to their requirements effectively. By accurately forecasting the customer requirements, managers can provide better customer service with fewer resources and fewer complaints. For instance, when product demands are not forecast, organizations cannot expect the product to be available in the market. Forecasting thus becomes crucial to ensuring satisfactory, or even excellent, customer service.
- Better utilization of resources—One of the important tasks of forecasting is the better utilization of resources and the estimation of benefits out of them.10 Accurate estimation of resource (physical as well as human) requirements through effective forecasting helps organizations to avoid idle resources and overcapitalization. Forecasting thus ensures a more productive use of organizational resources by avoiding wastage.
- Lower costs—Forecasting can help organizations to achieve significant cost saving in their operations. For instance, inventory cost can be reduced through downsized warehousing by correctly forecasting inventory requirements. In fact, inventory is the largest balance sheet asset of many companies. Similarly, lower administrative cost can be achieved by forecasting manpower requirements. Generally, more profit can be achieved with less human effort, less equipment, less time and less space, if forecasting is effective.
- Fewer future shocks—Forecasting enables managers to plan for future changes and thus support company strategy. The fast pace of changes in the environment creates future shocks for those unable to adapt to such change. Forecasting enables organizations to predict the future changes and prepare themselves for such changes. Forecasting thus saves organizations from the negative effects of future shocks.
- Standards for comparison—Forecast is an estimate of future demand. It creates a baseline against which actual data can be measured. The forecast (anticipated) and the actuals (achieved) are compared to identify the gaps in results. Forecasting is again used to reduce the gap in the next period or cycle. Box 6.1 shows the forecasting initiatives of Infosys.
Types of Forecasting
Forecasting serves different purposes and performs different tasks in organizations. Corporate planners use forecasting to plan new products or new facilities. Marketing managers utilize forecasting to decide sales strategies and pricing strategies. Finance managers employ forecasting to plan borrowings and repayment schedules. Production managers use forecasting to plan inventory levels, production schedules, plant capacity, resource allocation, etc. On the basis of the basic characteristics such as the level of details required, the pattern of data required and forecast horizon, forecasting can be classified as short-term forecasting and long-term forecasting.
Depending on the length of forecasting time, organizations can choose between short- and long-term forecasts. Forecast objectives and the nature of variables to be forecast can also influence the managers’ decisions regarding the type and duration of forecasting. Generally forecasting becomes less accurate when the period of forecasting becomes longer. We shall now briefly discuss these two types of forecasting.
- Short-term forecasting—This is also called operational horizon forecasting. This forecasting may cover a period of a few days, weeks or months. Normally, it covers a period of less than 18 months. As such, weekly, monthly or quarterly forecasts are considered as short-term forecasts. Due to the uncertainty associated with long-term forecasting, organizations generally focus more on short-term forecasting. To put it differently, organizations often narrow their focus to forecasting achievable results over a short period to enhance control over operations. Short-term forecasting is mainly concerned with the areas that are necessary to deliver goods and services. It usually provides results based on trends and seasonality. Demand forecast is an example of short-term forecast. Since short-term forecasting is done more frequently, organizations normally use simplified and less time-consuming methods for such forecasting. In operational or short-term forecasting, organizations normally have little or no ability to change the future forecast.11
- Long-term forecasting—This is also known as strategic horizon forecasting. Long-term forecasting is typically the responsibility of the top management of organizations. This forecasting provides the basis for formulating major goals and plans of organizations. For instance, long-term forecasting is useful in developing plans for future expansions and financing. The long-term forecasting period may extend up to five, ten or more years. The emphasis of long-term forecasting is more on general economic, industry and market factors. It helps organizations in deciding long-term personnel requirements, capital expenditure requirements, financial requirements, size and direction of its future research and development programmes.
Box 6.1
Innovation Lab at Infosys
Organizations now realize that by improving the quality and accuracy of their forecasts, they can more easily see what interventions or innovations are required to meet their business performance targets. They also recognize that their biggest competitive advantage and differentiator in the future would be innovation. In this regard, the Innovation Lab at Infosys is worth mentioning.
Infosys has established an Innovation Lab as a part of the company’s new strategic measure, “building tomorrow’s enterprises.” This lab has dedicated research and innovation facilities and a 600- member strong technology and domain-focused team with primary focus on research, innovation and ] co-creation. This lab aims at delivering and managing innovation both inside the organization and outside—for customers and partners—and developing solutions to complex business problems. The team members of this lab focus on emerging technology areas and their business applications such as quantitative analytics for decision support, visualization and multi-model interactions, intelligent and adaptive system, large-scale simulations, semantic technologies and social media.45
In addition to the above classifications, organizations may also adopt medium-term forecasts having a time horizon of about five years for planning purposes. Medium-term forecasts are also known as business horizon forecasting. These forecasts are required to determine future resource requirements to procure raw materials, hire employees, or buy machinery and equipment.
Forecasts can also be classified as top-down forecasts and bottom-up forecasts based on the level of management on which the forecasts are made. Let us discuss them briefly.
- Top-down forecasting—This refers to forecasts that are done at the higher levels of management and pushed downwards for subsequent actions. In this method, management adopts a centralized approach towards forecasting. A small number of forecasters consider the various inputs gathered from different sources and generate forecasts. Forecasting, based on aggregate data, can be done ideally at the top levels only. It is also felt that top-down models often reflect better accuracy for top-level forecasting.12
- Bottom-up forecasting—In this case, forecasts from many members located at the bottom levels of the organizational structure are collected and then consolidated at the higher levels. This kind of forecasting is known as bottom-up forecasting. For instance, members of the sales team of an organization can make forecasts for their respective regions and this can be summed up later at a higher level to make a complete sales forecast. The general belief is that forecasting at the lower level reflects the actual nature of the business. However, bottom-up forecasting often has very poor accuracy at forecast levels.13
The decision regarding top-down or bottom-up forecasting is normally driven by the objectives of the forecasting.
Principles of Forecasting
Principles of forecasting represent advice, guidelines, prescriptions, rules and condition-action statements. These principles can help the forecasters to make more accurate forecasts. It also helps them to assess the uncertainty associated with forecasts. The primary purpose of the principles of forecasting is to minimize inconsistency and bias at different stages of the forecasting process.14 We shall now look at a few fundamental principles (beliefs) of forecasting.15
- Forecasting is a difficult process because it is about the future. It can rarely be perfect. This is because the future is always uncertain and unstable. According to an expert, the only thing that one can be sure about a forecast is that it is wrong.16 It is hence necessary to have an estimate of forecast error, while forecasting the future.
- Forecasting is different from planning as they are two separate concepts. Forecasting is quite often confused with planning. There is a subtle difference between forecasting and planning. Planning is concerned with how the world should look like while forecasting is all about how it will look like.
- Aggregate forecasts are normally more accurate than disaggregate forecasts. This is because aggregate forecasts normally have a smaller standard deviation of error in relation to the means. In other words, forecasts are typically more accurate for grouped data than for individual items. It is easier to forecast the Gross Domestic Product (GDP) of a nation than to forecast the annual revenue of a company or any one of its products with the same degree of accuracy.17
- Short-term forecasts are generally more accurate than long-term forecasts. While attempting to forecast the future, managers should have a clear understanding of the: (i) variables on which predictions are to be based (e.g., an organization can forecast its future sales), (ii) time horizons for which predictions are to be made, (i.e. the results of forecasting for one month may not be the same as that of forecasting for a six-month period) and (iii) existing knowledge or database relevant to the intended forecasting. The adequacy or inadequacy of available information can have a significant influence on forecasting. Finally, forecasters must not have any biased or partisan attitude as they may tend to compromise on a clean forecast.
Key Elements of Forecasting
According to Chary,18 forecasting seeks to analyse three elements, namely, the past, the present and the future. Forecasting fundamentally studies both the internal factors and external factors. These elements are partly controllable and partly uncontrollable. The outcome of forecasting depends, to a large extent, on how an organization shapes the controllable factors.
Mark A. Moon and others19 suggest seven keys that can improve business forecasting. Though the key elements are given in the context of sales forecasting, most elements have much wider applications and are common to almost all types of business forecasting. Moreover, sales forecast is the principal driver of the forecasting process of many organizations. We shall now look at these key elements.
- Understand what forecasting is and what it is not—This element refers to the organizational members’ understanding of the difference between planning and forecasting and also their ability to develop goals and plans based on forecasts.
- Forecast demand and plan supply—This element refers to identifying the source of relevant information and developing a method to collect key about demand and supply.
- Communicate, cooperate and collaborate—This element refers to adopting cross-functional approach to forecasting to ensure the cooperation of different functional departments.
- Eliminate islands of analysis—This element refers to building a single forecasting structure and giving training to both the developer and users of forecasts.
- Use tools wisely—This element refers to the judicious combination of qualitative and quantitative tools of forecasting.
- Make it (forecasting) important—This element refers to properly training the forecasters and also apprising them of the likely impact of poor forecasting on the organization.
- Measure, measure and measure—This element refers to the establishment of multidimensional metrics and also incorporating multilevel measures.
Forecasting Process
Forecasting is the process by which organizations prepare for the future. This process can be either simple or complex. The primary focus of any forecasting process is on defining how information will be gathered and analyzed to have a clear picture of how the future will be. In the forecasting process, participants with a fair knowledge of the future share their information in a specific format to make a forecast. This forecast enables an organization to determine its plans and goals. It also ensures that these goals and plans are attainable and there is no internal inconsistency among these goals and plans.
Even though the common objective of any forecasting process is to make the best possible decision organizations can have their own unique forecasting process. As illustrated in Figure 6.1, organizations can also have the following stages in their forecasting process: (i) determining the objectives of forecasting, (ii) identifying the variables to be forecast, (iii) deciding the time horizon, (iv) data gathering, (v) selection and evaluation of forecasting model, (vi) data analysis and interpretation, (vii) forecast presentation and (viii) feedback. We shall now discuss briefly the steps in forecasting.
- Determining the objectives of forecasting—The basic objective of forecasting is to support the decisions that are made on the basis of forecasts. It is therefore necessary to clearly specify the objectives of forecasts and also identify the areas of decisions. Forecasting begins when an organization seeks answers for its management questions. For instance, how much of a particular product is to be produced, how many employees are to be hired, how much of goods are to be kept in stock or how much of raw materials are to be bought are a few sample questions from management for which forecasts might find answers. Managers should also state clearly the role of forecast in the decision making.
- Identifying the variables to be forecast—At this stage, the forecaster should decide the variables that are to be forecasted. Variables affecting the organizations are either internal or external. The variables over which management can exercise control are known as internal variables. They may include, product (including quality, features, packing, etc.), price, marketing and distribution. Variables external to the organization and remaining beyond its control are known as external variables. They may include, labour market conditions, economic conditions like boom or recession, rate of interest and exchange rate fluctuations. Depending on the objectives formulated, the forecaster should decide on the appropriate variables to be forecasted. An organization may choose to forecast sales revenue for a specific period to determine the quantum of production.
- Deciding the time horizon—This stage involves the determination of the length of forecasting time. Based on the objectives and variables to be forecast, organizations should choose short-term, medium-term or long-term forecasting. They should also determine the time interval for each round of forecasting. The time interval may be a year, bi-annual, quarter or month. For instance, financial budgets are normally prepared on the basis of annual forecasting. Similarly, short-term forecasting is appropriate for inventory management.
- Data gathering—This is the crucial stage in the forecasting process as data required for forecasting are gathered. The source of these data may be internal, external or both. Internal data are normally readily available as they are mostly extracted from the documents maintained by the organizations. External data, which originate from outside the organization, are also collected. Organizations must ensure that the data collected are factually correct and are of high quality. Conventionally, aggregate data are better suited for forecasting as they are less time-consuming and less expensive than disaggregate data.20 The data on the sales volume of a product (say, cars) are aggregate data whereas the sales volume data gathered on the basis of nature of customers or type of cars are disaggregate data.
- Selection and evaluation of forecasting model—Different situations require different types of models. After careful examination of the objectives and problems of forecasting, the forecaster should determine the models that best serve their purpose. When deciding on forecasting, organizations should consider aspects such as probable end users of forecasts, nature, type and relevance of historical data available, level of accuracy required, time limit and cost−benefit of forecasts. While choosing specific forecasting models, organizations must ensure that the chosen models will perform well without making too many assumptions on the data-generating process.
Typically, forecasters can choose any forecasting model that they consider appropriate for data analysis. Normally, they select a model that fits the data set, selected variables and assumptions. The two common methods of forecasting are: (i) qualitative methods and (ii) quantitative methods. Qualitative methods depend on experts’ opinion for forecasting and decision making. Quantitative methods predominantly include mathematical and statistical models for predictions (forecasting methods are discussed later in this chapter).
Once the forecasting models are identified, forecasters should assess the strengths and weaknesses of each model to determine their suitability for the present forecasting. The information requirements can influence the selection of the most suitable forecasting model. Organizations should adopt a dynamic approach to forecasting model selection because changes in market conditions and economic environment may require the selection of alternate models promptly.
- Data analysis and interpretation—Using the chosen models, forecasters should analyse the data to generate forecasts. The purpose of application of data analysis is to find the hidden predictive information in large amounts of data. Forecasters usually interpret databases using their knowledge and experience. Obviously, different forecasters can interpret the same data in different ways. Data reliability, together with forecasters’ expertise, largely determines the accuracy of forecasting. Organizations can adopt a process called data mining for data analysis and interpretations. Data mining refers to the process of sifting through large amounts of historical data in search of hidden patterns and predictive information using statistical analysis, modelling techniques and database technologies. The ultimate goal of the data mining process is to extract knowledge from an existing data set and transform it into a human-understandable structure for further use.21
- Forecast presentation—Once the forecasts are ready, they should be presented to the management for use. It can be a written report, oral presentation or both. The forecaster needs to understand that proper communication of forecasting results to the management is as important as making the forecast. The forecast to be presented to the management must be lucid, understandable and reader-oriented. It should inspire the confidence of the managers. It should allow the managers to make appropriate decisions. It would be better if the report is relevant, information is recent and tables are not too lengthy. For instance, when the forecasts are too technical or difficult to be understood, managers may not actively consider them for decision making. In such a situation, the fundamental purpose of forecasting gets defeated. In the words of Mark J. Lawless,22
“In communicating the results of forecasting to the management, the forecaster must be capable of communicating the findings in language which the functional managers can understand and which is compatible with the corporate culture.”
While preparing the forecast report, the forecaster must be well aware of the intended purpose and how and when the forecast would be used. The intended purpose may be planning, controlling or budgeting. The forecasting report should be well-organized and in an eye-catching format.
- Feedback—Forecasting is a continuous activity of organizations. It is hence essential that the forecasting process has adequate provisions for gathering feedback about its efficiency and also for making improvements, when required. The forecasting process must permit a free and frank exchange of opinions, concerns and views among forecast developers and users, especially when there are forecasting errors. Input and guidance from the managers, supervisors and experts must be given due importance when the forecasting process, models and techniques are decided.

Figure 6.1
Steps in the Forecasting Process
Techniques of Forecasting
Forecasting techniques can be broadly classified into qualitative techniques and quantitative techniques. While choosing specific techniques, managers should take into consideration the following factors:23
- Availability of time—It refers to the time required for data generation and forecasting report generation. The time available for forecasting is normally decided by the frequency of the forecasts (such as daily, weekly, monthly, quarterly or yearly forecasts). Similarly, forecast horizons like short-, medium- and long-term forecasts also influence the technique selection.
- Technical sophistication required—It refers to the extent to which the statistical and mathematical models are to be used for data interpretation.
- Cost of forecasting—It refers to the cost per forecast. It includes the expenses to be incurred for data generation and analysis, and forecast report preparation besides the cost of forecasting errors.
- Data availability and accessibility—It refers to the availability of relevant and quality data for forecasting and also the frequency of access required to these data.
- Data variability—It refers to the frequency of changes in data used for forecasting.
- Extent of details required—It shows whether the forecasting should be based on aggregated or disaggregated data.
- Degree of accuracy required—It refers to the tolerable levels of accuracy in forecasting as total accuracy is not possible.
- Turning points—It refers to the possibilities of changes in the environment that may produce threats and opportunities to the organization.
- Nature of report required—It refers to the form and nature of forecast to be presented to the management.
The above-mentioned factors have different degrees of influence over the selection of forecasting techniques. Besides, the choice of a technique is also significantly influenced by forecasting accuracy requirements.
Scott Armstrong24 has identified six ways of selecting forecasting techniques. They are: (i) convenience of forecaster, (ii) market popularity, (iii) structured judgement which refers to the process by which the forecasters compare various forecasting techniques against the explicit criteria developed by them, (iv) statistical criteria, (v) relative track records—past performance of the techniques and (vi) guidelines from prior research. We shall now discuss the important models available in qualitative and quantitative techniques as shown in Figure 6.2.
Qualitative Forecasting Techniques
Qualitative techniques are primarily the subjective nature of forecasts. In this technique, forecasts are made on the basis of judgement, intuition and informed opinions of the forecast experts, managers, etc. These techniques are particularly useful when past data are not available (e.g., new product developments). They can also be appropriate for situations when the data change drastically. The accuracy of forecasting critically depends on the unique knowledge, experience, understanding and expertise of the forecasters.
The major weakness of qualitative techniques is that different forecasters can make different forecasts out of the same data. These techniques often suffer from the problems of bias of forecasters. Often, managers use qualitative forecasting techniques for arriving at medium- and long-term decisions. The important models of qualitative techniques are (i) the Delphi method, (ii) jury of executive opinion, (iii) judgmental bootstrapping, (iv) conjoint analysis, (v) role playing, (vi) sales force opinion and (vi) market factor analysis.
- Delphi method—Delphi method is a qualitative forecasting technique. This method uses a panel of experts ideally with different backgrounds to generate forecasts. Forecasts in this method are made based on the collective opinions of these experts. The participants of this forecasting group may be internal or external to the organization. This method is effective in allowing a group of individuals, as a whole, to deal with a complex problem by structuring the group communication process. The steps in the Delphi forecasting process are as follows.
- A planner/coordinator prepares a questionnaire on the issue that requires decision. Such questionnaires normally contain information on the character, causes and future shape of the problems at hand. These questionnaires are distributed individually to a group of experts who then respond by providing their opinions and judgments along with the justification.
- The individual responses of the panel members are summarized by the planner/coordinator. These collected responses are then sent back to the experts for their opinions and comments without identifying the individuals behind the responses. Experts now get an opportunity to change their assumptions on the issue and on their predictions. Each expert is free to change his or her previous position and come up with new opinions and judgments. The experts once again send back the same or revised opinions to the planner/coordinator.
- The planner/coordinator now prepares a second summary of responses and transmits them to the expert groups. This process continues until the experts reach some kind of agreement about their response. If an agreement is not possible after several rounds, the planner/coordinator must terminate the process after pinpointing where the disagreements occur, and use the results to indicate the specific problems in the prediction process.
Since the participants do not meet face-to-face, this method rules out the undue influence of any dominant member of the group on other members. The Delphi method is appropriate for medium-to long-term forecasting. The limitation of this method is that it is time-consuming and expensive. The quality of forecasting depends highly on the composition and expertise of the panel members.
- Jury of executive opinion or executive opinion method—It is a top-down qualitative forecasting technique. In this technique, a forecast is arrived through a combination of opinions and predictions made by knowledgeable managers and experts. In this method, managers at the higher levels come together to discuss their opinions on what will happen in the future. These managers may be the heads of their functional departments, such as production, marketing, finance, human resources, etc. This method can also be adopted for single functional departments like sales department, where managers from different regions may form a jury to forecast future sales. In this method, members of the jury present their own initial opinion based on the data given to them. They then review each other’s work and also revise their own opinion and estimates, if needed. Finally, the individual opinions are combined to complete forecasting. Wherever necessary empirical analysis can be done to support or supplement the executive opinions.25
In the jury of executive opinion method, an interdependent and collaborative approach is adopted by members towards forecasting. For instance, the production manager may change his initial forecasts to align it with the sales manager’s forecast. Similarly, the financial manager may alter his financial forecasts after reviewing the HR manager’s opinion on future hiring. This method is an ideal approach to forecasting when there are no past data available. This method also provides for a kind of peer review to indicate errors in forecasting in a friendly manner. The limitation of this method is that the dominant members may try to dominate and impose their views on others, which may distort the forecasting process. Lastly, if several forecasts are needed, expert forecasts may prove to be an expensive exercise.
- Judgmental bootstrapping—When organizations cannot afford the expensive jury of executive opinion forecasting method, they may opt for the less expensive judgmental bootstrapping method. In this method, the subjective judgments of experts are gathered and then converted into objective procedures for future references. The process involved in the judgmental bootstrapping method is as follows: (i) Forecasting experts make their predictions for a series of conditions. (ii) The process is then converted into a set of rules by regressing the forecasts against the information used by the forecaster.26
In the case of sales forecasting, for instance, experts will predict the future sales performance of the company in different geographical regions. Judgmental bootstrapping models are most useful for repetitive complex forecasting problems for which data are not sufficiently available. Once introduced, judgmental bootstrapping models can become a low-cost procedure for making forecasts. This method ensures better accuracy than other qualitative forecasting methods, even though these improvements are modest.27
- Conjoint analysis—Conjoint analysis is the survey-based method used frequently by managers to get consumer inputs for guiding their new product development decisions. The primary objective of this forecasting technique is to identify the market preferences and then determine the market potentials for new products. In this method, forecasters seek the opinion of the consumers in a target market on certain features (presently available or not available) of a product or service under a range of hypothetical situations. The results help them to estimate the likely preference for the product under consideration. It also facilitates the managers to make an indirect estimate of the customers’ willingness to pay for product improvements and modifications.28
- Role playing—Role playing can be used by managers to forecast decisions. This method is ideal for situations that involve conflicts. For instance, the sales manager of a company may want to know what would be the likely response of the competitor to a new sales promotion measure. As a part of the forecasting process, the administrator (manager) prepares a description of the situation, explains the role to the participants and also provides a short list of possible decisions. Then, the administrator asks participants to play their roles and uses their “decisions” as forecasts. Participants engage in realistic interactions with the other role players until they reach a decision. The simulation exercise may last between 30 and 60 minutes. This method is suitable for situations where past data are unavailable or insufficient. However, this method may be unsuitable for complex situations where participants are required to play divergent roles actively.29
- Sales force opinion—This method is also called the sales force composite method. It is an important forecasting technique especially for sales forecasting. In this method, sales managers get sales forecast from sales people who have intimate knowledge of the customers, including their tastes, preferences and attitudes. In this process, the sales managers gather individual forecasts from each sales person responsible for a specific region and then aggregate them to generate an overall sales forecast.
Sales forecast is a dynamic method of forecasting as the sales people can take note of changes in consumer tastes and preferences immediately and report them to the higher authorities through their forecast reports quickly. This method can generate accurate forecasting if the organization has a competent and well-informed sales force. This method is more suitable for organizations that have a few large customers and the sales people work closely with them. The limitation of this method is that sales people may tend to underestimate or overestimate the future sales projections to suit their conditions. For instance, they may deliberately lower their forecasts so as to avoid stiff sales targets in the future. Also, they may not have the time and expertise necessary for sales forecasting. This may affect the accuracy of forecasting.
- Market factor analysis—In this method, forecasting is done on the basis of the behaviour of one or more market factors. The basic assumption of this method is that it is possible to predict the future sales by studying the behaviour of certain critical and relevant factors. The process of this forecasting involves the identification of important market factors and understanding their relationship with sales. The identified market factors normally have a decisive influence on the sales performance of the products marketed by the organization. However, it should be ensured that the number of these factors is kept to a minimum for simple, effective and purposeful forecasting. For instance, an automobile company studying the potential for manufacturing replacement tyres can consider the average age of the tyres as an important factor for forecasting.30
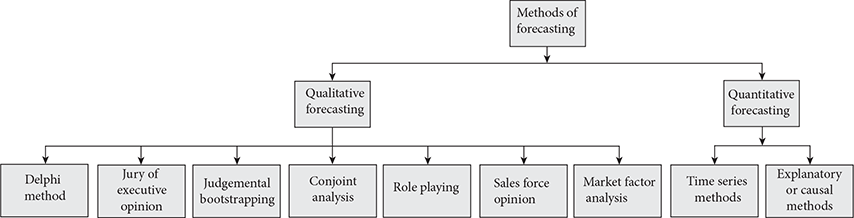
Quantitative Forecasting Techniques
Quantitative techniques are the objective form of forecasting techniques. In these techniques, mathematical and statistical formulae are widely used to forecast the future. These techniques are capable of producing the same forecast results irrespective of forecasters. Unlike qualitative techniques that rely on opinions, forecasters using quantitative techniques work with past data to extrapolate or project the future trends. These techniques facilitate the forecasters to consider large amounts of data and several variables at a time for forecasting. Quantitative methods are found to be more helpful in making better predictions on the future course of action than qualitative techniques.31 Quantitative techniques are broadly classified into time series methods and explanatory (casual) methods. We shall now briefly discuss these methods.
Time-series methods—This method is called the time-series method because it uses time series on past data and the variables forecasted. In this method, forecasts are made entirely on the basis of the historical patterns of the data. In other words, forecasters need only the past value of the variable to be predicted. The basic assumption of this method is that past trends are good indicators of the future trends. The past trends are carried over to the future too, except in unforeseen situations.
This method can produce accurate results if the future is expected to be similar to the past. In any time series, measurements of past trends or movements are taken at successive points or periods. For instance, the measurements can be taken every hour, day, week, month or year. To predict their future annual sales, organizations may review their sales over the past several years, say 10 to 15 years. Similarly, organizations may review their first three quarterly sales to forecast the likely sales in the last quarter of a year. Simple moving averages, weighted moving averages, autoregressive method, box-Jenkins model and exponential smoothing (a sophisticated weighted averaging method) are a few models of time series methods. Time series are generally more helpful for predicting broad environmental factors than for predicting the impact of present or future actions. Since time series rely on past trends for prediction, there can be danger in their use, if environmental changes are overlooked.
Explanatory or causal methods—This forecasting method aims at explaining the functional relationship between the dependent variable (say, sales volume) and the independent variables or predictors (say, advertising expenditure, consumer spending pattern and brand awareness) that account for changes in the dependent variables. The basic assumption of this method is that the variable being forecast has a cause−effect relationship with one or more other variables. This method is considered as the sophisticated form of forecasting. Predictions in this method are based on a combination of several factors, probabilities and assumptions.
Explanatory methods are known for their predictive power as well as explanatory power. Unlike time series which predicts what the future trend will be, explanatory methods also explain how and why a particular trend occurred. They allow managers to assess the likely impact of changes in the predictors. Regression models and econometric models are a few examples of this method. The merit of this method is that it helps managers to get deeper insights into the causal relationship among variables. It also predicts the future trends, especially the “turning points” in future, far more effectively than the time series methods. However, explanatory methods are comparatively more complex and expensive than time series methods. Box 6.2 shows the important analysis techniques used by an India-based multinational company.
In addition to the above two major methods of forecasting, a few other techniques are also available for forecasting. Let us discuss them briefly.
Box 6.2
Wipro’s Analytics Initiatives
In the constantly changing environment, it has become increasingly difficult to make accurate and timely forecasts. However, large organizations have the capacity to set up specialist units to provide forecasts for a wide range of subjects. They usually keep the means and resources to do, for instance, an analysis of the competition, an appraisal of product design and development and an assessment of pricing policy.
However, small or medium firms with less technological growth often depend on their “gut feel” of buyers and on the experience of their managers to make decisions. Of late, even these business firms have begun to use data to make their forecasts and decisions. In this regard, they outsource their forecasting and analytic (analysis) requirements. Wipro is one of the major companies that facilitates superior decision making by its clients through the optimal use of advanced analytics. The major analytic intervention programmes of Wipro include predictive analytics using statistical modelling, demand forecast and validation, stores labour forecasting, pack and size optimization, merchandise analytics, design of experiments, etc.46
Focus forecasting—This is an approach to forecasting developed by Bernard T. Smith. In this method, managers try a variety of forecasting models like simple moving average, weighted average and exponential smoothing methods for forecasting. The method that produces highest accuracy with least forecasting errors is identified by the managers and is then used for subsequent forecasts. The two basic assumptions of this model are as follows: (i) modern forecasting techniques need not always be better than traditional forecasting techniques and (ii) there can be no single technique available for all purposes, products and services. After testing seven forecasting tools, ranging from simple to sophisticated techniques, Smith concluded that focus forecasting techniques produced brilliant results.32 However, the focus forecasting method is better suited for short-term forecasting periods only.
Bass diffusion model—This model developed by Frank Bass is widely used to forecast the growth trends and the potential market volume of new and innovative products. This model employs statistical tools to estimate a new product’s diffusion or adoption speed and the total market potentials. A product’s sales increase in a given period indicates the speed of diffusion while maximum sales achieved by the product after its market entry indicate its total market potential. This method views factors like word of mouth, media attention and total market potential as shaping the speed of product diffusion. This model is one of the popular and extensively used forecasting methods of developing the curve of product life cycle.33 This method also helps managers in assessing the worthiness of investing in new technologies.
Break-even analysis—It is a quantitative technique widely used by organizations for profit forecasting. The break-even method can be applied to a product, an investment or the entire operation of an organization. Break-even point is the point at which organizations make neither profit nor loss. This technique focuses on the interrelationship of cost, sales volume and profit. This analysis shows how much revenue an organization should make to cover both its fixed and variable costs. Fixed cost is a cost that remains constant regardless of the level of production (eg., rent, salary, etc.) while variable cost is a cost that varies with the level of production (eg., material, wages, etc.). This technique enables the management to know when an investment will begin to generate profit. It aids in the planning process by helping organizations forecast the impact of changes in such factors as variable cost, fixed cost, selling price and sales volume on the organization’s earnings or profits.34
Project Evaluation and Review Technique (PERT)—PERT is an important project scheduling (a process of establishing a time sequence for the work to be done) and a management technique that allows the production managers to forecast, plan, manage and control complex projects. These projects are typically made up of numerous separate tasks performed by a variety of departments, units, individuals, etc. PERT diagrams show the flow of the projects and indicate the interdependence of the tasks. They also indicate the sequence of events from the start of a project to its termination. PERT flow chart is an effective forecasting technique for predicting the future essentials of an organization’s project or process. It facilitates managers to explore and consider the future possibilities, difficulties and uncertainties related to a project. It gives a visual representation of the task sequencing for forecasting a project along with the cost and time required for each sequence.
Budgeting—Budget is a written estimate of how an organization or its department, will perform financially. Budgets are fundamentally the forecasts of organizations concerning their future performance. The forecasts may be for the whole organization through a master budget or for different functions through functional budgets. Cash budget, production budget, material procurement budget, labour budget, expenses budget, sales budget and capital budgets are a few examples of functional budgets. Cash budget, for instance, will help the management to forecast how much of cash they will need and when they will need it. Budget forecasting is an important part of planning the future of a business. Budget forecasting can be done for a month, year or even a decade.
Linear Programming Technique (LPT)—It is a mathematical technique for determining a way to achieve the best outcome, (say maximum profit or lowest cost) with the aid of mathematical models. It is basically a problem-solving approach to solve a broad class of optimization problems, including resource allocation problems. This quantitative technique is often used by operation managers to get best solutions to problems that involve restrictions relating to material availability, budget constraints, labour and machine time restrictions. This technique has wide application in business planning and decision making. In operations management, it has found applications in areas like personnel scheduling, distribution and logistics inventory control, production planning, assignment problems and production blending problems.35 LPT can be effectively used as a forecasting technique to develop budgets based on an optimal programme or product mix to achieve the goal of profit maximization or cost minimization.36 Since linear programming primarily focuses on solving problems relating to the accomplishment of a single goal, organizations now use goal programming technique (GPT), an improvement over linear programming technique for dealing with problems arising out of multiple goals that are incompatible with one another. The key aim of GPT is getting satisfactory solution rather than best solution to conflicts.
While choosing the best forecasting methods, managers should keep in mind that optimum forecast accuracy cannot be the only selection criteria in choosing a specific method. They should also consider other criteria such as the ease of interpretation, ease of use, flexibility, availability of data and practicability of selection decisions.
Challenges in Forecasting
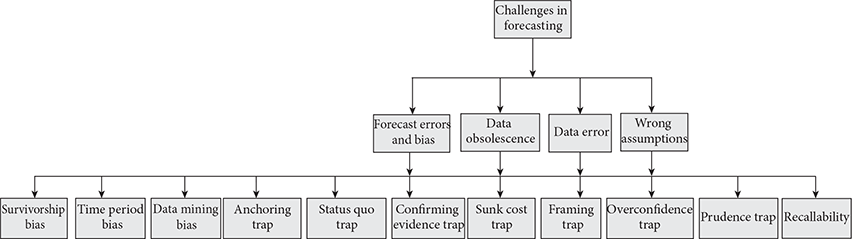
In most instances, forecasting is done for uncertain and unstable futures. This uncertainty often creates problems of forecasting errors and failures for the forecasters’. Forecasting failures cause loss of time and resources for organizations. Further, they frustrate the forecasters’ efforts. As shown in Figure 6.3, the challenges in forecasting are:
- Forecast errors—Forecasting error refers to the difference between the forecast values and actual values. Forecasting errors may be positive or negative. Positive errors represent over-forecast of value while negative errors represent under-forecast. When forecast errors are consistently positive or negative over a period of time, then bias in forecasting is a certain possibility. Forecast bias can occur due to any of the following biases.
- Survivorship bias—This bias may arise in forecasting when the data series or records include only those data that existed till the end of the period. In other words, survivorship bias occurs when the data include only those people or things that “survived” some process and unintentionally ignore those who “left” the process early. This may happen due to the non-availability of information about them at the time of forecasting. For instance, in recruitment forecasting, the data analysis may use past data relating to those who have completed certain stages in the selection process and not those who participated in the selection process but got eliminated in the early stages.
In investment analysis, survivorship bias is often called “look ahead” bias. This bias occurs when the forecasters use information or data in the study that would not have been known till the end of the period under study. For instance, if the investor simulates the future trade trends based on the information that was not available at the actual trade. Certain information on stock trade may normally be available only a few hours or days after stock market closure.37 The failure to exclude such future information will usually lead to inaccurate results in the study.
- Time period bias—This bias pertains to results that are time period specific. Time period is normally attributed to short-, medium- and long-term forecasting. For forecasting accuracy, the time period must be appropriate to the exercise. Generally, the forecast accuracy decreases as the time period covered by the forecast increases. Since forecast results are often found to be sensitive to the selection of time period, unsuitable time period of forecasting may result in time period bias.
- Anchoring trap—When undue importance is given to the initial data or the first information received on the topic of study by the data analyst, it is called anchoring trap. The analysts’ mind may be unduly influenced or anchored by the initial impressions, which may affect their subsequent thoughts and judgements. Tendency to reach premature conclusions and lack of open mind are often cited as the causes of forecasting problem.
- Status quo trap—When data analysts develop the tendency to believe that the current situation (status quo) would persist in the future too, it is called a status quo trap. Risk of forecasting error may force analysts to favour those alternatives that perpetuate the current situation. Similarly, analysts prefer status quo when alternative solutions to the problems are large in numbers. When radically new products are introduced in the market, consumers normally prefer to stay with their existing products for quite some time.
- Confirming evidence trap—When data analysts provide greater importance to information that supports their view points or intuitions over information that differs, it is referred to as confirming evidence trap. The outcome of this trap may be the analysts’ inclination to give too much weight to supporting information and inadequate weight to conflicting information.
- Sunk cost trap—When data analysts tend to choose alternatives that justify their past decisions or perpetuate their past mistakes, it is called a sunk cost trap. Forecast accuracy is often affected by sunk cost trap, especially when the investments in time and resources already made on the basis of earlier forecasts are substantial and irrecoverable. Difficulties in accepting the past mistake and the resultant criticisms may force forecasters to continue with the past mistakes. For instance, a marketing manager may persist with a particular advertising strategy even if it becomes clear that the strategy has not worked well when he fears any harm to his self-esteem and status.
- Framing trap—When a problem is faultily framed or a situation is misstated, it results in framing trap. The way a problem is framed can strongly influence choices made for solving it. The same problem may get very different responses when it has been framed in different ways. The framing trap can undermine the forecasting as well as the decision-making process.
- Overconfidence trap—When the forecasters make exaggerated claims on the accuracy of their forecasts, it is called an overconfidence trap. This happens when the forecasters are unrealistic about their ability to make accurate forecasts.
- Prudence trap—When forecasters are overcautious while estimating the uncertainties associated with the future, it is known as a prudence trap. When the stakes are very high in their decisions, managers or forecasters often like to adjust their estimates or forecasts just to be on the safer side.38
- Recallability trap—When forecasters develop an inclination to make predictions based on their memory of past events, it is called the recallability trap. Forecasters can be excessively influenced by negative events, dramatic events, catastrophic occurrences or any other events that had made a lasting impression on their memory. These events are capable of distorting the thinking pattern of the forecasters.
- Data mining bias—Data mining refers to searching the data set till some hidden pattern or predictive information is found out through statistical tests. But such a pattern cannot be expected to be of predictive value in all circumstances.39 Data mining error can also occur when: (i) data miners overlook measurement error in raw data, (ii) they assume the availability of more than adequate data and processing power, (iii) the data are truncated and censored and (iv) there are poorly designed experiments for data mining.40
- Survivorship bias—This bias may arise in forecasting when the data series or records include only those data that existed till the end of the period. In other words, survivorship bias occurs when the data include only those people or things that “survived” some process and unintentionally ignore those who “left” the process early. This may happen due to the non-availability of information about them at the time of forecasting. For instance, in recruitment forecasting, the data analysis may use past data relating to those who have completed certain stages in the selection process and not those who participated in the selection process but got eliminated in the early stages.
- Data obsolescence—In many occasions, past data form the basis for future forecasting. But there is no guarantee that the conditions in the past will persist into the future. Sudden and unexpected developments in the organizational environment can make data obsolescent. Any forecasting based on such obsolescent or outdated data will result in wrong forecasting, poor planning and misdirected initiatives and efforts. It is therefore necessary that the forecast analyst must understand that the time lag with which economic data are collected, processed and disseminated can be an impediment to their eventual use.41
- Data error—Accurate data is the basic requirement for successful forecasting. When there are errors in the underlying data, then the forecast accuracy will be seriously compromised and the purpose of forecasting will be defeated. Understandably, the quality of a set of forecasts would vary depending on whether data errors were found to be a significant or insignificant component of forecast errors.42
- Wrong assumptions—Assumptions are normally made by the forecasters based on their assessment of the future environment. These assumptions may go dangerously wrong due to unexpected or unpredictable happenings in such environment. When the assumptions go wrong, it can affect the whole forecasting process, including data gathering and analysis.
Apart from the challenges of errors and biases, the quality of forecasting may also be affected by typing errors, transcription errors, data handling errors, measurement errors, data inconsistency and inadequate representativeness of data samples. Further, forecasting accuracy may be compromised by mathematical modelling errors. These errors are generally classified into type-I errors and type-II errors. Type-I errors arise from the use of inadequate or invalid mathematical model but with correct parameters. Type-II errors result from the use of a perfect mathematical model but with inaccurate parameters.
Guidelines for Effective Forecasting
To enhance the effectiveness of forecasting, Saffo43 has advocated six important rules. Let us discuss them briefly.
- Define a cone of uncertainty—According to Saffo, a well-defined cone can help the decision maker to make strategic judgements. He has developed a cone of uncertainty to compare the effects of the short-term and long-term forecasting. This cone facilitates managers in visualizing the future uncertainties in forecasting. According to him, the uncertainty is less in a shorter period of forecasting (like a narrow cone of uncertainty). As the time period of forecasting gets longer, the uncertainty is likely to increase (like a wider cone of uncertainty). To make an effective forecasting, it is important for the forecasters to draw the cone in such a way that it includes all reasonable possibilities that lie ahead.44
- Look for the S-curve—The most important developments in the environment usually follow the S-curve shape. They unfold very, very slowly in the beginning and then suddenly explode after reaching a critical point before tapering off. It is essential for forecasters to accurately identify an S-curve pattern as it begins to emerge, well ahead of the inflection point, which is the moment of take off.
- Embrace the things that do not fit—Forecasters must have the instinct or intuition about the things that might be important in future even if they do not fit into the current scheme of things. They must keenly look for subtle indicators of things that are signs of impending major changes.
- Hold strong opinions weakly—Forecasters should forecast quickly based on the information available but remain open to new data and views that may prove their earlier conclusions wrong. Effective forecasting is often the outcome of a sequence of wrong and failed forecasts. It is hence necessary for forecasters to forecast often and be the first one to prove themselves wrong before others can do it.
- Look back twice as far as you look forward—It is important for forecasters to look back far enough into the distant past to identify the patterns that are fundamental to the changes. This is because the recent past cannot be a dependable indicator of the future. Forecasters should resist their desire for certainty and continuity that often lead them to draw wrong conclusions.
- Know when not to make a forecast—Forecasters must know for sure the situations and times that need forecasting and those that do not need forecasting.
Forecasters should also understand the fact that certain human behaviours can be predicted fairly accurately through forecasting. They are structured or systematic behaviours governed by rules and norms. There are certain other behaviours that are difficult to be predicted. One of them is random behaviour, which is behaviour with little or no precedence and rarely governed by rules. In any case, the success or failure of forecasts is largely determined by the way the forecasters use their common sense to assess the situations, gather and analyse data, generate forecasts and review the quality of the forecasts.
Summary
- Forecasting is a systematic effort at predicting the future events by inferring the relevant facts on hand.
- Forecasting is important for organizations as it facilitates: (i) better anticipation, (ii) situational awareness, (iii) better responsiveness, (iv) improved coordination, (v) better customer services, (vi) better utilization of resources, (vii) lower costs, (viii) fewer future shocks, (ix) quality decisions and (xi) standards for comparison.
- The types of forecasting are short-term forecasting, long-term forecasting, top-down forecasting and bottom-up forecasting.
- The stages in the forecasting process are: (i) determining the objectives of forecasting, (ii) identifying the variables to be forecast, (iii) deciding the time horizon, (iv) data gathering, (v) selection and evaluation of forecasting model, (vi) data analysis and interpretation, (vii) forecast presentation and (viii) feedback.
- Forecasting techniques can broadly be classified into qualitative and quantitative techniques. The important models of qualitative forecasting techniques are (i) Delphi method, (ii) jury of executive opinion, (iii) judgemental bootstrapping, (iv) conjoint analysis, (v) role playing, (vi) sales force opinion and (vi) market factor analysis.
- The quantitative techniques can be classified into time series methods and explanatory (casual) methods. A few other types of forecasting techniques are focus forecasting, bass diffusion model, break-even analysis, project evaluation and review technique, budgeting and linear programming techniques (LPT).
- Challenges in forecasting are forecast errors, data obsolescence, data errors, and wrong assumptions. Forecasting errors include survivorship bias, time period bias, anchoring trap, status quo trap, confirming evidence trap, sunk cost trap, framing trap, overconfidence trap, prudence trap, recallability trap and data mining bias.
- Guidelines for effective forecasting include the following: (i) define a cone of uncertainty, (ii) look for the S-curve, (iii) embrace the things that do not fit, (iv) hold strong opinions weakly, (v) look back twice as far as you look forward and (vi) know when not to make a forecast.
Review Questions
Short-answer questions
- Define the term forecasting.
- Briefly explain the importance of forecasting in the planning process.
- State the principles of forecasting clearly.
- What are the key elements of forecasting?
- Write short notes on: (a) jury of executive opinion and (b) judgemental bootstrapping.
- Explain the bass diffusion model of forecasting briefly.
Essay-type questions
- Critically evaluate the different types of forecasting with relevant examples.
- Discuss in detail the different stages of the forecasting process with appropriate examples.
- Enumerate the various techniques of forecasting available to managers.
- Sound forecasting is an essential ingredient of successful planning. Discuss.
- Forecasting is an important guard against guess work in decision making. In light of this statement, describe the significance of forecasting to business.
- Examine the challenges faced by managers in forecasting and also state the guidelines to be followed for effective forecasting.
Case Study
Missed Trends, Times and Opportunities for Nokia
Nearly 150 years ago, Nokia began its operations as a riverside paper mill in south-western Finland and then gradually diversified its business operations. At one point of time, Nokia was engaged in the manufacturing of products as diverse as rubber boots, car tyres, TVs, cables and consumer electronics. However, in the year 1992, Nokia made a crucial strategic decision to focus exclusively on manufacturing mobile phones and telecommunications systems. As a result, Nokia gradually sold off its existing businesses like rubber, cable and consumer electronics divisions. By 1998, Nokia became an international brand and a market leader in mobile phone business. Its strategic decision to focus on telecommunications, plus early investment in GSM, has richly paid off. For instance, between 1996 and 2001, Nokia’s turnover increased almost fivefold from EUR 6.5 billion to EUR 31 billion.
Having dominated the mobile world for over a decade, Nokia suddenly lost its way in the market. This is because the management of Nokia failed to take serious note of one major development in the market, namely, the smartphone revolution. When its major competitors like Apple and Samsung made deep inroads in the smartphone development, Nokia continued to focus on mobile phone devices (hardware) rather than mobile phone applications (software) and thus wasted precious response time. Nokia was also surprised by the speed with which consumers moved from the traditional mobile phones to smartphones. When the competitors were picking up pace in the market, Nokia began to suffer rapid decline in sales, revenue and market share.
Due to this embarrassing failure in market forecasting, Nokia had lost more than USD 88 billion in market value by June 2012, particularly after its arch rival Apple introduced the iPhone in the year 2007. Nokia’s employees too expressed reservations about its corporate communication system, decision-making style (like slow and inconsistent decisions), etc. To tide over the precarious situation, Nokia resorted to a series of actions like effecting leadership changes, cost-cutting measures in the form of retrenchments, transporting jobs from Europe to Asia, entering strategic partnerships (with Microsoft) for jointly developing smart-phones, executing significant changes in organizational structure (like decentralization), etc.
Though the emergence of stronger and more successful competitors like Apple, Samsung, RIM, Google, LG and the volatile market conditions indicate stiffer battles for Nokia in the market, it is confident that its actions would bear fruit sooner than later.
Questions
- According to you, what are the fundamental causes of the present plight of Nokia, especially from the management perspective?
- How do you foresee the short-term and long-term future of Nokia?
- In addition to the measures already initiated, what more can be done by the management of Nokia to tackle the present situation?
- Do you have any suggestions for strengthening the planning process of Nokia, especially its forecasting system?
References
- Kenneth D. Lawrence, Ronald K. Klimberg, and Sheila M. Lawrence, Fundamentals of Forecasting Using Excel (NY: Industrial Press Inc., 2008), p. 2.
- Michael Gilliland, “Fundamental Issues in Business Forecasting,” Journal of Business Forecasting (2003), 22(2): 7−13.
- Mentzer John T. and James E. Cox, Jr., “Familiarity, Applications and Performance of Sales Forecasting Technique,” Journal of Forecasting (1984), 3: 27−36.
- Thomas F. Wallace and Robert A. Stahl, A New Approach: Why and How to Emphasize Teamwork, Not Formulas, Forecast Less, Not More, Focus on Process Improvement, Not Forecast Accuracy (Cincinnati, OH: T. F. Wallace & Company, 2004) p. 36.
- J. S. Armstrong, Recent Trends in Forecasting Methods (Philadelphia, PA: Wharton School University of Pennsylvania, 1984), pp. 2−4.
- Helisse Levine, Eric A. Scorsone, and Jonathan B. Justice, Justice, Handbook of Local Government Fiscal Health (Burlington, MA: Jones and Bartlett Learning, 2013), p. 126.
- Benito E. Flores, “Forecasting in Manufacturing Management” in Paul M. Swamidass, (ed.), Encyclopedia of Production and Manufacturing Management (MA: Kluwer Academic Publishers, 2000), p. 235.
- Louis A. Allen, Management and Organization (New York: McGraw-Hill, 1958), p. 26.
- Steve Morlidge and Steve Player, Future Ready: How to Master Business Forecasting (West Sussex, UK: John Wiley & Sons, 2010), pp. 17−32.
- Amit Jain, Pramod Kumar Singh, and Kumar Anurag Singh, “Short-term Load Forecasting Using Fuzz Inference and Ant Colony Optimization,” SEMCCO 2011; Bijaya Ketan Panigrahi, Ponnuthurai Nagaratnam Suganthan, Swagatam Das, Suresh Chandra Satapathy (eds), Swarm, Evolutionary, and Memetic Computing—Second International Conference Proceedings, SEMCCO 2013, available at http://books.google.co.in.
- Steve Morlidge and Steve Player, Future Ready: How to Master Business Forecasting (West Sussex, UK: John Wiley & Sons, 2010), pp. 35−45.
- Kenneth B. Kahn, “Revisiting Top-down Versus Bottom-up Forecasting,” Journal of Business Forecasting (1998): 14, available at http://bus.utk.edu.
- Ibid.
- Jon Scott Armstrong, Principles of Forecasting: A Handbook for Researchers and Practitioners (NY: Springer Science and Business Media, 2001), pp. 60−6.
- Arthur V. Hill, The Encyclopedia of Operations Management: A Field Manual and Glossary of Operations Management Terms and Concepts (Upper Saddle River, NJ: Pearson Education, 2012), pp. 141−2.
- Ibid.
- Sunil Chopra, Peter Meindl, and D. V. Kalra, Supply Chain Management, Strategy, Planning and Operation, 4th ed. (New Delhi: Pearson Education, 2010), p. 203.
- S. N. Chary, Production and Operations Management, 3rd ed. (New Delhi: Tata McGraw-Hill, 2007), p. 82.
- Mark A. Moon, John T. Mentzer, Carlo D. Smith, and Michael S. Garver, “Seven Keys to Better Forecasting, Business Horizons (1998): 44−47, available at http://www.uam.es.
- A. Reza Hoshmand, Business Forecasting: A Practical Approach, 2nd ed. (NY: Routledge, 2010), p. 7.
- “Data Mining Curriculum,” available at: http://en.wikipediaorg.
- Mark J. Lawless, “Effective Sales Forecasting: A Management Tool,” Journal of Business Forecasting (1990), 9(1): 10.
- David M. Georgoff and Robert G. Murdick, “Managers Guide to Forecasting,” Harvard Business Review (1986): 110−20.
- J. Scott Armstrong, Selecting Forecasting Methods, Principles of Forecasting: A Handbook for Researchers and Practitioners (Norwell, MA: Kluwer Academic Publishers, 2001).
- Kenneth B. Kahn, New Product Forecasting: An Applied Approach (NY: M. E. Sharp, 2006), p. 39.
- J. Scott Armstrong and Roderick J. Brodie, “Forecasting for Marketing” in Graham J. Hooley and Michael K. Hussey, (eds.), Quantitative Methods in Marketing, 2nd ed. (London: International Thompson Business Press, 1999), pp. 92−119.
- J. S. Armstrong, “Judgmental Bootstrapping: Inferring Experts’ Rules for Forecasting” in J. S. Armstrong, (ed.), Principles of Forecasting: Handbook for Researchers and Practitioners (Norwell, MA: Kluwer Academic Publishers, 2001), pp. 171−192.
- Jon Scott Armstrong, Principles of Forecasting: A Handbook for Researchers and Practitioners (NY: Springer Science and Business Media, Inc., 2001), p. 148.
- J. Scott Armstrong and Kesten C. Green, “Demand Forecasting: Evidence-Based Methods” in Christopher R. Thomas and William F. Shughart II, (eds.) Oxford Handbook in Managerial Economics, available at: http://forecastingprinciples.com.
- Michael Etzel, Bruce Walker, William Stanton and Ajay Pandit, Marketing, 14th ed. (New Delhi: Tata McGraw-Hill), p. 167F.
- J. Holton Wilson and Deborah Alison Koerber, “Combining Subjective and Objective Forecasts Improve Results,” Journal of Business Forecasting (1992), 11(3): 12−16.
- Jay Heizer, Barry Render, and Jagadeesh Rajashekhar, Operations Management (New Delhi: Pearson Education, 2009), p. 91.
- Fang-Mei Tseng, “Quadric Interval Innovation Diffusion Models for New Product Sales Forecasting” in Mostafa Hashem Sherif and Tarek M. Khalil, (eds.) Management of Technology Innovation and Value Creation—Selected Papers from the 16th International Conference on Management of Technology (Singapore: World Scientific Publishing, 2008), p. 416.
- Jae K. Shim and Joel G. Siegel, Handbook of Financial Analysis, Forecasting, and Modeling, 3rd ed. (Chicago, IL: Wolters Kluwer/CCH, 2007), p. 3.
- Steven Nahmias, Production and Operations Analysis, 5th ed. (New York: McGraw-Hill/Irwin, 2005).
- Jae K. Shim and Joel G. Siegel, Handbook of Financial Analysis, Forecasting, and Modeling, 3rd ed. (Chicago, IL: Wolters Kluwer/CCH, 2007), p. 375.
- Francois-Serge Lhabitant, “Commodity Trading Strategies: Examples, Trading Rules and Signals from the CTA Sector” in Frank J. Fabozzi, Roland Füss, and Dieter G. Kaise, (eds.), The Handbook of Commodity Investing (New Jersey: John Wiley & Sons Inc., 2008), p. 403.
- Oswald A. J. Mascarenhas, Business Transformation Strategies: The Strategic Leader as Innovation Manager (New Delhi: Sage Publications, 2011) p. 87.
- John L. Maginn, Donald L. Tuttle, Dennis W. McLeavey, and Jerald E. Pinto, Managing Investment Portfolios: A Dynamic Process, 3rd ed. (New Jersey: John Wiley & Sons, 2007).
- Gordon S. Linoff and Michael J. Berry, Data Mining Techniques: For Marketing, Sales, and Customer Relationship Management (Indianapolis: John Wiley & Sons, 2011), p. 145.
- John L. Maginn, Donald L. Tuttle, Dennis W. McLeavey, and Jerald E. Pinto, Managing Investment Portfolios: A Dynamic Process (New Jersey: John Wiley & Sons, 2007).
- Rosanne Cole, “Data Errors and Forecasting Accuracy” in Jacob A. Mincer, (ed.), Economic Forecasts and Expectations: Analysis of Forecasting Behavior and Performance. NBER (1969), p. 47, available at: http://www.nber.org.
- Saffo Paul, “Six Rules for Effective Forecasting,” Harvard Business Review (2007) 85 (7/8).
- Ibid.
- http://www.infosys.com (last accessed in May 2014).
- https://docs.google.com (last accessed in May 2014).