
C H A P T E R 16
![]()
Managing Query Performance
Managing query performance is another one of those subjects that requires an entire book to provide the coverage it deserves, especially when you dive into the execution plans. However, dealing with problem queries is an integral part of every DBA's skill set. Luckily, Grant Fritchey and Sajal Dam have written SQL Server 2008 Query Performance Tuning Distilled (Apress, 2009), so this doesn't have to be a 500-page chapter.
This chapter will cover many of the new features that will help you deal with problematic queries. First, we will go over a few techniques to help you find these types of queries, and then we will discuss some of the options that give you a little more control over them (even if you can't directly edit the queries themselves). If you are a production DBA, I highly recommend using this chapter as a starting point, and then adding a dedicated book on query tuning to your collection.
Correlating Profiler and the Performance Monitor
One interesting feature added in SQL Server 2005 is the ability to import performance logs into SQL Server Profiler so that you can correlate activity on the system to specific queries. Correlating performance monitor (PerfMon) logs with SQL Server Profiler traces drastically improves your ability to track down the exact queries casing performance issues. Let's walk through a simple example.
Open SQL Server Profiler, then open PerfMon by selecting Performance Monitor from the Tools menu. (These first few steps are in no particular order; you just need to make sure you have PerfMon and Profiler running concurrently so you can correlate the results.)
Now you need to create a new counter log in PerfMon. Expand Performance Logs and Alerts, right-click Counter Logs, and select New Log Settings from the context menu. Give the log a name, such as Perfmon_Profiler_Demo and select OK.
Now you can add counters to the new log. Select the Add Counters button and make sure % Processor Time is highlighted in the Counters list and click Add. Click Close to return to the New Log dialog box. Take note of where the log file is located. You will need this later when you import the log into Profiler.
The next thing you need to do is start a new Profiler trace by selecting New Trace from the File menu. Connect to a SQL instance, select the Standard (default) template, and click Run to start the trace. Now that you have both traces running, you need to generate some load on the server. Execute the script in Listing 16-1 to simulate a bad query.
Listing 16-1. Query to Cause Performance Spike
SELECT * FROM sys.messages

CROSS JOIN sys.messages B

WHERE B.language_id = 1033 AND

 B.text like '%Warning%' AND

 B.text like '%instance%'
Before you can correlate the two traces, you have to stop, save, and reopen your Profiler trace, and then stop your PerfMon counter log. Stop the Profiler trace and select Save As ![]() Trace File from the File menu to save the trace. Now reopen the trace by selecting Open
Trace File from the File menu to save the trace. Now reopen the trace by selecting Open ![]() Trace File from the File menu. This is a good time to stop your PerfMon trace as well. Return to PerfMon, highlight the new log you created, and select Stop from the menu.
Trace File from the File menu. This is a good time to stop your PerfMon trace as well. Return to PerfMon, highlight the new log you created, and select Stop from the menu.
Now you have a new option available in SQL Server Profiler under the File menu called Import Performance Data. Select Import Performance Data and browse to the location of your PerfMon log file to import it into Profiler. This will open the Performance Counters Limit dialog box so you can select which counters you would like to import into Profiler. Make sure % Processor Time is selected, and click OK. You can now select a point on the PerfMon trace, and Profiler will take you to the query that was executing at that point. As you can see in Figure 16-1, the query in Listing 16-1 was the cause of the spike in PerfMon.
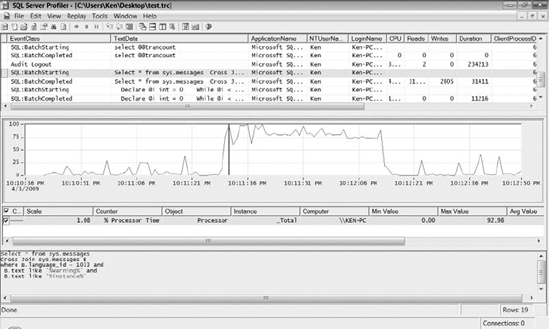
Figure 16-1. Correlating PerfMon and SQL Server Profiler
Finding Similar Queries
Prior to SQL Server 2008, finding and tuning similar queries was a daunting task. Prior to SQL Server 2008, you would have to capture a set of queries using a trace or Dynamic Management View (DMV), perform some logic to replace literal values within those queries, and then group by some or all of the query text. The concept is to try to replace literal values with something, such as a pound sign (for example, SELECT col1 FROM Table1 WHERE col1 = # AND col2 = #), so you can group the queries such that the only difference is the parameter values. This approach is very time consuming and in many cases less than accurate. Microsoft has added the query_hash and query_plan_hash columns to the sys.dm_exec_query_stats and the sys.dm_exec_requests DMVs to provide a far more accurate way of finding similar queries.
The sys.dm_exec_query_stats DMV returns aggregate performance statistics about query plans that are currently in cache, and the sys.dm_exec_requests DMV returns information about queries that are currently executing. A query hash is a binary hash value that is calculated on a query based on the query text prior to being sent to the optimizer. A query plan hash is a binary hash value that is calculated based on a compiled query plan. Two queries may have the same query hash values and different plan hash values. For example, if you execute two queries that are identical except for the literal values, the query hash value will be the same. However, one query may produce an index scan, while the other may produce an index seek in the query plan (depending on the range of values being requested), resulting in different query plan hash values.
Now that you understand the mechanics of using hash values, let's take a look at a few examples. Run the script in Listing 16-2 to clear the plan cache and execute some similar queries.
Listing 16-2. Sample Queries to Create Similar Hash Values
DBCC FREEPROCCACHE

GO

SELECT * FROM sys.messages WHERE severity = 23

GO

SELECT * FROM sys.messages WHERE severity = 23

GO

SELECT * FROM sys.messages WHERE severity = 23;

GO

SELECT * FROM sys.messages WHERE severity=23

GO

SELECT * FROM sys.messages WHERE severity = 24

GO

SELECT * FROM sys.messages WHERE severity IN (24)

GO

SELECT * FROM sys.messages WHERE severity in (23,24)

GO
Now that you have executed a few similar queries, you can review the output from the sys.dm_exec_query_stats DMV. You will also use the sys.dm_exec_sql_text function to return the query text by passing in the plan handle used for the query. Run the query in Listing 16-3 to review the hash values generated by the queries in Listing 16-2.
Listing 16-3. Query to Analyze the Hash Values Generated by Listing 16-2
SELECT qs.query_hash,

       qs.query_plan_hash,

       st.text ,

       qs.execution_count,

       qs.total_worker_time

FROM sys.dm_exec_query_stats qs

CROSS APPLY sys.dm_exec_sql_text (plan_handle) st

WHERE st.text like 'Select * From sys.messages%'

ORDER BY qs.total_worker_time desc
The results from Listing 16-3 are displayed in Figure 16-2. As you can see by the execution count, out of the seven queries we ran, only two of them used the same cached execution plan. The query text must be exactly the same in order for SQL Server to reuse the execution plan. There are only minor differences in the queries we are limiting on severity 23, but even an extra space or a semicolon causes SQL Server to compile a separate execution plan. It would be much more efficient to parameterize these queries so that SQL Server could make use of the same cached execution plan for each one. If you look at the hash values in the first two columns, you will see they all match except for the query in the second row. The query text and query plan were both slightly different enough to produce different hash values.
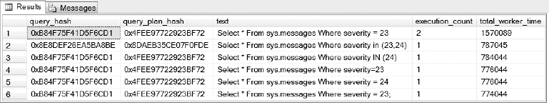
Figure 16-2. Results returned from running the query in Listing 16-3
Now let's run the query in Listing 16-4 to aggregate the data based on the hash values to get a more accurate view of the execution count and total worker time for the queries run in Listing 16-2.
Listing 16-4. Query to Aggregate Execution Count and Total Worker Time Using Hash Values
SELECT qs.query_hash,

       qs.query_plan_hash,

       MIN(st.text) QueryTextLike,

       SUM(qs.execution_count) ExecutionCount,

       SUM(qs.total_worker_time)TotalWorkerTime

FROM sys.dm_exec_query_stats qs

CROSS APPLY sys.dm_exec_sql_text (plan_handle) st

WHERE st.text LIKE 'SELECT * FROM sys.messages%'

GROUP BY qs.query_hash, qs.query_plan_hash

ORDER BY TotalWorkerTime DESC
Now look at the aggregated results in Figure 16-3. This shows an execution count of six for the queries that share the same hash values. This level of aggregation could raise queries to the top of your result set that may otherwise go unnoticed. For example, if you are looking for the top ten queries with the highest total worker time, and if several like queries were run hundreds of times generating different execution plans, they may not even make the list. Using the new plan hash feature will allow you to focus on tuning the queries actually using the most resources on your system instead of just those heavy hitters that are easy to find.
Figure 16-3. Results returned from running the query in Listing 16-4
Running the Standard Performance Reports
Microsoft has written some out-of-the-box reports that offer some useful information when looking for problematic queries. You can write many of the same kinds of reports using DMVs, but the canned reports are a quick and easy way to find some of your worst performing queries.
You can view a list of reports that apply to the entire instance or to a specific database. To display the list of reports shown in Figure 16-4, right-click on the SQL Server instance in SQL Server Management Studio, select Reports ![]() Standard Reports. To display a list of reports for a specific database, right-click on the database instead of the Server Instance.
Standard Reports. To display a list of reports for a specific database, right-click on the database instead of the Server Instance.
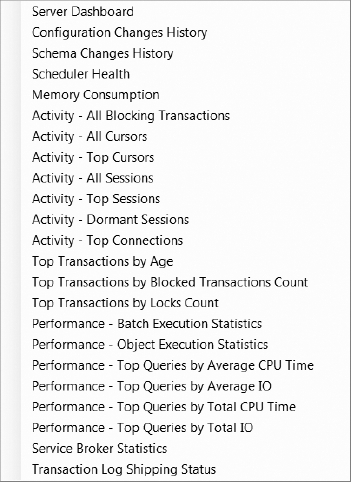
Figure 16-4. List of standard reports in SQL Server Management Studio
You can see a sample of the Performance - Top Queries by Average CPU Time report in Figure 16-5. If you look at the worst performing query, you may notice it was the query we executed in Listing 16-1 to cause the PerfMon spike.
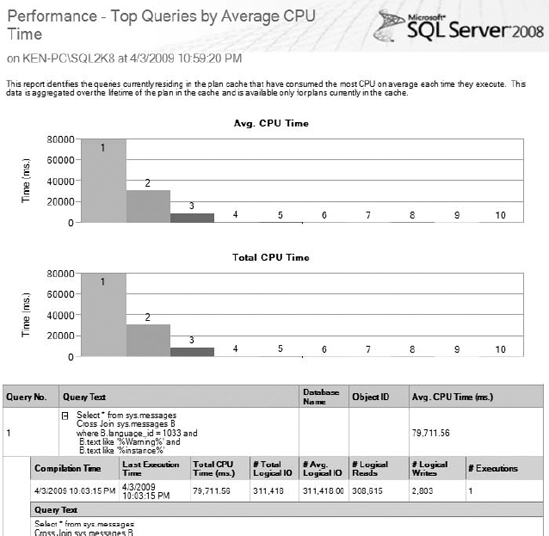
Figure 16-5. Performance – Top Queries by Average CPU Time Standard Report
Alternatively, you can use DMVs and execute the query in Listing 16-5 to display the same information. But not only is the standard report in a format that is easier to read, it is also a lot easier to execute. We don't know about you, but unless we have the script handy, we wouldn't want to have to remember the syntax required to write the query in Listing 16-5. If you do want to have the scripts on hand, you can start a trace in Profiler, run a report, and capture the query that the report executed.
Listing 16-5. Top Ten Queries by Average CPU Time
SELECT TOP 10

    creation_time,

    last_execution_time,

    (total_worker_time+0.0)/1000 as total_worker_time,

    (total_worker_time+0.0)/(execution_count*1000) as [AvgCPUTime],

    total_logical_reads as [LogicalReads],
    total_logical_writes as [LogicalWrites],

    execution_count,

    total_logical_reads+total_logical_writes as [AggIO],

    (total_logical_reads+total_logical_writes)/(execution_count+0.0) as [AvgIO],

     case when sql_handle IS NULL

          then ' '

          else ( substring(st.text,(qs.statement_start_offset+2)/2,

               (case when qs.statement_end_offset = −1

                 then len(convert(nvarchar(MAX),st.text))*2

                 else qs.statement_end_offset

                 end - qs.statement_start_offset) /2 ) )

     end as query_text,

        db_name(st.dbid) as db_name,

        st.objectid as object_id

FROM sys.dm_exec_query_stats qs

CROSS apply sys.dm_exec_sql_text(sql_handle) st

WHERE total_worker_time > 0

ORDER BY [AvgCPUTime] desc
One advantage that DMVs have over the reports is that you can run the DMVs from a scheduled job and insert the output in a table. Every time SQL Server is restarted, you lose all of the useful information provided by the DMVs. Storing the output from DMVs in a table allows you to take snapshots of the DMVs so you can analyze the data over a long period of time without worrying about losing all of your information if SQL Server is restarted.
Optimizing for Specific Parameter Values
The OPTIMIZE FOR query hint was introduced in SQL Server 2005 to allow you to specify a value the query optimizer will use when creating an execution plan for parameterized queries. SQL Server 2008 has enhanced this query hint by adding the UNKNOWN option, which instructs the query optimizer to use statistical information when creating the execution plan instead of the supplied value. The OPTIMIZE FOR query hint is useful when different parameter values create different execution plans. If you create a stored procedure, and the execution plan is cached based on infrequently used values, you could suffer from a poorly cached execution plan.
Let's look at a couple of queries where the execution plan changes based on the search value. The query in Listing 16-6 performs a basic join on the SalesOrderDetail and the SalesOrderHeader tables and limits the results to only orders with a quantity of one.
Listing 16-6. Query That Will Generate an Execution Plan That Uses a Merge Join
USE AdventureWorks2008

GO


SELECT B.CustomerID

FROM Sales.SalesOrderDetail A

     JOIN Sales.SalesOrderHeader B

     ON A.SalesOrderID = B.SalesOrderID

WHERE A.OrderQty = 1
The query optimizer chooses a merge join for the query in Listing 16-6 because there are almost 75,000 rows with an order quantity of one. You can view the execution plan for Listing 16-6 in Figure 16-6.
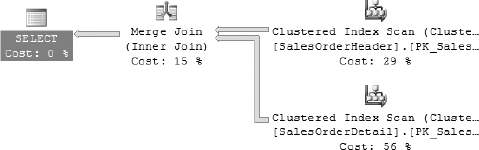
Figure 16-6. Execution plan generated for the query in Listing 16-6
Let's execute the same query with one minor change, as shown in Listing 16-7. If you look closely, you will see the only difference between the queries in Listing 16-6 and Listing 16-7 is that we changed the value in the WHERE clause to limit the results to only include orders with an order quantity of ten.
Listing 16-7. Query That Will Generate an Execution Plan That Uses a Hash Join
USE AdventureWorks2008

GO


SELECT B.CustomerID

FROM Sales.SalesOrderDetail A

     JOIN Sales.SalesOrderHeader B

     ON A.SalesOrderID = B.SalesOrderID

WHERE A.OrderQty = 10
As you can see in Figure 16-7, making a simple change in the WHERE clause causes the query optimizer to use a hash match to join the records, since there are only 768 rows with an order quantity of ten.
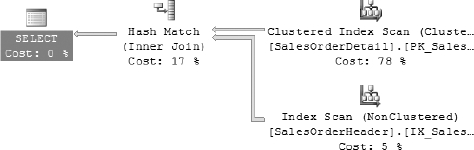
Figure 16-7. Execution plan generated for the query in Listing 16-7
Now let's execute the same query using a variable with a value of ten instead of hard coding the value. Let's also optimize the query as if the variable being used contained the number one, as shown in Listing 16-8.
Listing 16-8. Using the OPTIMIZE FOR Query Hint to Optimize the Execution Plan for a Value of One
USE AdventureWorks2008

GO


DECLARE @ID int =10


SELECT B.CustomerID

FROM Sales.SalesOrderDetail A

      JOIN Sales.SalesOrderHeader B

      ON A.SalesOrderID = B.SalesOrderID

WHERE A.OrderQty = @ID

OPTION (OPTIMIZE FOR (@ID = 1))
As you can see in Figure 16-8, the execution plan now contains a merge join instead of the hash join that the query optimizer would have normally chosen for the value of ten.
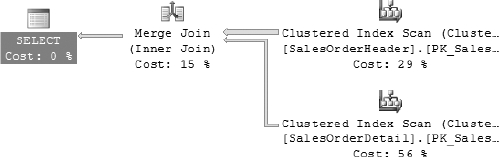
Figure 16-8. Execution plan generated for the query in Listing 16-8
Let's execute the query once again using a variable of one, which should cause the query optimizer to choose a merge join. Let's also change the query hint to optimize for UNKNOWN to instruct the query optimizer to use statistical information to create the query plan, as shown in Listing 16-9.
Listing 16-9. Using the OPTIMIZE FOR query hint to Optimize the Execution Plan for an Unknown Value
USE AdventureWorks2008

GO


DECLARE @ID2 int =1


SELECT B.CustomerID

FROM Sales.SalesOrderDetail A

      JOIN Sales.SalesOrderHeader B

      ON A.SalesOrderID = B.SalesOrderID

WHERE A.OrderQty = @ID2

OPTION (OPTIMIZE FOR (@ID2 UNKNOWN))
As you can see in Figure 16-9, the statistical information causes the query optimizer to use a hash join instead of a merge join that the optimizer would have normally chosen for the value of one. It chooses the hash join because, based on the statistical information, you are more likely to pass in a variable that will perform better using the hash join.
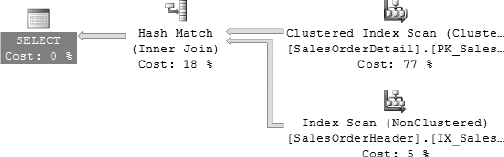
Figure 16-9. Execution plan generated for the query in Listing 16-9
Make sure you know the usage patterns of the application when using the OPTIMIZE FOR query hint. You may need to modify the optimization values from time to time. Optimal parameters today may not be the optimal parameters a year from now.
Forcing Index Seeks
The FORCESEEK table hint was introduced in SQL Server 2008 to force an index seek in an execution plan in place of an index scan. The query optimizer does a really good job deciding whether a seek or scan is more efficient, but in certain scenarios you may want to override the execution plan's decision. For example, poor cardinality estimation using the LIKE and IN operators may cause the query optimizer to choose an index scan when an index seek may be more efficient. Another reason for a poor execution plan could be due to plan reuse. For example, an execution plan could be initially generated using parameters that were more efficient using a scan, and now the plan is reused several times for parameters that would be more efficient using a seek. Take a look at the query in Listing 16-10.
Listing 16-10. Query to Create a Clustered Index Scan
USE AdventureWorks2008

GO


SELECT *

FROM HumanResources.Employee A

      JOIN HumanResources.EmployeeDepartmentHistory B

       ON A.BusinessEntityID = B.BusinessEntityID

WHERE A.BusinessEntityID > 270 OR

          (A.BusinessEntityID < 10 and B.DepartmentID =1)
As you can see in Figure 16-10, the query in Listing 16-10 used a clustered index scan on the EmployeeDepartmentHistory table, and then used a merge join to combine the results with the Employee table.
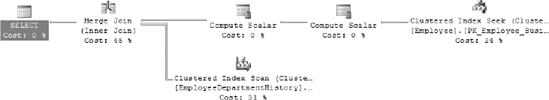
Figure 16-10. Execution plan created by running the query in Listing 16-10
Now let's see what happens when we execute the same query using the FORCESEEK table hint by running the query in Listing 16-11.
Listing 16-11. Query to Force a Clustered Index Seek
USE AdventureWorks2008

GO


SELECT *

FROM HumanResources.Employee A

      JOIN HumanResources.EmployeeDepartmentHistory B WITH (FORCESEEK)

       ON A.BusinessEntityID = B.BusinessEntityID

WHERE A.BusinessEntityID > 270 OR

          (A.BusinessEntityID < 10 and B.DepartmentID =1)
As you can see in Figure 16-11, using the FORCESEEK table hint caused the same query to use a clustered index seek on the EmployeeDepartmentHistory table, and the results are now joined with the Employee table using nested loops.
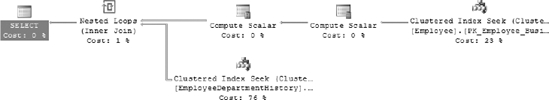
Figure 16-11. Execution plan created by running the query in Listing 16-11
Both of these execution plans provide almost identical performance metrics because the result set is so small. However, as the parameters change and the result set gets larger, the execution plan originally chosen by the query optimizer will outperform the execution plan generated using the FORCESEEK option.
Before considering using the FORCESEEK table hint, you should make sure the statistics for the database are up to date. In most cases, the query optimizer will choose the best execution plan for a query, but in rare cases, the FORCESEEK table hint could prove to be a very useful new feature.
Forcing a Specific Execution Plan
Plan forcing was introduced in SQL Server 2005 to provide a way for you to supply an entire execution plan that SQL Server will use to execute a query. Plan forcing is useful when the query optimizer will not produce an optimal execution plan for a query, even though you know a better execution plan is available. If you have a query that performed better prior to an upgrade, you may be able to capture the old execution plan and force the optimizer to use it. You can supply the execution plan in XML format following a query by supplying the USE PLAN option, as shown in Listing 16-12.
Listing 16-12. Syntax Used to Specify an Execution Plan by Supplying the USE PLAN Query Hint
SELECT *

FROM Table1

     JOIN Table2

     ON Table1.Column = Table2.Column

OPTION (USE PLAN 'N

<ShowPlanXML xmlns="http://schemas.microsoft.com/sqlserver/2004/07/showplan">

  ...

</ShowPlanXML>')
In order to supply the execution plan, you must first capture it in XML format. There are a few ways you can capture the XML execution plan to supply the query.
- You can use the
SHOWPLAN_XML SETstatement to return the XML execution plan instead of running the query, as shown in the following code:SET SHOWPLAN_XML ON
GO
SELECT * FROM Table
SET SHOWPLAN_XML OFF
GO - You can use the
STATISTICS XML SETstatement to return the XML execution plan following the query result set, as shown in the following code:
SET STATISTICS XML ON

GO


SELECT * FROM Table

SET STATISTICS XML OFF

GO - You can use the query_plan column in the
sys.dm_exec_query_planDynamic Management Function, as shown in the following query:
SELECT est.text, eqp.query_plan

FROM sys.dm_exec_cached_plans ecp

    CROSS APPLY sys.dm_exec_query_plan(ecp.plan_handle) eqp

CROSS APPLY sys.dm_exec_sql_text(ecp.plan_handle) est - You can use the
Showplan XML,Showplan XML Statistics Profile, andShowplan XML For Query Compileevent classes in SQL Server Profiler. - You can use the
Display Estimated Execution PlanandInclude Actual Execution Planoptions in SQL Server Management Studio; right-click the execution plan, and select Show Execution Plan XML from the context menu.
If the XML execution plan is invalid in any way, the query will fail. Certain underlying database schema changes may cause the execution plan to become invalid. Therefore, it is extremely important to test any queries that have the USE PLAN query hint after making database changes. Just as with any option you use to override the query optimizer, you should apply the USE PLAN query hint with extreme caution, and then only after you have exhausted your other options, such as creating proper indexes and updating statistics. Since the USE PLAN query hint forces a query to utilize a specified execution plan, the query optimizer will no longer be able to dynamically adjust to changes within the database.
Adding Hints Through Plan Guides
Plan guides were introduced in SQL Server 2005 to provide the ability to add a hint to a query without having to manually alter the query. Many times, you are at the mercy of the queries thrown at your database by certain applications. Plan guides let you supply a hint to those incoming application queries in order to produce a more efficient query plan.
SQL Server 2008 has actually taken plan guides a step further so that you can provide an entire XML query plan as a query hint. Unlike the USE PLAN query hint, an invalid XML query plan supplied as a query hint using plan guides will not cause the query to fail.
Creating a Plan Guide
To create a new plan guide, expand the Programmability node under the database where you would like the plan guide, right-click the Plan Guides folder, and select New Plan Guide from the context menu to display the New Plan Guide dialog box, as shown in Figure 16-12.
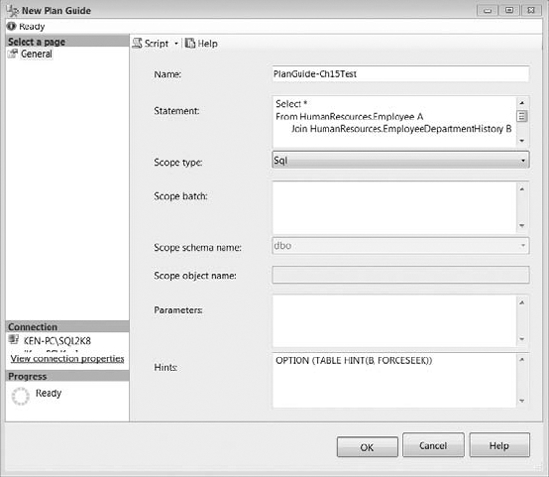
Figure 16-12. New Plan Guide dialog box
Let's create a plan guide for the same query used in Listing 16-10 to force the execution plan to use an index seek instead of an index scan. The options available when creating a new plan guide include the following:
- Name: Enter a descriptive name for the plan guide. We named ours PlanGuide-Ch15Test.
- Statement: Enter the T-SQL statement for which you would like to apply the plan guide. We entered the T-SQL statement from Listing 16-10.
![]() Caption Make sure you enter the T-SQL statement exactly as it will be sent to SQL Server. Even extra spaces will cause the query optimizer to ignore the plan guide.
Caption Make sure you enter the T-SQL statement exactly as it will be sent to SQL Server. Even extra spaces will cause the query optimizer to ignore the plan guide.
- Scope Type: The scope type specifies the context for matching the T-SQL statement to the plan guide. Valid values are Object, Sql, and Template. Object is the stored procedure, scalar function, multi-statement table-valued function, or T-SQL Data Manipulation Language (DML) trigger that contains the T-SQL statement. Sql indicates that the T-SQL statement is in the context of a stand-alone statement or batch. Template is used to change the default query parameterization behavior. If Template is selected, you can only use the
PARAMETERIZATION {FORCED | SIMPLE}query hint. We will be using the Sql scope type in this example. - Scope Batch: Enter the T-SQL batch that contains the statement for which you would like to apply the plan guide. If you leave the Scope Batch box blank, the Statement text will be used.
- Scope Schema Name: If the scope type is Object, enter the name of the schema that contains the object.
- Scope Object Name: If the scope type is Object, enter the name of the object that contains the T-SQL statement for which you would like to apply the plan guide.
- Parameters: Enter the parameter name and data type for the T-SQL statement. The parameters must be submitted exactly as they appear using the
sp_executesqlstatement. If the scope type is Template, parameters are required. - Hints: Enter the query hint or XML execution plan that will be applied to the T-SQL statement. SQL Server 2008 allows you to use the
FORCESEEKtable hint as a query hint by entering the following statement. (You should also notice that we are referencing the alias B for the table name we used in the query instead of the actual table name.)OPTION (TABLE HINT (B, FORCESEEK))
The final T-SQL command to create the plan guide is shown in Listing 16-13. You can query the sys.plan_guides catalog view to return information for each plan guide you have created in the current database.
Listing 16-13. T-SQL Code to Create the Plan Guide Shown in Figure 16-12
USE AdventureWorks2008

GO


EXEC sp_create_plan_guide

     @name = N'[PlanGuide-Ch15Test]',

     @stmt = N'Select *

FROM HumanResources.Employee A

      JOIN HumanResources.EmployeeDepartmentHistory B

       ON A.BusinessEntityID = B.BusinessEntityID

WHERE A.BusinessEntityID > 270 OR

          (A.BusinessEntityID < 10 and B.DepartmentID =1)',

    @type = N'SQL',

    @hints = N'OPTION (TABLE HINT(B, FORCESEEK))'

GO
Validating a Plan Guide
Because a plan guide will not cause a query to fail, it is important to validate the plan guides. This is primarily necessary after you perform an upgrade to SQL Server or change the underlying data structure in the database. If the plan guide is invalid, the query optimizer will ignore it and generate a new execution plan for the query. You can use the sys.fn_validate_plan_guide function to validate a plan guide by passing the plan_guide_id function from the sys.plan_guides catalog view. The sys.fn_validate_plan_guide function will return the first error message encountered when the plan guide is applied to the query. If you receive an empty result set, the plan guide does not contain any errors. The following script will check the validity of all the plan guides in the AdventureWorks2008 database.
USE AdventureWorks2008

GO


SELECT plan_guide_id, msgnum, severity, state, message

FROM sys.plan_guides

CROSS APPLY sys.fn_validate_plan_guide(plan_guide_id)
You can use the Plan Guide Successful and Plan Guide Unsuccessful events in SQL Server Profiler located under the Performance node to capture valid and invalid attempts of the query optimizer using plan guides. Start a new Profiler trace and select Show All Events, expand the Performance node, and select Plan Guide Successful and Plan Guide Unsuccessful, as shown in Figure 16-13. Select Run to start the trace.
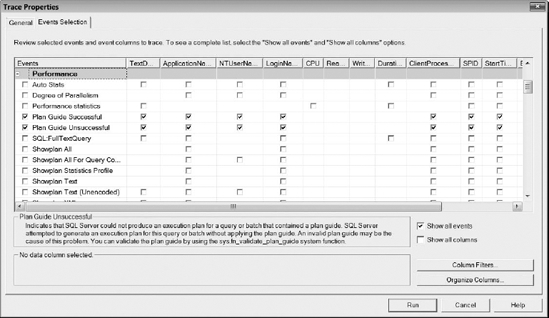
Figure 16-13. Plan guide events in SQL Server Profiler
Now, execute the query from Listing 16-10 that we used to create the plan guide. As you can see in Figure 16-14, the query optimizer successfully applied the plan guide to the query, and then the query was executed using the hint provided in the plan guide.
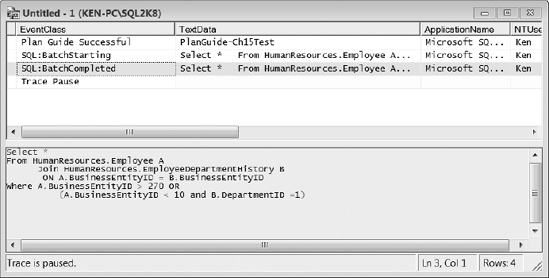
Figure 16-14. Successful plan guide execution captured using SQL Server Profiler
Managing Resources with the Resource Governor
In some cases, your queries may be running as efficiently as possible; they may just be running slow due to limited resources. For example, you may have a backup job or a long-running report consuming all of the system resources and slowing down your production queries. Luckily, in SQL Server 2008 you can use the Resource Governor to limit these resource-intensive operations so they have minimal impact on your environment.
The Resource Governor was introduced in SQL Server 2008 as an Enterprise Edition feature. You can use the Resource Governor to limit resource consumption of inbound requests and prioritize workloads in order to maintain a more predictable environment. Currently, you can only limit CPU and memory, but not IO. The Resource Governor only applies to the Database Engine, which means you cannot use the Resource Governor to manage external SQL Server processes, such as Analysis Services, Integration Services, and Reporting Services. Also, the Resource Governor is confined to a single SQL Server instance, limiting your ability to manage resources between instances.
The Resource Governor consists of three main components: a resource pool, a workload group, and a classifier function. A resource pool is used to carve up physical system resources available within an instance of SQL Server. A workload group is assigned to a resource pool and used to group similar queries so they can be treated as a single unit. Finally, the classifier function is used to assign an incoming request to the appropriate workload group. Figure 16-15 shows how an incoming request is routed to the appropriate resource pool. We will use the samples throughout this section to emulate the environment displayed in Figure 16-15.
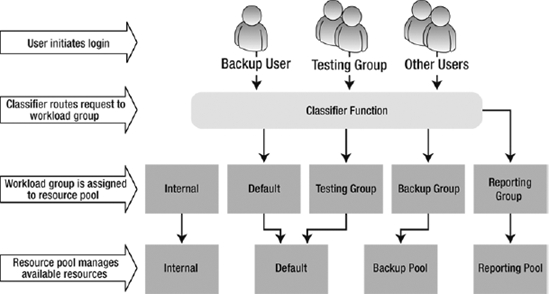
Figure 16-15. Resource Governor workflow
Resource Pools
Resource pools are based on the memory and CPU that is available to the SQL Server instance where you are configuring the Resource Governor, not the total resources available to the OS. Resource pools are like mini SQL Server instances inside of an instance. The OS shares memory and CPU between SQL Server instances in the same way a SQL Server instance shares memory and CPU between resource pools.
There are two resource pools created when you install SQL Server 2008 (called internal and default). The internal resource pool is designated for all of the internal Database Engine processing. You cannot modify the internal resource pool, and it cannot be accessed by any workload groups other than the internal workload group. Also, the CPU and memory are never limited in an internal resource pool. The internal resource pool takes whatever it needs at the time, and the rest of the resource pools divide the remaining CPU and memory appropriately. The default resource pool is where all processes run that have not been assigned to a specific resource pool.
You can create a user-defined resource pool and set the Min and Max properties for CPU and memory. You can change the properties for a resource pool on the fly, and the new settings will apply to any new incoming requests.
![]() Tip The Resource Governor does not apply to incoming requests initiated by the dedicated administrator connection (DAC). You should enable the DAC on the SQL Server instances where you are running the Resource Governor for troubleshooting purposes.
Tip The Resource Governor does not apply to incoming requests initiated by the dedicated administrator connection (DAC). You should enable the DAC on the SQL Server instances where you are running the Resource Governor for troubleshooting purposes.
The combined minimum totals for CPU and memory cannot exceed 100, while the valid values for the maximum setting for each resource pool are anything greater than the minimum setting and not greater than 100. When you define a minimum setting for a resource pool, you are guaranteeing that resource pool will always have at least the minimum amount of CPU and memory specified, which explains why the total amount cannot exceed 100% of the available resources. The maximum settings for resource pools can overlap, and the available memory will be shared accordingly. The maximum settings are also only enforced during times of CPU and memory pressure. For example, if you define a resource pool with a maximum CPU of 20%, the resource pool may actually use 80% of the CPU if the resources are available. The script in Listing 16-14 will create the Backup and Reporting resource pools shown in Figure 16-15.
Listing 16-14. Script to Create the Backup and Reporting Resource Pools and Enable Resource Governor
--Create the Backup pool

CREATE RESOURCE POOL BackupPool

 WITH

( MIN_CPU_PERCENT = 0,

 MAX_CPU_PERCENT = 20,

 MIN_MEMORY_PERCENT = 0,

 MAX_MEMORY_PERCENT = 20)

GO


--Create the Reporting pool

CREATE RESOURCE POOL ReportingPool

 WITH

( MIN_CPU_PERCENT = 0,

 MAX_CPU_PERCENT = 25,

 MIN_MEMORY_PERCENT = 0,

 MAX_MEMORY_PERCENT = 25)

GO


--Enable Resource Governor

ALTER RESOURCE GOVERNOR RECONFIGURE

GO
We have set the maximum CPU and memory for the Backup pool to 20% and the Reporting pool to 25%. This means that whenever there is resource pressure, the Backup and Reporting pools will only take an average of 45% of the available resources, leaving 55% for all the other requests in the default resource pool. Remember, the internal resource pool will take all the resources it needs, and the rest is considered available to split among the remaining resource pools. The first time you run the ALTER RESOURCE GOVERNOR RECONFIGURE statement, you are enabling the Resource Governor. To disable the Resource Governor, run the ALTER RESOURCE GOVERNOR DISABLE statement.
Workload Groups
The Resource Governor uses workload groups as a way to segregate all incoming requests that have predefined common characteristics together as a single unit. Workload groups allow you to define and monitor specific attributes for each individual workload group, as you will see in the “Monitoring Resource Governor” section. You can also dynamically move workload groups between resource groups if you determine they would be better suited for a different resource pool based on your monitoring statistics. Workload groups consist of two predefined groups that map to the corresponding resource pool: internal and default. The same rules apply to the internal and default workload groups that we discussed for the internal and default resource pools. You can set the following properties when creating a workload group:
IMPORTANCE: The weight of importance a workload group is given within a resource pool. Workload groups with different levels of importance do not affect each other outside of each resource pool. Valid values areLOW,MEDIUM, andHIGHwith the default beingMEDIUM.REQUEST_MAX_MEMORY_GRANT_PERCENT: The maximum percentage of memory that a single request is allowed to consume from a given resource pool. The valid range is from 0 to 100 with a default setting of 25.REQUEST_MAX_CPU_TIME_SEC: The maximum amount of time (in seconds) that a request will run before generating theCPU Threshold Exceededevent. Resource Governor will not prevent the query from running; it will just raise the event so you can capture requests that exceed your defined threshold. Valid values are 0 or greater with a default setting of 0, which is unlimited.REQUEST_MEMORY_GRANT_TIMEOUT_SEC: The maximum amount of time a query will wait (in seconds) for a memory grant to become available. Valid values are 0 or greater with a default setting of 0, which means an internal calculation based on the query cost will be used to determine the maximum time.MAX_DOP: The maximum degree of parallelism for the workload group. The default is 0, which uses the global SQL Server setting forMAX_DOP.GROUP_MAX_REQUESTS: Maximum number of simultaneous requests the workload group can execute at any given time. Valid values are 0 or greater with a default setting of 0, which is unlimited.
Let's create the workload groups shown in Figure 16-15 and assign them to their respective resource pools. The script in Listing 16-15 will create the BackupGroup, ReportingGroup, and the TestingGroup and reconfigure the Resource Governor so they will be immediately active and awaiting processes.
Listing 16-15. Script to Create the Backup, Reporting, and Testing Workload Groups
CREATE WORKLOAD GROUP BackupGroup

USING BackupPool

GO


CREATE WORKLOAD GROUP ReportingGroup

WITH

 (IMPORTANCE = MEDIUM,

 REQUEST_MAX_MEMORY_GRANT_PERCENT = 30,

 REQUEST_MAX_CPU_TIME_SEC = 0,

 REQUEST_MEMORY_GRANT_TIMEOUT_SEC = 0,

 MAX_DOP = 0,

 GROUP_MAX_REQUESTS = 0)

USING ReportingPool

GO


CREATE WORKLOAD GROUP TestingGroup

WITH

 (IMPORTANCE = LOW,

 REQUEST_MAX_MEMORY_GRANT_PERCENT = 20,

 REQUEST_MAX_CPU_TIME_SEC = 180,

 REQUEST_MEMORY_GRANT_TIMEOUT_SEC = 0,

 MAX_DOP = 1,

 GROUP_MAX_REQUESTS = 20)

GO


ALTER RESOURCE GOVERNOR RECONFIGURE

GO
If you look at the BackupGroup, you will see that all of the parameters are optional; you are not even required to specify the resource pool. If you do not manually assign a workload group to use a specific resource pool, it will automatically be assigned to the default resource pool. If you look at the TestingGroup, you can see that we did not assign it to a specific resource pool, since we want to create it in the default resource pool. We have throttled back the TestingGroup quite a bit, giving it low priority, only 20% of the resource pool for a single request, only one processor, and allowing it to run only 20 processes at any given time. We have also configured the TestingGroup to raise an event every time it executes a query that takes longer than 180 seconds. At this point, your workload groups are configured and waiting for incoming processes. Your current configuration in SQL Server Management Studio should mirror the configuration shown in Figure 16-16. The next step is to configure the classifier function to send the processes to the appropriate workload groups.
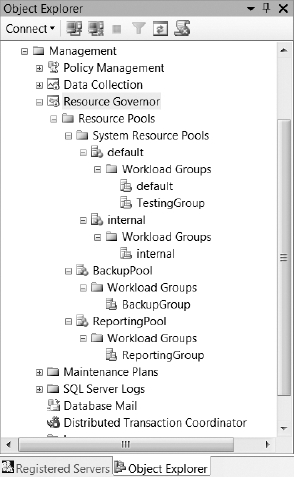
Figure 16-16. Resource Governor configuration in SQL Server Management Studio
Classifier Function
The classifier function is a T-SQL function that is executed for each login, which allows you to write logic to route incoming requests to the appropriate workload group. You must create the classifier function in the master database, and the Resource Governor can only use one classifier function at any given time. You can, however, create multiple classifier functions and dynamically change which function the Resource Governor uses. You can use the following functions to help you create your classifier function:
HOST_NAME()APP_NAME()SUSER_NAME()SUSER_SNAME()IS_SRVROLEMEMBER()IS_MEMBER()LOGINPROPERTY(suser_name(),'DefaultDatabase')LOGINPROPERTY(suser_name(),'DefaultLanguage')ORIGINAL_DB_NAME()CONNECTIONPROPERTY(<PropertyName>)
You can also create a lookup table to help you with your classifier function. For example, you may want to send certain processes to a different workload group, depending on a schedule you have defined in your lookup table. However, you need to keep in mind that SQL Server will execute the classifier function for each login, so it should be as efficient as possible in order to prevent performance issues. A good thing to keep in mind is that the dedicated administrator connection will never be classified, so you can always log in using this connection to fix any issues you may encounter.
![]() Caption The workload groups used in the classifier function are case sensitive. If you do not use the correct case when referencing the workload groups, the requests will be routed to the default workload group.
Caption The workload groups used in the classifier function are case sensitive. If you do not use the correct case when referencing the workload groups, the requests will be routed to the default workload group.
Let's create a classifier function that will route the incoming requests to the workload groups shown in Figure 16-15 by running the script in Listing 16-16.
Listing 16-16. Code to Create and Enable a Classifier Function
USE master

GO


CREATE FUNCTION RG_Classifier_V1 ()

RETURNS sysname

WITH SCHEMABINDING

AS

BEGIN


    DECLARE @GroupName sysname


   IF (IS_MEMBER('KEN-PCTestingGroup') = 1)

      SET @GroupName = 'TestingGroup'


    ELSE IF (APP_NAME() LIKE '%REPORT SERVER%')

      SET @GroupName = 'ReportingGroup'


    ELSE IF (SUSER_NAME() = 'BackupUser')

      SET @GroupName = 'BackupGroup'


    ELSE

      SET @GroupName = 'default'


   RETURN @GroupName


END

GO
--Assign the function to the Resource Governor and reconfigure

ALTER RESOURCE GOVERNOR WITH (CLASSIFIER_FUNCTION = dbo.RG_Classifier_V1)

GO

ALTER RESOURCE GOVERNOR RECONFIGURE

GO
You can see the completed configuration (shown in Figure 16-17) by right-clicking on Resource Governor in SQL Server Management Studio and selecting Properties from the context menu.
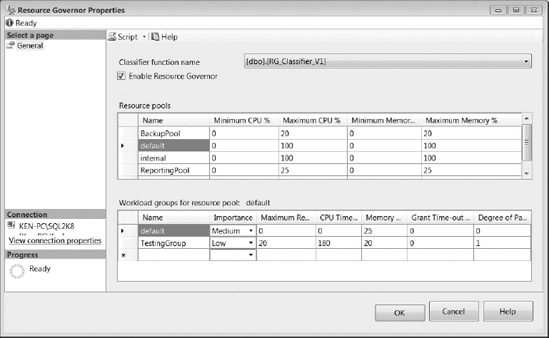
Figure 16-17. Resource Governor properties
In order to remove a classifier function from the Resource Governor, you can run the ALTER RESOURCE GOVERNOR statement and specify the new classifier name, or NULL if you want to remove all classifier functions and send all requests to the default workload group. The statement in Listing 16-17 will remove all classifier functions from the Resource Governor.
Listing 16-17. Code to Remove All Classifier Functions from the Resource Governor
ALTER RESOURCE GOVERNOR WITH (CLASSIFIER_FUNCTION = NULL);

GO

ALTER RESOURCE GOVERNOR RECONFIGURE;
Monitoring Resource Governor
Knowing how to monitor your Resource Governor configuration allows you to validate the choices you made during the setup process. Resource Governor monitors provide you with the essential data needed to alter and adapt your configuration based on informed decisions instead of just making random configuration changes and hoping for the best. You can monitor your Resource Governor configuration using performance counters, trace events, and views.
Performance Counters
There are two new performance counters you can use to collect information about resource groups and workload groups: SQLServer:Workload Group Stats and SQLServer:Resource Pool Stats. Both of these performance counters expose several properties in PerfMon and the sys.dm_os_performance_counters DMV. You can run the query in Listing 16-18 to see a list of properties returned for both of these performance counters for the default workload group and resource pool.
Listing 16-18. Performance Counters for the Default Workload Group and Resource Pool
SELECT *

FROM sys.dm_os_performance_counters

WHERE object_name IN

  ('MSSQL$SQL2K8:Workload Group Stats','MSSQL$SQL2K8:Resource Pool Stats')

    AND instance_name = 'default'
The results of Listing 16-18 are displayed in Figure 16-18. As you can see, there is a lot of valuable information you can gather using these performance counters.
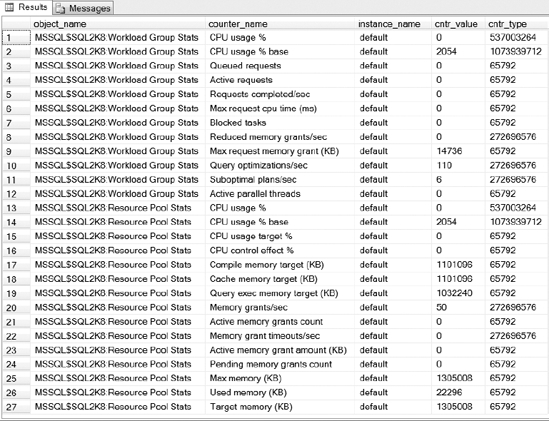
Figure 16-18. Resource Governor performance counters
Using these counters in PerfMon will provide a more interactive experience showing changes in real time. If you alter your Resource Governor configuration, the PerfMon counters will reflect the changes immediately. Using PerfMon is extremely useful when adding and comparing counters from different workload groups and resource pools.
Trace Events
There are three valuable trace events that you can use to obtain information about Resource Governor: CPU Threshold Exceeded, PreConnect:Starting, and PreConnect:Completed. The CPU Threshold Exceeded event will fire whenever a query exceeds the REQUEST_MAX_CPU_TIME_SEC value you set for a workload group. From the CPU Threshold Exceeded event, you can obtain the workload group where the violation occurred, the spid of the process that caused the violation, and when the violation occurred. The CPU Threshold Exceeded event occurs every five seconds, so there is a slight chance that you could exceed the query threshold and not trigger the event. You can use the PreConnect:Starting and PreConnect:Completed events to determine how efficient your classifier function is operating. The PreConnect:Starting event fires when the classifier function begins execution, and the PreConnect:Completed event fires after it has finished. As you can see in Figure 16-19, the CPU Threshold Exceeded event is located under Errors and Warnings, and the PreConnect:Starting and PreConnect:Completed events are located in the Sessions section in SQL Server Profiler.
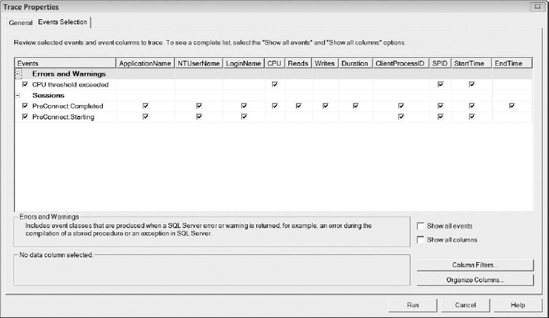
Figure 16-19. Resource Governor trace events
Views
There are six views, three DMVs, and three catalog views, all of which provide insight into your Resource Governor configuration. The DMVs provide statistical information, while the catalog views provide information about your current configuration. The Resource Governor DMVs are shown in Listing 16-19.
Listing 16-19. Resource Governor Dynamic Management Views
SELECT * FROM sys.dm_resource_governor_workload_groups

SELECT * FROM sys.dm_resource_governor_resource_pools

SELECT * FROM sys.dm_resource_governor_configuration
If you execute the code in Listing 16-19, you should receive results similar to the output shown in Figure 16-20. You can run the ALTER RESOURCE GOVERNOR RESET STATISTICS statement in order to reset the DMV statistics.
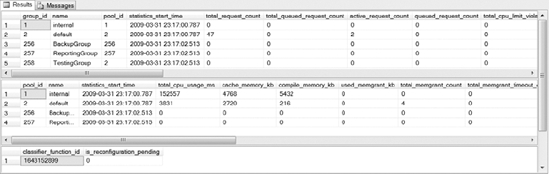
Figure 16-20. Resource Governor DMV sample output
The Resource Governor catalog views are shown in Listing 16-20. The catalog views provide the same basic information you could find by selecting Resource Governor Properties from SQL Server Management Studio.
Listing 16-20. Resource Governor Catalog Views
SELECT * FROM sys.resource_governor_workload_groups

SELECT * FROM sys.resource_governor_resource_pools

SELECT * FROM sys.resource_governor_configuration
Figure 16-21 shows the output returned from running the code in Listing 16-20. This is just an alternative way to get information about your current configuration without having to dig through SQL Server Management Studio.
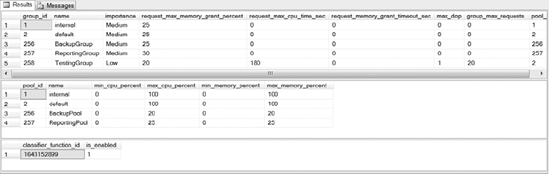
Figure 16-21. Resource Governor catalog view sample output
Summary
SQL Server 2008 provides many enhancements to help you manage query performance. Many of the enhancements shown in this chapter were introduced in SQL Server 2005 and built upon in SQL 2008 to provide you with more granular control over your queries. Some enhancements, such as the Resource Governor, lay an entirely new foundation for managing query performance. By providing more granular control over your query performance, SQL Server 2008 allows you to maintain a more robust and predictable environment; which results in fewer phone calls because of rogue queries running out of control.