
If you think about Web 2.0, chances are you'll think about mashups—the aggregation of various types of content. Typically, mashups take data from multiple sources and combine them into a single presentation. The goal is to create a whole that is more than the sum of the individual parts, enabling users to gain insight that would be difficult to achieve by examining each stack of information separately. In this chapter, we will detail how, as a developer, you can take advantage of SharePoint to build a mashup. This solution will combine data from multiple sources: a SharePoint list, a geocoded RSS feed, and a KML (Keyhole Markup Language) file. The result will be an interactive map containing the aggregate data.
Many organizations we've met with have expressed an interest in bringing together data from siloed resources into a single composite. One military group responsible for responding to base emergencies would like to see weather information, emergency vehicle location, and building information on a single interface. Other military groups, who use lots of applications in war gaming where they simulate possible events and responses, realize they could benefit from this type of solution. A university we met with would like to bring together data about their applicants and registration events. Lots of commercial customers understand the advantage of seeing sales data overlaid with store locations, sales districts, etc. In fact, this is becoming such a trend that major software companies such as Google, Yahoo, and Microsoft are all investing in ways for organizations to publish their data and for consumers to retrieve and analyze it. Feedburner, purchased by Google, provides a platform for content publishers to expose their content through RSS feeds. Yahoo Pipes is a web-based application that enables users to aggregate feeds into mashups. Microsoft announced a project code-named Dallas that looks to establish a marketplace for such data exchanges. For more information on Dallas, or to create a developer account, visit http://www.microsoft.com/windowsazure/dallas/. We will not use Dallas in this chapter as at the time of this writing it is still in an early beta stage, however, the same techniques used here could easily be applied to its datasets.
To provide some context for our solution, we decided to create a composite that shows national parks in the United States, a user-maintained SharePoint list of campgrounds, and a newsfeed about wildlife disease alerts. Together these data sources could be used by an organization planning the placement of new campgrounds, a user arranging a camping trip, or park service personnel looking for trends. Each of these data sources is public information and is stored in a different format, making them good examples for showing how to retrieve data for mashups. Our solution will leverage the Bing Maps Silverlight Control SDK to provide the interactive map surface to layer the data; this control will be the main focus of our Silverlight mashup solution.
The national parks data will be loaded via a KML file, and the wildlife newsfeed is available as a geocoded RSS feed. We will write code using SharePoint's client library for Silverlight to retrieve campground information that will be stored in a customized contact list. The customizations will include new fields for Latitude, Longitude, and Geocoded Status. The good news is that we will not require users to use some other tool to translate addresses of campgrounds into coordinates. Instead, we'll include an event handler that calls a Bing Maps web service to geocode the campground's address. Since the geocoded contacts list is a piece of functionality that is obviously reusable, we will deploy it as a SharePoint feature so that any site administrator can simply turn it on to add this capability to his site. The actual Silverlight map, which is site-specific, will be deployed as a SharePoint sandboxed solution.
This section covers the major elements of the solution and the decisions that were made in coding it. The walkthrough shows you how to create the Silverlight application, install the Bing Maps Silverlight control, and lay out the mashup's user controls. We will describe how to consume the geocoded RSS feed and place red circles for each wildlife disease alert onto the map's interface. You'll learn how to parse the KML file of US national parks. For each park, we will place a custom icon at the park's location and support a mouse-over event that displays the selected park's name. You'll see how to retrieve data from a SharePoint list from within the Silverlight mashup and use it to place push pins onto the map for each campground, including a mouse-over for the name of the campground. You'll then build a set of reusable customizations as a SharePoint feature to support an extended contact list that provides geocoding of the contacts' addresses. Finally, we will deploy the mashup as a sandboxed solution and show you how to wire everything up on a test site.
Before diving into Visual Studio 2010 and building the mashup application, you need to establish a Bing Maps developer account, then download and install the Bing Maps Silverlight Control SDK. To create a free developer account, visit the Bing Maps Account Center (https://www.bingmapsportal.com). On the left-hand menu, you'll see options to create your account and a Bing Maps key. This key is a string the solution needs to pass to Bing whenever you use its functionality, such as displaying a map or asking it to geocode an address.
Register your account with the system using a Windows Live ID. To create the key, you have to specify an application name as well as a URL. We named our application SharePointDevSample and used the URL of our main SharePoint site collection, http://edhild3/sites/mashup. Remember to use your key as you build out the application. If you download the solution from the Apress web site, you still have to generate an application key and replace it where necessary in the solution. We will be sure to highlight those locations as we go along.
Next, you need to download and install the Bing Maps Silverlight Control SDK into your development environment as this control provides the map for our mashup. You can find the SDK at http://www.microsoft.com/downloads/details.aspx?displaylang=en&FamilyID=beb29d27-6f0c-494f-b028-1e0e3187e830.
In case you haven't yet ventured into development with Bing Maps, we have collected some very useful links that will give you a solid introduction. Since map development isn't something all SharePoint developers have in their tool belt, we will be sure to explain everything we are doing in this area. However, we are just scratching the surface with this example, so if you want to know more about this topic, these links are the place to start. The best link of the group is the Interactive SDK, which allows you to specify an action you want to do with the map and then shows you the necessary code to make it happen.
Bing Maps Platform Overview
http://www.microsoft.com/maps/developers/
Bing Silverlight Map Control Interactive SDK
http://www.microsoft.com/maps/isdk/silverlight/
Bing Maps SDKs
http://msdn.microsoft.com/en-us/library/dd877180.aspx
Bing Maps Silverlight Control Code Samples from PDC 2009
http://blogs.msdn.com/veplatform/archive/2009/11/20/bing-maps-silverlight-control-code-samples-available-from-pdc09.aspx
We will start building this solution with a Silverlight application, which is the mashup itself. Simply start Visual Studio and create a new project. Under the C# language node, select Silverlight to display the Silverlight project templates, then choose Silverlight Application. Name the project MashupMap. Leave the default option of creating a directory for the solution and confirm that the .NET framework drop-down at the top of the dialog is set to .NET Framework 3.5. This lets us use Silverlight version 3 for the mashup, which is supported by SharePoint. Your New Project dialog should look like Figure 14-1.

When you click OK, the New Silverlight Application wizard will ask you about a few configuration options for the project.
Note
You may get prompted by Visual Studio 2010 that you need to download the Silverlight Development environment. If so, download the installer Visual Studio directs you to, install it, and retry creating the project.
The first set is about how the Silverlight application is going to be hosted. Though eventually the mashup will be hosted in SharePoint, having an ASP.NET test harness can be useful for debugging early in the process. Leave the default options to create a companion ASP.NET web application. Confirm under the Options heading that the target Silverlight version is Silverlight 3. Click OK.
After the new project is created, your solution already contains a few files, visible in the Solution Explorer window of Visual Studio. One file in the Silverlight project, MainPage.xaml, is our design surface where we will lay out the controls that make up the mashup user interface. In the ASP.NET testing web site that was created for you, you'll see a ClientBin folder. This is where the mashup application will be deployed as a Silverlight package (.xap) file when you are debugging, before you publish the mashup to SharePoint. The HTML and ASPX pages there are simply test harnesses that load the Silverlight application onto the page.
Before jumping into the code, let's get a few other items out of the way. First, there are some assemblies we need to add references to in the MashupMap project:
Microsoft.Maps.MapControl and Microsoft.Maps.MapControl.Common: These two assemblies are part of the Bing Maps Silverlight Control SDK and include the control and classes we'll need to build the mashup. Assuming you installed the SDK as described above, you'll find these assemblies at
C:Program Files (x86)Bing Maps Silverlight ControlV1Libraries.System.ServiceModel.Syndication: This assembly contains classes such as SyndicationFeed that we'll use to work with the RSS data source.
System.Xml.Linq: This assembly will allow us to use LINQ-style queries to parse the XML content we get back from some of our data sources.
System.Windows.Controls.Data.Input: This assembly contains some of the controls we will use in our markup such as the Label control. Normally this will add automatically as you drag controls onto the design surface, but if you are just copying our XAML, you will need to add the reference.
Microsoft.SharePoint.Client.Silverlight and Microsoft.SharePoint.Client. Silverlight.Runtime: These assemblies represent the client-side library and runtime for Silverlight applications. As discussed in Chapter 3, SharePoint 2010 provides several different types of client-side libraries, enabling communication from solutions not running on the SharePoint server. Our Silverlight application runs within the context of the browser's Silverlight plug-in, so it is not on the server. You'll find these assemblies at
C:Program FilesCommon FilesMicrosoft SharedWeb Server Extensions14TEMPLATELAYOUTSClientBin.
Now that the appropriate references have been added, you can add the using statements into the code file we'll be modifying. Listing 14-1 indicates the using statements that need to be added to the code-behind file of the user control, MainPage.xaml.cs.
Example 14-1. Using Statements
using SP = Microsoft.SharePoint.Client;
using Microsoft.SharePoint.Client;
using Microsoft.Maps.MapControl;
using System.Xml;
using System.ServiceModel.Syndication;
using System.IO;
Switching to the designer for MainPage.xaml, we can begin to lay out the user interface for our Silverlight mashup. This includes the Bing maps control with a tools column on the right-hand side that enables the user to hide or show any of the data sources on the map, as well as re-query the wildlife disease alerts RSS feed. Figure 14-2 shows the result we are looking for.

When building a Silverlight user interface, you can either lay out the Silverlight XAML yourself in Visual Studio or use a design tool like Microsoft's Expression Blend 3. Blend gives you more of a designer's experience, allowing you to drag controls, set their properties, control animations, and rendering preferences such as brushes, gradients, and fills. With Visual Studio, on the other hand, you'll find yourself frequently editing the XML markup. There are many references on Silverlight user interface design, so we won't turn this chapter into that. If you want the exact interface we built, just grab the markup from the code download, but do feel free to design your own. You will have to at least build your project once to see the interface since our XAML markup includes references to the project assembly. You may also want to comment out the KMLElementCollection markup and the ParkLayer until we add that functionality later. We will detail the crucial elements of the markup as we go through the chapter. Already, as shown in Listing 14-2, the definition of the namespaces includes some that are not in the default markup.
Example 14-2. Namespaces for the Silverlight User Control
<UserControl xmlns:my="clr-namespace:System.Windows.Controls;assembly=System.Windows.Controls.Data.Input" x:Class="MashupMap.MainPage" xmlns="http://schemas.microsoft.com/winfx/2006/xaml/presentation" xmlns:x="http://schemas.microsoft.com/winfx/2006/xaml" xmlns:d="http://schemas.microsoft.com/expression/blend/2008" xmlns:mc="http://schemas.openxmlformats.org/markup-compatibility/2006" xmlns:m="clr-namespace:Microsoft.Maps.MapControl;assembly=Microsoft.Maps.MapControl" xmlns:db="clr-namespace:MashupMap" mc:Ignorable="d" d:DesignHeight="400" d:DesignWidth="600" Loaded="UserControl_Loaded">
The two namespaces that are new here are m and db. The m namespace is for the Bing Maps control and enables us to add it to the markup. The db namespace is for this project itself. By placing it here, we will be able to databind controls to the classes in our solution. This technique will be used for the national parks data source later in this chapter. Notice that we have specified the height and width of the control as well as an event handler for the control's loaded event, which we'll write code for in the code-behind.
The layout of the mashup is a grid with two columns; Listing 14-3 shows the beginning of the XAML for this layout. The first column contains the Bing Maps control. Notice that you need to specify the application key you generated at the Bing Maps Account Center. Within the map declaration, you also specify that you want the mode of the map to show an aerial view with labels. By combining the zoom level with a center location, we focus the map on the United States. You may be wondering how we picked this location. The interactive SDK includes an example of how to center the map to specific locations. The United States was one of the choices and we just copied the resulting markup from the SDK into our Silverlight control. For right now, we'll ignore the markup within the map control that defines layers for our data. We will cover it later in this chapter as we focus on each of the data sources.
Example 14-3. XAML Layout of the Mashup User Interface
<Grid x:Name="LayoutRoot" Background="White" Width="600" Height="400">
  <Grid.ColumnDefinitions>
     <ColumnDefinition Width="458*" />
     <ColumnDefinition Width="142*" />
  </Grid.ColumnDefinitions>
  <m:Map x:Name="mapControl" Grid.Column="0"
         CredentialsProvider="YOUR BING MAPS KEY" Mode="AerialWithLabels"
         Center="39.3683,-95.2734,4.0" ZoomLevel="3" >
...
  </m:Map>
The second half the XAML for the mashup is shown in Listing 14-4. The main component is a stackpanel control that renders the user interface for the tools area. The stackpanel control takes its nested controls and arranges them horizontally or vertically. The checkbox controls are a bit interesting here in that we have specified event handlers for both the Checked and Unchecked events. The easiest way to specify these event handlers is to place your cursor on the control in the XAML and use Visual Studio's properties window to browse that control's events. Double-clicking on an event will wire up an event handler in the code-behind file. Note that in Silverlight, unlike ASP.NET, there are two separate events for the checkbox, as opposed to one where you respond to both cases.
Example 14-4. XAML Layout of Tools Area of the Mashup
<StackPanel Grid.Column="1" Height="400" HorizontalAlignment="Left"
              Name="stackPanel1" VerticalAlignment="Top" Width="142"
              Background="Beige" >
    <my:Label Content="Tools" FontSize="16" FontWeight="Bold"
              HorizontalAlignment="Center" Margin="0,10,0,10" />
    <CheckBox x:Name="ShowParks" Content="Show National Parks" Margin="5,5,0,5"
              Checked="ShowParks_Checked" Unchecked="ShowParks_Unchecked" />
    <CheckBox x:Name="ShowContacts" Content="Show Campgrounds" Margin="5,5,0,5"
              Checked="ShowContacts_Checked" Unchecked="ShowContacts_Unchecked" />
<CheckBox x:Name="ShowWildlifeAlerts" Content="Show Wildlife Alerts"
Margin="5,5,0,5" Checked="ShowWildlifeAlerts_Checked"
Unchecked="ShowWildlifeAlerts_Unchecked" />
<Button x:Name="loadFeed" Content="Load Alerts" Width="100" Margin="5,5,0,5"
Click="loadFeed_Click" />
</StackPanel>
</Grid>In the next few sections, we'll add a data source to the mashup. This will include more detail on the XAML for the map layers. Think of each map layer as a transparent sheet of paper that we are drawing on with a marker and then placing on top of the map's surface. As each layer is placed on top of the map, it is also being placed on top of other layers. This is why the InfoLayer that represents the flyout for the mouse-over event is defined last—it needs to be able to be seen above any of the other visualizations.
We will also explore the code for loading and parsing data, as well as for interacting with the tools controls. Though we will not be walking through the layers in the same order they are set in the XAML, the order does matter.
RSS stands for "Really Simple Syndication." It has become a popular way to publish content that is frequently added to or updated. The publishers don't want to burden users with continually having to point their browsers back to a specific site to see updates. Instead, users subscribe to the RSS feed, causing short summaries to be pulled by the user on a regular basis. The feed can be rendered in RSS readers such as a desktop gadget in Windows 7 or Windows Vista, Microsoft Outlook, or even other web sites. An RSS feed is said to be geocoded when it includes coordinates (latitude and longitude) specifying the location that is referenced or referred to in the content. For this example, we will use wildlife disease alerts from the National Biological Information Infrastructure (NBII). You can read more about the Wildlife Disease Information Node of this organization at http://www.nbii.gov/images/uploaded/8496_1258549821937_WDIN-DiseaseNewsMap.pdf. Their geocoded RSS feed is exposed through Feedburner and can be accessed at the following URL http://feeds.feedburner.com/wdinNewsDigestGeoRSS. Feedburner is a tool that provides enhanced services for publishers beyond simply making their information available. It includes traffic analysis and publicizing features, among many others. Listing 14-5 shows just one item from the feed. Notice that it includes information about the content as well as coordinates specifying the location.
Example 14-5. A Wildlife Disease Alert RSS Item
<item>
<title>Wild deer disease surveillance continues; new bovine TB positive deer
Confirmed (Minnesota, United States)
</title>
<link>http://feedproxy.google.com/~r/wdinNewsDigestGeoRSS/~3/sG0gnVzDSnA/</link>
<pubDate>Mon, 21 Dec 2009 00:00:00 −0600</pubDate>
<description>Published by Minnesota Department of Natural Resources –
www.dnr.state.mn.us on 12/21/2009 - With test results for the entire fall
sample of hunter-harvested deer in northwestern Minnesota pending, tissue
samples from one suspect deer submitted for expedited testing have come back
positive for bovine tuberculosis (TB).<imgsrc="http://feeds.feedburner.com/~r/wdinNewsDigestGeoRSS/~4/sG0gnVzDSnA"
height="1" width="1"/>
</description>
<source>Minnesota Department of Natural Resources - www.dnr.state.mn.us
</source>
<guid isPermaLink="false">http://news.dnr.state.mn.us/index.php/2009/12/21/wild -deer-disease-surveillance-continues-new-bovine-tb-positive-deer-confirmed/
</guid>
<georss:point>46.3478823547 −94.1990570584</georss:point>
<feedburner:origLink>http://news.dnr.state.mn.us/index.php/2009/12/21/wild-deer-
disease-surveillance-continues-new-bovine-tb-positive-deer-confirmed/
</feedburner:origLink>
</item>
-deer-disease-surveillance-continues-new-bovine-tb-positive-deer-confirmed/
</guid>
<georss:point>46.3478823547 −94.1990570584</georss:point>
<feedburner:origLink>http://news.dnr.state.mn.us/index.php/2009/12/21/wild-deer-
disease-surveillance-continues-new-bovine-tb-positive-deer-confirmed/
</feedburner:origLink>
</item>Note
Just in case you are modifying the examples as you go along to access some other data source, you need to be aware that Silverlight has a security feature that can cause problems loading data you don't own. This feature requires that the data source publish a policy allowing its data to be consumed from another domain. Many web sites lack this policy, though major syndicators usually include it, which is why we are using Feedburner as the source in this example. For more information, see http://timheuer.com/blog/archive/2008/06/03/use-silverlight-with-any-feed-without-cross-domain-files.aspx.
With an understanding of our data source, let's move on to getting the data onto our map. For this example, we simply want to have a red circle placed at the coordinates specified by the alert. Our first step is to add a layer to the map control, which you can do using the XAML in Listing 14-6. Notice that the default visibility is set to collapsed, which will hide the layer and its contents until a user asks to see it on the map.
Example 14-6. The MapLayer for Wildlife Alerts
<m:MapLayer x:Name="AlertLayer" Visibility="Collapsed">
</m:MapLayer>
We decided with this data source that we would retrieve the data on demand for the user. There wasn't a strong reason for this choice, other than to provide a different behavior from the other data sources that we'll load automatically when the mashup is loaded for the user. The initial request is made when the user clicks the Load Alerts button (loadFeed) in the tools area of the mashup. The loadFeed event handler is shown in Listing 14-7. We use a Boolean variable to track whether we've previously loaded the data. If we have, the first thing the event handler does is clear any controls we had loaded into the layer, thus removing any red circles from a previous request. The event handler then creates a WebClient object to fetch the data. It is important to note that Silverlight is an asynchronous environment. This is why we specify a method (wc_OpenReadCompleted) to be called when the data has been retrieved and is ready for parsing.
Example 14-7. The Load Feed Button's Click Event Handler
private bool alertsLoaded = false;
private void loadFeed_Click(object sender, RoutedEventArgs e)
{
  if (alertsLoaded) AlertLayer.Children.Clear();
  WebClient wc = new WebClient();
  wc.OpenReadCompleted += new OpenReadCompletedEventHandler(wc_OpenReadCompleted);

  Uri feedUri = new Uri("http://feeds.feedburner.com/wdinNewsDigestGeoRSS",
                         UriKind.Absolute);
  wc.OpenReadAsync(feedUri);
}
Once the RSS feed's data has been retrieved, control switches to the web client's OpenReadCompleted method, shown in Listing 14-8. We check to make sure that there wasn't an error getting the data, then load the resulting XML data into a SyndicationFeed object that makes it easy for us to retrieve common properties of the items in the RSS feed. (We include a link in the Further Reading section of this chapter about the syndication object if you are interested in digging deeper.) For each item we construct a circle—an ellipse object whose height and width are equal—and place it on the map at the corresponding location. Note that in order to retrieve the latitude and longitude values, we had to do a bit more work as the SyndicationFeed and SyndicationItem objects are fairly generic. The point data is accessible through the item's ElementExtensions collection, but then we had to split the coordinates up as they are stored as a single string in the feed. The most important line of code here is when the ellipse object is added to the alert map layer at the specified location. At the end of the method, we simply record that we have parsed the feed and check the corresponding box on the mashup tools.
Example 14-8. Parsing the Geocoded RSS Feed
void wc_OpenReadCompleted(object sender, OpenReadCompletedEventArgs e)
{
  if (e.Error != null)
  {
    MessageBox.Show("Error: " + e.Error.Message.ToString());
    return;
  }
  using (Stream s = e.Result)
  {
     SyndicationFeed feed;
     using (XmlReader reader = XmlReader.Create(s))
     {
       feed = SyndicationFeed.Load(reader);
       foreach (SyndicationItem feedItem in feed.Items)
       {
         Ellipse ell = new Ellipse();
         ell.Height = 10;
         ell.Width = 10;
         ell.Fill = new SolidColorBrush(Colors.Red);
         string point = feedItem.ElementExtensions[0].GetObject<String>();
         string[] pointParts = point.Split(' '),
Location loc = new Location(double.Parse(pointParts[0]),
double.Parse(pointParts[1]));
AlertLayer.AddChild(ell, loc);
}
}
}
alertsLoaded = true;
ShowWildlifeAlerts.IsChecked = true;
}The last action our code took after loading and parsing the RSS feed was to mark the checkbox in the tools area for Wildlife Alerts. Since our mashup should be flexible enough to allow the user to see any combination of data, this checkbox is also used to hide or subsequently show again this layer of data. Listing 14-9 shows both the Checked and Unchecked event handlers for the checkbox for hiding or showing the map layer.
Example 14-9. Responding to the ShowWildlifeAlerts checkbox
private void ShowWildlifeAlerts_Checked(object sender, RoutedEventArgs e)
{
  if (!alertsLoaded)
  {
    MessageBox.Show("Please load the wildlife alerts feed");
    ShowWildlifeAlerts.IsChecked = false;
  }
  else
  {
    AlertLayer.Visibility = Visibility.Visible;
  }
}
private void ShowWildlifeAlerts_Unchecked(object sender, RoutedEventArgs e)
{
  AlertLayer.Visibility = Visibility.Collapsed;
}
At this point, you can debug your solution using the ASP.NET test harness that was created along with your Silverlight application. Simply pressing F5 will bring up the ASPX page with your Silverlight mashup map loaded. Click the load button and make sure your alert circles display correctly on the map. The result should look like Figure 14-3.

KML stands for Keyhole Markup Language, an XML schema for geographic information whose popularity is driven by the primary viewer—Google Earth. For this example, we will download a KML file from the Discovery Channel that contains information about national parks in the United States. You can obtain this file from http://dsc.discovery.com/utilities/googleearth/nationalparks/nationalparks.kml. Unlike in the previous example, this time we will download this file for our solution instead of requesting it online. This has to do with the security policy we noted earlier and with the fact that this list is not nearly as volatile as the previous example. You can grab our copy of this file from the code download or from the Discovery Channel directly. When we saved it, we named the file nationalparks.xml. You need to place the file in the ClientBin folder of the ASP.NET test harness application if you want to be able to debug this portion of the solution. We will address loading this file into the SharePoint site a bit later. In KML markup, the parks are Placemark items. You'll notice the latitude and longitude values show up twice in this file. This is because KML allows for the definition of the placemark as well as for controlling the position of the viewer's virtual camera (LookAt). Listing 14-10 shows an example placemark from the file (we truncated the description).
Example 14-10. A National Park KML Item
<Placemark>
<name>Glacier National Park</name>
<description><![CDATA[<a href="http://www.discovery.com/googleearth/?dcitc=w02-530-
    aj-0000&autoplay=true&blid=169202840&bctid=16938864"><img
    src="http://dsc.discovery.com/utilities/googleearth/nationalparks/gallery/
    glacierpark.jpg" width="320" height="240" border="0" alt="Glacier National Park"
    /></a><br /><font size="3" color="#000000">Picture: PhotoDisc/Getty Images
|</font><br /> <br /><font size="4"><strong>Inside Glacier National
Park</strong></font><br />Explore through video the gem of ...]]>
</description>
<Snippet>Glacier</Snippet>
<LookAt>
<longitude>-113.654822</longitude>
<latitude>48.756675</latitude>
<range>9444</range>
<tilt>0</tilt>
<heading>0</heading>
</LookAt>
<styleUrl>#discoveryPOIMap</styleUrl>
<Point>
<coordinates>-113.654822,48.756675,0</coordinates>
</Point>
</Placemark>This time, instead of loading on demand, we simply load the file when the Silverlight application loads. To accomplish this we need a new layer for the parks, and we will use a databinding technique to get icons placed onto the layer for each of the national parks in the KML file. Let's start with the map layer, which is shown in Listing 14-11.
Example 14-11. The MapLayer for National Parks
<m:MapLayer x:Name="ParkLayer" Visibility="Collapsed">
   <m:MapItemsControl x:Name="Parks"
      ItemTemplate="{StaticResource ElementTemplate}"
      ItemsSource="{StaticResource KMLElements}">
   </m:MapItemsControl>
</m:MapLayer>
Just like the last layer, this one starts hidden from the user. However, in this map layer there is a declaration of a map items control that will represent the shapes we put on the map for the national parks. In this case, we have specified both a data source and a XAML template that should be used for each item in the collection. These are Silverlight resource elements and are defined in the Resources area of the user control. The XAML is shown in Listing 14-12.
Example 14-12. Resource XAML Content for Databinding
<UserControl.Resources>
  <DataTemplate x:Key="ElementTemplate">
     <Image Width="29" Height="34" Source="nationalparksml.png"
            m:MapLayer.Position="{Binding Location}" Tag="{Binding Name}"
            MouseEnter="Park_MouseEnter" MouseLeave="Park_MouseLeave" />
  </DataTemplate>
  <db:KMLElementCollection x:Key="KMLElements" Source="nationalparks.xml" />
</UserControl.Resources>
Let's focus first on the db:KMLElementCollection element. Remember that the db namespace alias is actually set to be the namespace of our solution. This means that in our code download you will see a KMLElementCollection class that takes the responsibility of parsing the national parks KML file. This class was one we found in code samples from Microsoft's Professional Developer Conference in 2009, where the Bing Maps Silverlight Control SDK was announced. You can get this code and many other examples from http://blogs.msdn.com/veplatform/archive/2009/11/20/bing-maps-silverlight-control-code-samples-available-from-pdc09.aspx.
This class parses the XML of the file and creates a collection of KMLElement objects. For each national park, we add the XAML in the DataTemplate to our map layer. In this case, the data template is using an image control to place an icon at the specified coordinates. You can grab the nationalparksml.png icon file from our code download. Notice that the position of the image is bound to the Location property of the KMLElement object and its tag is bound to the Name property. We will use the tag later in the MouseEnter and MouseLeave events. The picture file itself should be added to the root of the Silverlight project. Make sure that its Build Action property is set to Resource so that the file is included in the Silverlight .xap package.
Note
You will not be able to place a GIF onto a map layer with the image control. We used a PNG format since we want to display a transparent background. JPGs are also common.
Since the data source and template are declaratively defined in the XAML, the KMLElementsCollection class will take care of getting our icons into the map layer when the mashup is first loaded. Of course, we hide that layer until the user clicks the checkbox to show this data. The code for hiding and showing the layer is very similar to the previous RSS source so we won't duplicate it here. The more interesting code relates to how we handle displaying the title of the national park when the user hovers over the icon on the map. Moreover, we will need this type of functionality for the campgrounds stored in a SharePoint list later, so it is important that the code is reusable and not specific to the parks. For that reason, in our code download, there's an InfoLayer map layer that is defined last in the XAML (meaning it is the top-most layer). Inside this layer we placed a Border object and a TextBlock control that we will use to display text for a mouse-over. We will dynamically hide, show, and position this content when needed. Notice that the layer is always visible, but the infoBox control is hidden by default. The XAML for the map layer is shown in Listing 14-13.
Example 14-13. The MapLayer for Mouse Over Displays
<m:MapLayer x:Name="InfoLayer" >
  <Border x:Name="infoBox" Background="White" Height="40" Width="150"
          Visibility="Collapsed" CornerRadius="10"  >
     <TextBlock x:Name="pinInfo" FontSize="10" Foreground="Black"
                FontWeight="Normal"  HorizontalAlignment="Left"
                Margin="5,5,0,0"  TextWrapping="Wrap"  />
  </Border>
</m:MapLayer>
Remember in the DataTemplate we specified event handlers for the MouseEnter and MouseLeave events of the image that represents the national park? These event handlers will hide, show, and position the infoBox, as well as place the name of the national park in the TextBlock. Listing 14-14 shows the Park_MouseEnter event handler, which gets a reference to the corresponding map element (pin) and sets the position of the infoBox to be that of the pin with a small offset. The tag is then retrieved and placed as the contents of the TextBlock and then shown to the user. Listing 14-14 also includes the Park_MouseLeave event handler, which hides the infoBox.
Example 14-14. Showing the Title of the Park in the Flyout
private void Park_MouseEnter(object sender, MouseEventArgs e)
{
  FrameworkElement pin = sender as FrameworkElement;
  MapLayer.SetPosition(infoBox, MapLayer.GetPosition(pin));
  MapLayer.SetPositionOffset(infoBox, new Point(20, −15));
  pinInfo.Text = pin.Tag as string;
  infoBox.Visibility = Visibility.Visible;
}
private void Park_MouseLeave(object sender, MouseEventArgs e)
{
  infoBox.Visibility = Visibility.Collapsed;
}
With this, we've finished getting the national parks KML data source onto our mashup. Double-check that you have the icon as a resource in the Silverlight project, the XML file in the ClientBin folder of the ASP.NET test harness, and the KMLElementsCollection code file in the solution. Running the ASP.NET test application and clicking the checkbox to show the national parks should result in something like Figure 14-4. Note that we are not showing the RSS feed data, but there is no reason why you couldn't combine them at this point.

The last data source for our mashup will be a SharePoint list of campgrounds. We will create this list by extending the out-of-the-box SharePoint contact list, adding three new fields in the process: Latitude, Longitude, and Geocoded Status. To accomplish this, we will create a new content type, site columns, and a list definition. We will also add an event handler so that when a user adds a contact, the system will use a Bing Maps web service to convert the contact's address into coordinates. However, we will postpone making these SharePoint customizations until a bit later in the chapter and, for now, assume we have such a list to complete the mashup and that the list is in the same SharePoint site. We begin with the code in Listing 14-15, which is the layer that will contain pushpins for each of the campgrounds.
Example 14-15. The MapLayer for Campgrounds
<m:MapLayer x:Name="PinLayer" Visibility="Collapsed" >
</m:MapLayer>
We will have to interact with a few SharePoint objects in order to get the campground data. The code in Listing 14-16 declares some variables to store the references to these SharePoint objects as field-level variables in the MainPage.xaml.cs file. Don't forget, though, that these are not server-side objects but rather objects from SharePoint's client-side libraries for Silverlight.
Example 14-16. SharePoint Client-Side Objects
SP.ClientContext context = null;
SP.Web web = null;
SP.List campgroundList = null;
SP.ListItemCollection campgroundItems = null;
We want to load the campground list items automatically when the mashup is loaded. Therefore, the code in Listing 14-17 issues the query for data in the UserControl_Loaded method of the mashup. Notice that the first thing we do is retrieve the current SharePoint context so we can then get a reference to the SharePoint site (web) where the user is viewing the mashup. This technique is one that SharePoint developers will recognize because it is the same technique used in server-side code. However, this code is client-side since the Silverlight application runs within the user's browser, not the SharePoint server. The client-side libraries were designed so that developers versed in server-side code would be able to make an easy transition.
Example 14-17. Requesting Geocoded Campground List Items
private void UserControl_Loaded(object sender, RoutedEventArgs e)
{
  context = SP.ClientContext.Current;
  web = context.Web;
  campgroundList = web.Lists.GetByTitle("Campgrounds");
  SP.CamlQuery query = new SP.CamlQuery();
  query.ViewXml = "<View><Query><Where><Eq>" +
      "<FieldRef Name='GeocodeStatus'/><Value Type='Choice'>Geocoded</Value>" +
      "</Eq></Where></Query></View>";
campgroundItems = campgroundList.GetItems(query); context.Load(campgroundItems); context.ExecuteQueryAsync(requestSucceeded, requestFailed); }
After obtaining a reference to the current site, we use the SP.Web object's Lists collection to find our campground list. It is worth pointing out that client-side libraries do not actually perform any operations against the server until an execute method is called. This is somewhat similar to a developer's experience with an ADO.NET command object. With a command object, you specify the stored procedure you want to call, define the connection, and hook up all the parameters for the query. But nothing really happens until the command object is executed. With SharePoint client-side libraries, you specify actions you want performed and then the context's object execute methods cause the round-trip with the server. In this example, we specify a CAML query to return campground list items where the GeocodeStatus choice column has a value of Geocoded. This is a column we will use to signal that our geocoded process with Bing Maps was successful. Last but not least, the method executes the query. Like all of our other requests for data sources, this one happens asynchronously so we specify two methods to route control to depending on whether or not the query is successful.
Since our query for the SharePoint list items is asynchronous, we have a little bit of work to do to make sure our handling of the response runs in a client thread that has access to our user controls. Listing 14-18 shows the code. These techniques are similar to those used by Windows Forms developers. Notice that both the requestSucceeded and requestFailed methods make use of an UpdateUIMethod delegate. By using the delegate, we can make sure that either the AddCampgroundPins or CampgroundsNotFound methods run in the appropriate thread.
Example 14-18. Managing Threading of the Completed Request
private delegate void UpdateUIMethod();

private void requestSucceeded(object sender, SP.ClientRequestSucceededEventArgs e)
{
  UpdateUIMethod updateUI = AddCampgroundPins;
  this.Dispatcher.BeginInvoke(updateUI);
}
private void requestFailed(object sender, SP.ClientRequestFailedEventArgs e)
{
  UpdateUIMethod updateUI = CampgroundsNotFound;
  this.Dispatcher.BeginInvoke(updateUI);
}
The CampgroundsNotFound method simply displays a message box with an error message. More interesting is the AddCampgroundPins method, shown in Listing 14-19, which adds new push pin shapes to our map layer. With this data source we are using columns of the list item to control the pin. The Latitude and Longitude fields specify where the pin should be placed. We use the Company column, which will store the name of the campground, as the pin's tag so that it will be displayed when the user places the mouse over the pin.
Example 14-19. Adding Push Pins for the Campgrounds
private void AddCampgroundPins()
{
  foreach (SP.ListItem item in campgroundItems)
  {
     Pushpin pin = new Pushpin();
     pin.Tag = item["Company"].ToString();
     double latitude = (double)item["Latitude"];
     double longitude = (double)item["Longitude"];
     Location loc = new Location(latitude, longitude);
     pin.Location = loc;
     pin.MouseEnter += new MouseEventHandler(pin_MouseEnter);
     pin.MouseLeave += new MouseEventHandler(pin_MouseLeave);
     PinLayer.Children.Add(pin);
  }
}
We won't go over the remaining code in the code download because it processes the pin's mouse events in the same manner as the flyouts we made for the national parks. In fact, it uses the same infoBox. And we won't cover the checkboxes for hiding and showing this map layer as they use the same technique described earlier. This time you can't use the ASP.NET test harness to debug you code since this data source is expected to be in the same SharePoint site as the mashup.
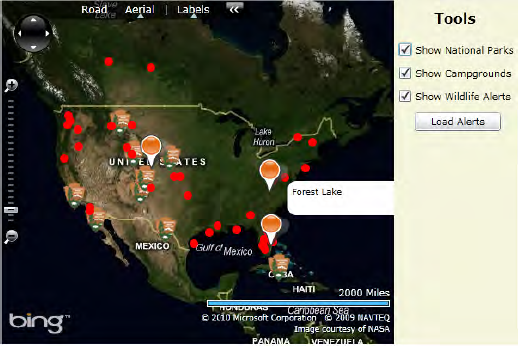
In the next section of the chapter, we will walk you through building a deployment vehicle, and then show how to get a geocoded campground list a bit later. To keep you going, Figure 14-5 shows the mashup with all three data sources and a flyover for a specific campground.
Since sandboxed solutions are new in SharePoint 2010, we will take a moment to explain what they are. Sandboxed solutions are SharePoint customizations whose code runs in a managed environment, isolated from SharePoint itself. This means that their assemblies are not deployed to the global assembly cache of the web front-end servers, They cannot crash the w3wp.exe worker processes that keep SharePoint up and running. These new type of solutions are intended to provide some sanity for IT pros who are responsible for maintaining environments that have evolved to support rapid application development. Too often with SharePoint 2007, developers deployed custom code that ran with full trust on the SharePoint servers and even within the same processes as the product itself. It only took one poorly written web part to impact the performance of the entire farm, and it was usually the IT pro's phone that rang first when the intranet was down, not the developer's. Sandboxed solutions are meant to provide a middle ground where IT pros can manage a stable server environment, yet developers can still provide customizations. If a sandboxed solution behaves poorly, such as erroring too frequently, the IT pro simply sets a threshold number of times it can fail before SharePoint no longer loads the customization. In this case, the SharePoint servers are still up and it is the developer who gets the call as to why his customizations are no longer on the site.
There are lots of things to learn about sandboxed solutions and we have included a link in the Further Reading section of this chapter. For now, consider them site-collection-specific solutions as opposed to enterprise SharePoint customizations. In fact, this is the main reason we have chosen to deploy the mashup as a sandboxed solution. It doesn't have code that will run on the server, but it does rely on aspects of the site it is running in. Sandboxed solutions also run with their own web.config file and have limits on which parts of the SharePoint object model they can call. Administrators can also place resource restrictions on them, such as CPU or memory utilization.
For this project, we will use a sandboxed solution to deploy the Silverlight mashup and the national parks XML file to a SharePoint site. Right-click on the solution in Visual Studio's Solution Explorer and choose Add New Project. Expand the Visual C# node, the SharePoint node, and select the 2010 node to display the SharePoint 2010 project templates. Select the Empty SharePoint Project template and make sure that the .NET Framework 3.5 is selected in the top drop-down. Name the project MapFeature. Your Add New Project dialog should look like Figure 14-6. Click OK.

The SharePoint Customization Wizard will start, and begin by asking you which SharePoint site you want to use for debugging. Any normal team site will do, but make sure that whichever one you choose you continue to use for other SharePoint projects we create in this chapter. In our environment we specified http://edhild3/sites/mashup. The rest of the dialog asks you whether or not this is a sandboxed solution. Choose the option to Deploy as a sandboxed solution. In this solution, we aren't going to write any new code, but rather create a SharePoint feature that places our Silverlight application and national parks XML file into a specific place in the site. To do this we will use a Module customization that allows us to add content to the site when the feature is activated. Use the following steps to add this to your MapFeature project.
Right-click on the MapFeature project and choose Add

Select the Module project item template and name it MashupMapModule. Click Add.
The previous step defines a new Feature in the project and associates the MashupModule with it. This module will have some sample markup in its
Elements.xmlfile that places asample.txtfile into the SharePoint site. Expand the MashupMapModule node in the project to find both these files.Delete the
Sample.txtfile from your project. Notice that the reference to it is now removed from the module's Elements file.Now right-click on the
nationalparks.xmlfile in Visual Studio's Solution Explorer window. This file should still be in theClientBinfolder of the Silverlight ASP.NET test harness application. Select Copy from the context menu.Right-click on the MashupMapModule node of the MapFeature project and choose Paste. Notice that not only is the file copied, but the
Elements.xmlfile now also includes markup for it.Getting the Silverlight application here is a bit more interesting as we want to be sure we have the latest compiled version. Select the MashupMapModule node and locate its Project Output References property in Visual Studio's Properties window. Click the ellipses "..." button.
In the Project Output References dialog, click Add. Select MashupMap from the Project Name property and specify the Deployment Type as ElementFile. This dialog should look like Figure 14-7. Click OK. Notice the Silverlight
.xappackage is added to theElements.xmlfile.

We do want to tweak the XML markup in this module just a bit. If we left it as is, a new folder with the same name of the module would be created in the site and our files would be placed there. Though this is fine and is normally done in production environments, it does make it difficult to confirm that everything worked, since this folder is not part of the SharePoint user interface and can only be seen with a tool such as SharePoint Designer. Instead, let's have our two files placed in the Shared Documents document library of the site. Obviously, this is not a good place if we give users permission to edit this library, but putting our files in a library will let us see that they have been successfully deployed. Listing 14-20 shows the modified elements file for the module.
Example 14-20. The Module's Elements file to Deploy the Files to a Document Library
<Elements xmlns="http://schemas.microsoft.com/sharepoint/">
  <Module Name="MashupMapModule">
  <File Path="MashupMapModule
ationalparks.xml"
        Url="Shared Documents/nationalparks.xml"  />
  <File Path="MashupMapModuleMashupMap.xap"
        Url="Shared Documents/MashupMap.xap" />
</Module>
</Elements>
You can now deploy this feature. Unlike enterprise solutions that are deployed to the server and activated through an interface like Site Features or Site Collection Features, sandboxed solutions are deployed to the site collection's Solutions gallery, which you find in the Site Settings administration area of the top-level site. Confirm that your MapFeature solution made it there and that it was activated. Your screen should look like Figure 14-8.
Note
We have seen environments that generate an error when deploying a sandboxed solution. The error is usually something like: "Error occurred in deployment step 'Activate Features': Cannot start service SPUserCodeV4 on computer 'servername'". This error occurs when the service that hosts sandboxed solutions is not started on the SharePoint Server. You can find more information at http://www.dotnetmafia.com/blogs/dotnettipoftheday/archive/2009/11/30/troubleshooting-sandboxed-solutions-in-sharepoint-2010.aspx.

If the deployment was successful, you should see the MashupMap.xap Silverlight application package and the nationalparks.xml file in the Shared Documents library of the site. Of course, we can't use them yet as we have not created the campgrounds list. That's the next section of the chapter.
Note
Not that this particular sandboxed solution did not contain any server-side code, but if it did, you might find yourself stuck debugging it. This is because the code is not deployed to your normal w3wp.exe process. Instead, you should attach Visual Studio to the SPUCProcess.exe process.
To complete the solution, we are going to create a set of SharePoint customizations that enable any site administrator to access an extended contacts list definition that geocodes the address of each contact. Since this functionality is likely to be used by many different sites for many different reasons, we will deploy it as a SharePoint enterprise solution rather than a sandboxed solution. We will create this functionality by first defining a new content type called GeocodeContact, which is derived from the contact content type with the additional columns of Latitude, Longitude, and GeocodeStatus. We will then create a new list definition based on the content type called GeocodedContacts. Finally, we will create a list event handler for that list definition that incorporates Bing Maps' Geocode web service to convert contact addresses into coordinates.
Add another project to your MashupMap solution. Name the project GeocodeFeature and choose the Empty SharePoint Project template. This time choose the Deploy as a farm solution option and make sure you are targeting the same SharePoint site you've been using thus far.
To create the new content type, Add a New Item to the project. From the SharePoint project item templates, select Content Type and name it GeocodeContact. From the SharePoint Customization Wizard, choose the base content type to extend—in this case, it's the Contact content type. This will add a new Elements.xml file to the project containing the XML markup for the content type. It is here that we will define our new site columns and add them to the content type. Listing 14-21 contains the XML for the three site columns we want to add. This markup should be placed just before the content type.
Example 14-21. Defining New Site Columns for the Content Type
<Field
    ID="{673EC61F-5CC3-41ae-A974-DE547EDB5FC7}"
    SourceID="http://schemas.microsoft.com/sharepoint/v3/fields"
    Name="Latitude"
    StaticName="Latitude"
    Type="Number"
    Group="Geocode Group"
    DisplayName="Latitude">
</Field>
<Field
    ID="{318A3DE7-4783-4a8b-A9D2-FE1A59E6CCBA}"
    SourceID="http://schemas.microsoft.com/sharepoint/v3/fields"
    Name="Longitude"
    StaticName="Longitude"
Type="Number"
Group="Geocode Group"
DisplayName="Longitude">
</Field>
<Field
ID="{E9DBD6FD-A198-4eca-85A6-65825DE56066}"
SourceID="http://schemas.microsoft.com/sharepoint/v3/fields"
Name="GeocodeStatus"
StaticName="GeocodeStatus"
Type="Choice"
FillInChoice="FALSE"
Group="Geocode Group"
DisplayName="GeocodeStatus">
<CHOICES>
<CHOICE>Not Geoencoded</CHOICE>
<CHOICE>Geocoded</CHOICE>
</CHOICES>
<Default>Not Geoencoded</Default>
</Field>Our additional site columns are Latitude, Longitude, and GeocodeStatus. Both Latitude and Longitude are numbers representing Bing Maps coordinates. The GeocodeStatus column is a choice field that will let us know if the conversion of the address by Bing was successful. Remember that we are filtering in the mashup for contacts that have only a value of Geocoded in this column. In case you are wondering, the values of the GUIDs here simply have to be unique. If you are interested in knowing more about the schema used to define these or other site columns, visit http://msdn.microsoft.com/en-us/library/ms196289.aspx.
With the site columns defined, we will now focus on the content type. In our solution, we cleaned up the name a bit but the most important addition is the inclusion of the columns we just defined. Note that you can tell by looking at the ID attribute that this content type is indeed derived from the out-of-the-box contact content type. With SharePoint content types, the IDs just extend down the inheritance tree. The parent content type is obviously a contact since the ID starts with 0x0106. As the code shows in Listing 14-22, each site column needs to be referenced in the content type. Make sure your GUIDs match up.
Example 14-22. The GeocodeContact Content Type
<ContentType ID="0x0106008d5ceaa8cb464dca9ba7a3e4ae9362a2"
             Name="GeocodeContact"
             Group="Custom Content Types"
             Description="My Content Type"
             Inherits="TRUE"
             Version="0">
  <FieldRefs>
     <FieldRef ID="{673EC61F-5CC3-41ae-A974-DE547EDB5FC7}" Name="Latitude" />
     <FieldRef ID="{318A3DE7-4783-4a8b-A9D2-FE1A59E6CCBA}" Name="Longitude" />
     <FieldRef ID="{E9DBD6FD-A198-4eca-85A6-65825DE56066}" Name="GeocodeStatus" />
  </FieldRefs>
</ContentType>
If you are so inclined, you could build and deploy the solution at this point. In the Site Settings area of your test site, you should be able to find the new site columns in their gallery (as shown in Figure 14-9) and the new GeocodeContact content type.

Now go back to your GeocodeFeature project in Visual Studio and Add a New Item. This time, choose the List Definition from Content Type item template. Name the item GeocodedContacts. In the SharePoint Customization Wizard dialog, you will be asked to select the content type from which to base the list definition. As shown in Figure 14-10, choose the GeocodeContact type we defined in the same project. You should see the project name before the name of the content type. Name the list definition GeocodedContacts and uncheck the option to create an instance of this list definition upon activation of the feature.

Completing this wizard adds a new Elements.xml file to the project. This time it includes markup for the list template. As shown in Listing 14-23, we cleaned up a few of the properties to make them easier to read.
Example 14-23. The GeocodedContacts List Definition
<ListTemplate
   Name="GeocodedContacts"
   Type="10000"
   BaseType="0"
   OnQuickLaunch="TRUE"
   SecurityBits="11"
   Sequence="330"
   DisplayName="GeocodedContacts"
   Description="Geocoded Contacts"
   Image="/_layouts/images/itcontct.png"/>
The last SharePoint customization we will include in this project is the list event handler that will respond to new or updated contacts within the list. Any time there is an addition or edit, we will make a call to Bing Maps' web service to convert the address to coordinates. Since we are not requiring any user to get involved and we want this activity to happen right after an item has been added, we chose to implement this customization as an event handler instead of a workflow. Within the same GeocodeFeature project, Add a New Item. Select the Event Receiver template and name the item GeocodeReceiver. In the SharePoint Customization Wizard you will be asked to configure the type of events you want to respond to. For our solution, we will respond to List Item Events and the event source is the GeocodedContacts list definition we created earlier. In terms of events, we want to make sure that our geocoding operation occurs synchronously with the edit or addition of the item so that the coordinates are immediately available for the mashup. Therefore, select both the An item is being added and the An item is being updated events.
With the customization added, use the following steps to add a reference to the Bing Maps' Geocode web service.
Right-click on the GeocodeFeature project and select Add Service Reference.
In the address box, specify the following URL:
http://dev.virtualearth.net/webservices/v1/geocodeservice/geocodeservice.svc?wsdl.Click Go.
In the Namespace textbox, replace the default value with GeocodeService.
Click OK.
Now switch over to the class file that was added for the event receiver. This file should be named GeocodeReceiver.cs. Add the using statements shown in Listing 14-24 to the top of the file so that you can use WCF classes and the Geocode web service without fully qualifying their names.
Example 14-24. Using Statements for the Event Receiver
using GeocodeFeature.GeocodeService;
using System.ServiceModel;
This class file should already be stubbed out with methods for the ItemAdding and ItemUpdating events or the contact item. The code in Listing 14-25 shows how we injected our own processing before the addition or edit is committed to the SharePoint server.
Example 14-25. Modifying an Item in the Event Receiver
public override void ItemAdding(SPItemEventProperties properties)
{
  GeoCodeItem(properties);
  base.ItemAdding(properties);
}
public override void ItemUpdating(SPItemEventProperties properties)
{
  GeoCodeItem(properties);
  base.ItemUpdating(properties);
}
All of the work of communicating with Bing Maps happens in the GeoCodeItem method. The beginning of this method is shown in Listing 14-26. Notice that the request to the web service includes your application key you used earlier in the mashup. The heart of the request is a GeocodeRequest object that we populate with the address of the contact item. We got the names of these fields by looking at the fields of the contact content type. The last portion of Listing 14-26 simply specifies that we are interested only in high confidence results from Bing.
Example 14-26. Setting up the Geocode Request
private void GeoCodeItem(SPItemEventProperties properties)
{
   string bingMapsKey = "YOUR KEY HERE";
   GeocodeRequest geocodeRequest = new GeocodeRequest();
  // Set the credentials using a valid Bing Maps key
  geocodeRequest.Credentials = new GeocodeService.Credentials();
  geocodeRequest.Credentials.ApplicationId = bingMapsKey;
  // Set the full address query
  string addressTemplate = "{0},{1},{2},{3}";
  geocodeRequest.Query = string.Format(addressTemplate,
        properties.AfterProperties["WorkAddress"].ToString(),
        properties.AfterProperties["WorkCity"].ToString(),
        properties.AfterProperties["WorkState"].ToString(),
        properties.AfterProperties["WorkZip"].ToString());
  // Set the options to only return high confidence results
  ConfidenceFilter[] filters = new ConfidenceFilter[1];
  filters[0] = new ConfidenceFilter();
filters[0].MinimumConfidence = GeocodeService.Confidence.High; GeocodeOptions geocodeOptions = new GeocodeOptions(); geocodeOptions.Filters = filters; geocodeRequest.Options = geocodeOptions;
Next, the method continues by executing the request. Since our event handler will be deployed to the global assembly cache and we don't want to modify SharePoint's web.config file, we will setup the WCF binding and endpoint explicitly instead of relying on a configuration file. This is the code that is shown in Listing 14-27.
Example 14-27. Configuring the Proxy and Executing the Geocode Request
// Make the geocode request
BasicHttpBinding binding1 = new BasicHttpBinding();
EndpointAddress addr = new EndpointAddress(
   "http://dev.virtualearth.net/webservices/v1/geocodeservice/GeocodeService.svc");
GeocodeServiceClient geocodeService = new GeocodeServiceClient(binding1, addr);
GeocodeResponse geocodeResponse = geocodeService.Geocode(geocodeRequest);
The remainder of the GeoCodeItem method checks to see if there was a response. In this case, we are expecting a single set of coordinates. The code in Listing 14-28 gets these return values and modifies the list item to have these values before it is committed to the server.
Example 14-28. Retrieving the Result of the Geocode Request
// The result is a GeocodeResponse object
if (geocodeResponse.Results.Length > 0)
{
  properties.AfterProperties["Latitude"] =
    geocodeResponse.Results[0].Locations[0].Latitude;
  properties.AfterProperties["Longitude"] =
    geocodeResponse.Results[0].Locations[0].Longitude;
  properties.AfterProperties["GeocodeStatus"] = "Geocoded";
}
}
You are now finished with the GeocodeFeature project. Build and deploy the SharePoint customizations to the site. We will now walk you through just a few final items to make the mashup complete.
With both your SharePoint features deployed, there are only a few items to bring the entire solution to life. Using the same SharePoint site, create an instance of the GeocodedContacts list definition named Campgrounds. Go ahead and populate it with a few items specifying the name of a campground in the company field and its full address. You will have to specify a first and last name of a contact. If you want some data to use as a source, we found a nice collection at the organization known as 1000 trails: http://1000trails.com/index.asp.
One other small change we made is that we didn't think it was appropriate to display the fields for Latitude, Longitude, and GeocodeStatus to the user on the item edit form as these are really there only for our event code. Fortunately, in SharePoint 2010, a list's forms can be quickly modified using InfoPath. Use the following steps to change the campground's list form.
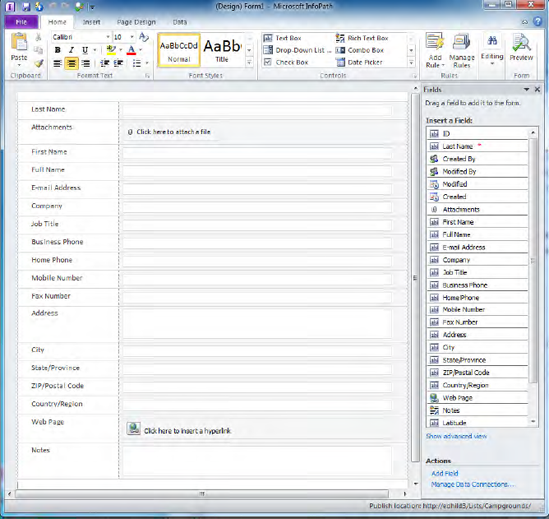
With the Campgrounds list open, click List on the ribbon and choose the Customize Form button in the Customize List group.
InfoPath will load the list's form into the form designer with the list of list columns displayed off to the right. Delete the three rows from the design surface of the form to hide our Latitude, Longitude, and GeocodeStatus fields from the user. The form should look like Figure 14-11.
In the very top-left corner of InfoPath there is a Quick Publish button immediately to the right of the save option. Click it to commit the changed form back to the list. Now when you edit an item, our three fields won't confuse the user into thinking they are responsible for those values.
Lastly, you will need a place to display the mashup. On any page of your SharePoint site, or a new page if you prefer, add the Silverlight Web Part that is in the Media and Content category. When you add the web part, you are asked for the URL of the Silverlight application package. You can also find this setting by editing the web part to pull up its properties and click the Configure button. Since our module deployed it to the Shared Documents library, this value should be /sites/mashup/Shared Documents/MashupMap.xap. You're done! If you don't see the whole Silverlight control, just adjust the size of the web part through its properties to match that of the XAML markup (Height:400, Width:600). Test everything to make sure you can load all three data sources onto the mashup.
This chapter incorporated several key techniques that are worth highlighting as they could easily be reused in other projects.
- Bing Maps Silverlight Control:
The solution detailed how to layer shapes, icons, and pins into different layers of an interactive map using the Bing Maps Silverlight Control SDK.
- Bing Maps Web Services:
The solution used the Geocode web service provided by Bing Maps to convert an address into coordinates. There are several other Bing Maps Web Services and we included a link in the Further Reading section of the chapter.
- Sandboxed Solutions:
The mashup itself was really a site-specific solution. We therefore deployed it as a sandboxed solution so it could be managed in a restricted area without the risk of causing great harm to the SharePoint environment.
- Creating a Content Type, List Definition, and Event Receiver in a Feature:
As a developer, you will often want to extend an out-of-the-box SharePoint content type, create a list based on your changes, and attach an event receiver. This solution included these three steps in concert, all defined within a single feature.
- Modifying a List's Form with InfoPath:
When you are not quite happy with the out-of-the-box list form and want to give your users a better experience, simply customize the form using InfoPath.
- Requesting Data from Silverlight:
In this solution, we showed you how from a Silverlight application living in SharePoint you can retrieve data from a variety of sources. We showed you how to load data from a RSS feed, consume a local KML file, and how to query SharePoint lists using SharePoint's client-side libraries.
While coding this example, we thought of several variations to the solution that we didn't incorporate. Mostly, these were not included because they distracted from the overall objective of the solution. We call them out now as extension points since they may be applicable to a specific project you are working on.
- Pull in data from an Excel Services spreadsheet:
As shown in Chapters 5 and 10, Excel Services now provides a REST API for retrieving elements of the spreadsheet. These elements could be charts or even named ranges. You could use them as yet another data source, either pulling in a chart as an overlay (inserting it as an image similarly to the park icon) or retrieving a table of data for a new map layer.
- Store your Bing Maps Key separately, not as a literal string in code:
In this chapter the Bing Maps key was hard-coded into the solution, which is definitely not a best practice. You could place this value in a resource file for both the Silverlight solution and the feature. Another possibility would be to store it in the
web.configfile. Chapter 11 shows an example of how to have your feature write configuration modifications to theweb.configfile automatically.- Draw polygons on the map:
We had thought of drawing large polygons on the map as a layer to signify regions of responsibility, something similar to sales districts: Northeast, Southeast, Heartland, Northwest, Southwest. However, the bottom line is that we could only go so far with the "context" for this chapter. We recommend looking at the Interactive SDK and spending some time with the additional things you can do with the map.
The following links are to resources we think a reader interested in the material presented in this chapter would find useful:
Develop a Sandboxed Silverlight 3.0 Web Part for SharePoint 2010
http://sptechpoint.wordpress.com/2010/01/12/develop-a-sandboxed-silverlight-3-0-web-part-for-sharepoint-2010/Using Bing Maps in SharePoint
http://cm-bloggers.blogspot.com/2009/06/using-microsoft-bing-maps-in-sharepoint.htmlSharePoint 2010, the Client Object Models and Bing Maps
http://www.tonstegeman.com/Blog/Lists/Posts/Post.aspx?List=70640fe5%2D28d9%2D464f%2Db1c9%2D91e07c8f7e47&ID=123Deep Dive on Bing Maps Silverlight Control
http://microsoftpdc.com/Sessions/CL36Reading and Displaying RSS Feed in a Silverlight Datagrid
http://www.dotnetcurry.com/ShowArticle.aspx?ID=252&AspxAutoDetectCookieSupport=1Data Retrieval Overview
http://msdn.microsoft.com/en-us/library/ee539350(office.14).aspxHow To: Retrieve List Items
http://msdn.microsoft.com/en-us/library/ee534956(office.14).aspxWorking with BeforeProperties and AfterProperties on SPItemEventReceiver
http://www.synergyonline.com/blog/blog-moss/Lists/Posts/Post.aspx?ID=25Bing Maps Web Services SDK
http://msdn.microsoft.com/en-us/library/cc980922.aspxSyndication Feed Class
http://msdn.microsoft.com/en-us/library/system.servicemodel.syndication.syndicationfeed.aspxSandboxed Solutions
http://msdn.microsoft.com/en-us/magazine/ee335711.aspx