
Chapter 11
Testing iOS WebApps
Be a yardstick of quality. Some people aren't used to an environment where excellence is expected.
—Steve Jobs
After seeing how to optimize our web application in the last chapter, we now approach the test phase. After an introduction about lifecycles and agile testing approaches, we will see how to organize a test, first creating a use-case and then the assets needed for testing it.
We will perform a test and then learn how to evaluate it using specific kinds of feedback, such as design or emotional feedback, and variables, such as the number of used touches, the number of mistakes, and the estimated time of arrival.
Web Development Lifecycles
In application development, we can apply two major types of lifecycles: the waterfall lifecycle and the iterative-incremental lifecycle. The waterfall lifecycle is defined as a sequential development model with clearly defined deliverables for every phase. In the waterfall lifecycle, there is minimal feedback from one phase to another.

Figure 11–1. The waterfall lifecycle (left) and the iterative-incremental lifecycle (right).
The iterative-incremental lifecycle is defined through cycles (iterative) developed in a smaller portion of time (incremental). Compared to a waterfall lifecycle, an iterative-incremental lifecycle enables more flexibility in accommodating new requirements of change. Figure 11–1 presents a graphical comparison between a waterfall and an iterative-incremental lifecycle. In the next section, we will see how to approach the test phase at the end of the implementation phase.
Web Application Testing
In our simplified workflow, when we exit the development phase, we enter directly into the test phase. Particularly in iterative lifecycles, different levels of testing should occur at all stages of the process. As we now understand, different project flows can be implemented with different lifecycles according to project context and requirements.
As we will also learn, every project phase is overlapped by at least one other phase; this is also true for the test phase.
In our workflow, as shown in Figure 11–2, the test phase is performed after the implementation phase and before the release phase. It is used to conduct tests on performance, accessibility, usability, and more generally, on user experience.
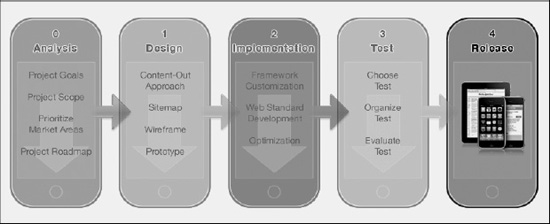
Figure 11–2. The project flow: simplified version with the test phase only at the end of the flow.
The testing approach depends on the nature of the web site or web application. Generally, in accordance with the specific moment in the project flow, we can choose different types of tests. In the next section, we will see agile approaches to tests, which are more comfortable for single developers or small development groups.
Agile Tests
In the first step of our project flow, we work with wireframes to implement an early version of our contents. From the wireframes, the next step is to create paper prototypes to get a better idea about both the content and layout of our future web pages.
The paper prototype test is the first level of useful testing to determine whether our design is correct in terms of user experience. This type of test is inexpensive because it can be prepared and performed by a single designer without any specific tools. Paper prototype tests can identify both user interface design and content-related problems.
A paper prototype test makes it easy to determine whether the user struggles with our interface by looking for a specific button or trying to orient him- or herself during a browsing session. Paper prototype tests can also show whether our content is in the right place and provides the right level of information to the user.
Paper prototype tests are performed in the design phase before moving on to the development phase (Figure 11–3). These tests are usually performed by the designer and are based on the same sketch used to define the web site or web application design.
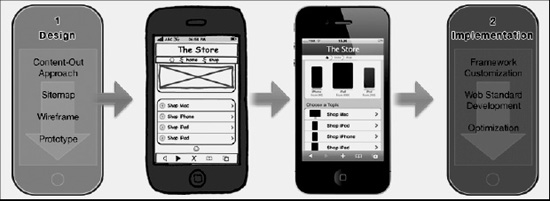
Figure 11–3. The paper test performed between the design and the implementation phases of the flow.
The second level of agile tests is the electronic prototype tests. These tests are performed by the designers as a final step in the design phase. Because each step often slightly overlaps the next, this type of test can be prepared by the designers and performed by the developers. Electronic prototypes can also be prepared and used by both the designer and the developer, allowing the designer introduce the work to the developer who will use the electronic prototypes as the starting point for his/her job.
If the electronic prototype runs on a mobile device, it offers virtually the same experience to the user and is reliable. It can also run on a desktop machine and provide a good level of feedback. The difference between a real mobile scenario and any other electronic prototype is the environment.

Figure 11–4. A real environment can dramatically change the user experience (Image Miss HG).
The environment can create significant differences in laboratory tests aiming to evaluate a real mobile experience (Figure 11–4). The best way to approach the problem is to perform preliminary paper prototype tests on the design, perform electronic prototype tests on the functions and services, and then develop an alpha version of the web site or web application to test in a real environment.
These types of tests are virtually free because paper and electronic prototypes have already been produced as a regular step in the design phase of the project workflow.
Heat Map Tests
Another type of test that is easy and inexpensive to set up and perform is the heat map pseudo test. We use the prefix “pseudo” because the real heat map test requires tools for eye-tracking that most development teams don't have (Figure 11–5).
As a workaround for this lack of technology, we can use one of the many online services (for example, Feng-GUI) offered by companies that use heuristic algorithms as a replacement for real eye-tracking. These heuristic algorithms are usually accurate and, along with their usability and accessibility, provide good feedback.
Typically, the process for using an online heat map service is standard and includes the following steps:
- Register an account for the heat map service.
- Insert the absolute path or upload a print-screen of the web page.
- Download the heat map in an image format.
Some services are similar to Google analytics and offer a script to insert into web pages. While logged into our account, we can check the web page statistics and see the heat maps. This type of service should be considered accurate because we can analyze the web page over time with real users.
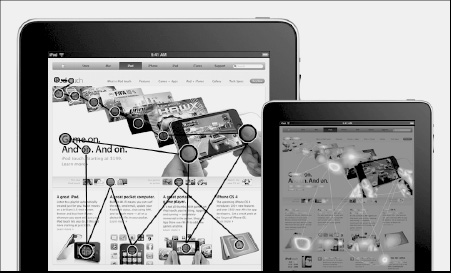
Figure 11–5. The eye-tracking test (left) and the corresponding heat map (right).
We introduced the heat maps technique in Chapter 4 to analyze reading patterns to show the basics of a good design and what can negatively influence the user experience. The point is that heat maps can reveal a design mistake and give early feedback during the design phase. By watching a heat map, we can determine if the user's attention might be hijacked by some unwanted design element. By using a heat map, we can test our design element hierarchy and check whether the reading pattern correctly follows the content.
We should also note that a heat map test is less informative in a small display context such as the iPhone, compared to the 9.7-inch context of an iPad. Despite this shortcoming, a heat map test still offers important information about our design to help prevent design-error propagation in the project flow.
Organizing a Test
Every detail of every test must be planned and organized in order to produce reliable feedback. The agile approach we chose is based on artifact recycling, allowing us to work on ideas and assets that we used for previous workflow phases. The artifact recycling approach contributes to keeping the preparation phase as lean as possible. In the following sections, we will see how to plan and create use-cases and how to perform a test.
Creating Use-Cases
The main thing to remember is that paper prototypes (shown in Figure 11–6) are design-oriented and work best in design tests, which means that they provide more reliable feedback on design details. Electronic prototypes can also give feedback on design details, but because they implement at specific levels of some or all of the functions and services offered by the web site or application, they are mostly used to collect feedback about functions and services.
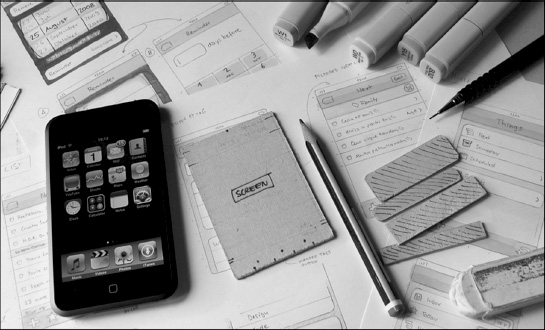
Figure 11–6. Developing paper views for use-cases (Image Resenfeld Media).
The first step in the preparation phase is to create a use-case. When working on a web site or application, we can picture a browsing session with a specific user action path. Perhaps we want to test whether the contact page is easily reachable or whether a specific service is useful. Imagination and experience are your best friends in this phase.
Typically, textual use-cases are used in combination with use-case diagrams to better understand the project requirements in the analysis phase. In the test phase, this combination still offers the best results because the diagram can be seen as a graphic summary of the use-case, providing an idea of “who does what” and “who interacts with what,” while the description provides a better understanding of the individual steps involved in the interaction between the actor (user) and the system (user interface, server, and so on).
Creating a Textual Use-Case
Now we are facing a fork in the road because designers and developers typically possess different background knowledge and use different tools. Not all designers know UML, whereas almost all developers know this useful modeling language; it is used in almost every object-oriented project.
For those who don't know UML, the textual use-case approach offers everything one needs to present and organize a test; familiarity with the tools offered by UML will definitely help in both the analysis and test phases of the project flow.
UML is beyond the scope of this book. However, in this chapter, we will present two ways to represent a use-case: textually and visually. In this section, we will present the textual way to represent a UML use-case, while in the next section we will do so visually, using diagrams.
NOTE: UML stands for Unified Modeling Language and is a standardized, general-purpose modeling language used in software engineering. UML includes various types of visual models, but for our purposes, we present only two of them:
- Textual use-case
- Use-case diagram
A simple book that can introduce you in simple terms to all the tools offered by the Unified Modeling Language is UML Distilled, by Mike Fowler.
For more information, visit http://martinfowler.com/books.html.
When working with a team, we usually represent a use-case using both textual and graphic tools. If you work as a single designer or developer, you can choose which tool you prefer, assuming that you have every aspect and detail of your project clearly in mind.
The easiest and most intuitive way to create a use-case is the textual way. The first step is to write the header for your use-case, choosing the title that corresponds to the user's task, the level of detail, the actor, and the device used, which identifies the context. “The Main Successful Scenario” is the title of our use-case. The second step is to define the scenario by writing the body of our use-case in a numbered sequence of steps, where the actor (user) performs a number of actions to achieve his or her goals. Every step represents an interaction between the system (user interface, server, and so on) and the actor (user). The following is an example of a textual use-case taken from our Apple Store use-case.
Call the Apple Store Support
Level: Sea level (a.k.a. User goal level)
Actor: User
Device: iPhone
- The user browses the menu by selecting the Support link.
- The user browses the menu by selecting the Contact Us link.
- The user browses the menu by selecting the “1-800-275-2273” link.
- The device asks for confirmation of the call to the number “1-800-275-2273.”
- The user makes a call to Support.
In a use-case, there are five different levels of detail, shown from top to bottom in the following list:
- Cloud level (Summary goal)
- Kite level (Summary goal)
- Sea level (User goal level)
- Fish level (Sub-functional goal)
- Clam level (Sub-functional goal)
We can work on a different level of detail by setting a different level, as shown in the following example:
Call Support
Level: Kite level
Actor: User
Device: iPhone
- The user goes to the Contact page.
- The user clicks the Support number.
- The device asks for confirmation.
- The user calls Support.
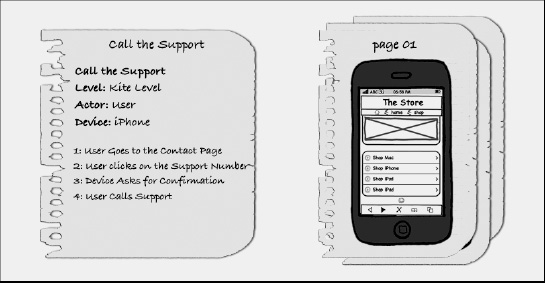
Figure 11–7. The use-case: the textual use-case and its implementation on a paper prototype.
In the first phase of our project flow, called analysis, the textual use-case was employed to identify the requirements of our project, but it can now be re-used in the test phase to compare the expected behavior from the textual use-case with the real user's behavior from the prototype test. Each entry in our textual use-case should match the actions performed by the user to complete the task. Figure 11–7 illustrates the use-case called “Call the Support.”
Creating a Use-Case Diagram
A use-case diagram is a visual representation of the system boundary and its interactions with the external world. Those who interact with the system from the external world are the actors. An actor can be either a user or another system.
The system is represented by a square or rectangle that shows the system boundaries. Every use-case is represented as an oval that encloses the name of the use-case. The actor is represented by a stylized human, with an identity below it.
The use-case diagram uses a factorization approach, which means that a use-case can include another use-case, as shown in Figure 11–8. When a use-case includes another use-case, an arrow points to it, showing the word <<include>>.
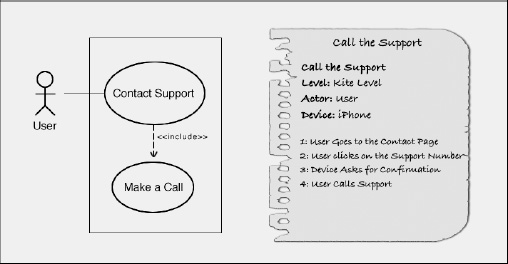
Figure 11–8. Use-case: comparison between the diagram and the textual description.
In our example, the Contact Support use-case includes another use-case called “Make a Call.” If we refer to the Sea Level Detail of the textual description, the Contact Support use-case represents points 1 and 2, whereas the Make a Call use-case represents points 3, 4, and 5. In the Kite Level Detail, only point 1 belongs to the Contact Support use-case whereas points 2, 3, and 4 belong to the Make a Call use-case.
Use-case diagrams play a functional role in the test phase through organization and offering a visual reference to each test.
Creating the Assets
When the textual use-case and the use-case diagram are ready, we can begin to work on the test assets. We need to prepare two different types of assets: one type for the paper prototype and one type for the electronic prototype.
Paper Prototype
Paper prototypes are directly inspired by, or even recycled from, the paper prototype used in the design phase. Basically, we need to design a paper prototype for each step of our use-case, which means that paper prototypes and numbered points from the textual description have a one-to-one relationship, as illustrated in Figure 11–9.
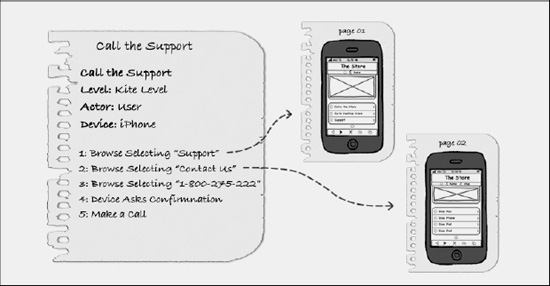
Figure 11–9. One-to-one relationship between two textual use-case entries and two paper prototypes.
Each paper prototype represents a view of a specific moment in the test in the same way a frame is a view of a specific moment in a movie clip. Paper prototypes always use some colors for reducing the gap in the brain between the perception of a simple piece of paper and a real image of a fully working device. A good approach is to use the Pantone Color Chart if you use a graphic program for choosing colors and design of your papers, or a Pantone pen if you use a handmade approach.
Electronic Prototype
Electronic prototypes are designed and developed as the last step before jumping into the implementation phase. As long as you haven't skipped this phase you should have an electronic prototype ready for the test phase.
Generally, an electronic prototype doesn't offer 100% of the functionality that the final release provides; the goal of this type of test is to perform checks in order to prevent errors and avoid their propagation in the implementation phase.
Nevertheless, in a web context, the electronic prototype is based on the same technology as the final release (HTML5, CSS3, and JavaScript), so this type of prototype is often very close to the final product that will be released (and is shown in Figure 11–10).

Figure 11–10. The textual use-case (left) and the WebApp views (right).
In Chapter 2, we suggested a framework plug-in to easily develop an electronic prototype of our project. Whatever approach we choose, the concept is always the same: create an HTML5, CSS3, and JavaScript model in order to be able to test a specific function or a specific service. According to the grade of functions and services offered by the electronic prototype, we can perform different grades of tests and have different grades of feedback.
Performing a Test
Once the assets are made, and assuming that the user is ready, we can start to perform the prototype tests. Any room with a table and two chairs is a perfect location for a paper prototype test.
Paper and electronic tests look different, the assets are different, the role of the tester in the test is different, and even the grade of feedback is different, yet the idea behind both types of tests is the same. Both could be categorized as task-oriented tests. We will see how the same idea drives these tests in the following sections.
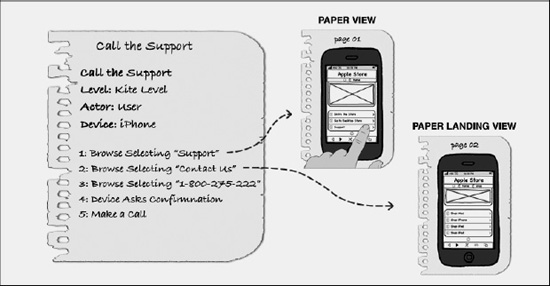
Figure 11–11. Paper prototype test: the paper view and the paper landing view relationship.
In these tests, the paper view is a physical paper page (an asset) while the paper landing view (another asset) is a link destination page. “Landing” is a relative prefix to increase the level of communication and better understand the context and relationship between two pages, which is useful when we need to analyze and discuss the results of the test.
Paper Prototype
The use-case that we need to perform with the user is represented by a phrase or an order that starts the use-case, and mentally leads the user through his actions. Referring to our Call Support use-case, a good phrase or order to start the test is Contact Support by Phone.
Call Support
Level: Sea level (a.k.a. User goal level)
Actor: User
Device: iPhone
Order: Contact the Support by Phone (for the user)
- The user browses the menu by selecting the Support link.
- The user browses the menu by selecting the Contact Us link.
- The user browses the menu by selecting the “1-800-275-2273” link.
- The device asks to confirm the call to the “1-800-275-2273” number.
- The user makes a call to Support.
Once we introduce the order to the user, we show him the first and initial paper view (Figure 11–11), represented by “Page 01” in Figure 11–9 as we saw earlier. We ask the user to voice his thoughts during his experience and for every action he performs. The tester records all comments describing the user experience.

Figure 11–12. Paper prototype test: the textual description used to drive the paper test.
The user interacts with the paper prototype while the role of the tester is to replace the paper view with one relative to the user's action. In our example, if the user touches the Support link, the tester replaces the paper represented by Page 01 with the new landing paper view represented by Page 02, as in Figure 11–13.

Figure 11–13. Paper prototype test: tester changes the paper views (Image Samuel Mann).
In the optimum case, the prototype test will finish when the user is able to achieve his task, and in the worst case, when he quits. In any case, the tester must record the user's experience, describing how the user achieved a task or why he failed.
Electronic Prototype
After learning as much as possible from the paper prototype tests, we are ready to perform the electronic variation called the electronic prototype test (see Figure 11–14). The test procedure remains the same; what changes is the level of user experience and the possibility for the tester to test functions and services that had not yet been implemented in the paper prototype test phase.
The electronic test can be performed using a desktop computer, which is the case if you use the Fireworks PlugIn. You will generally want to use a browser with a mobile user agent as a test environment.
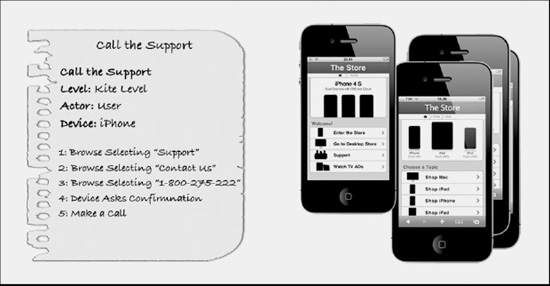
Figure 11–14. Electronic prototype test: textual description used for driving the electronic test.
Of course, because a web site or application typically shares the same technology used to develop electronic prototypes, a better version of this test could run directly inside the mobile device. In this case, we can have an electronic prototype that offers different levels of functionality or service from ~0% to ~100%.
An electronic prototype that is used only to test the design and level of feedback but provides almost none of the functions and services is comparable to a paper prototype. A prototype that provides most of the available functions and services produces a level of feedback comparable to the release version.
In both desktop and mobile versions of the electronic prototype test, the tester plays the same role that he played in the paper prototype test, except that he does not manually change the views during the test. The tester assigns the user certain tasks to accomplish while recording notes about the user's experience.
Evaluating a Test
Once all the prototype tests are complete, we need to work on our gathered data and feedback to evaluate the test and the project. It is important to remember that a test's feedback is only as reliable as the test model. This means that your prototype must simulate or represent the final release as much as possible.
The problem is that, in this context, where a short-circuit is obvious, we need to use prototype assets that look like the final release in order to get reliable feedback. However, we did perform prototype tests to understand how to design the final release and/or to verify that the actual design is correct before implementing the final release (see Figure 11–15). The bottom line is that a test is just a test, and reliability is based on tests performed on incomplete prototypes.
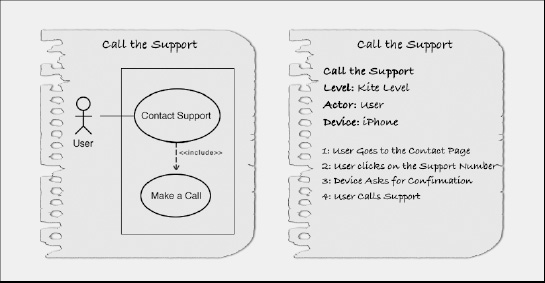
Figure 11–15. Paper prototype test: two types of assets used by the tester to perform and evaluate the test.
This fact is more apparent in a paper prototype test where paper seldom represents a real user interface and where poor color or details interact in different ways with the cognitive perception that is the foundation of every user's experience. These are things related to the visceral level of design—one of the three levels of design (along with behavioral and reflective) that Donald Norman explains in Emotional Design. Failure to create a link with the visceral level of design results in failure to anticipate the real user experience because it dismisses the level of effect, or emotional response, that a prototype can elicit in a user in a particular context.
NOTE: Donald Norman is an academic in the field of cognitive science, design, and usability engineering and a co-founder and consultant with the Nielsen Norman Group.
For more information, visit http://www.jnd.org/books.html.
In contrast, the electronic prototype shares the same technology with the final release, so the test and the feedback will be more accurate. The percentage of accuracy can change according to the number of functions and services implemented in the prototype.
Variables and Feedback to Evaluate
Generally speaking, a test can have a structure from very simple to very complex. Complex tests return rich and accurate feedback but also require resources and effort that are often beyond the scope of a small development team, let alone a single designer or developer.
Continuing with the agile approach, we use several variables and types of feedback in order to get a clear idea of what level of experience our design, functions, and services can trigger in the user's mind.
Number of Touches
The first variable to manage is the number of touches required by a user to accomplish a task. The number of touches is defined by the shortest path tree (SPT) from the starting point to the ending point of the content tree. The beginning point can be our home page or another page somewhere in the content tree for performing a more specific task. Figure 11–16 shows the steps necessary for the Call Support use-case. The path looks simple, but the simplified content tree represented by Figure 11–16 doesn't represent the internal links between web pages.
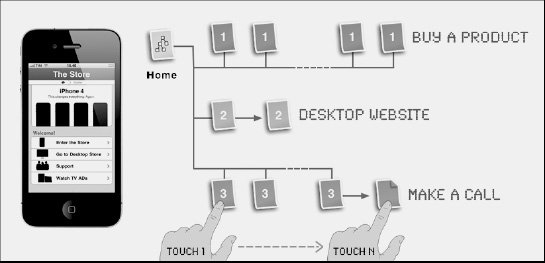
Figure 11–16. The number of touches used to accomplish the Call the Support task.
The SPT algorithm is used in other and more complex areas, but in our use-case the same concept is easily implemented by counting on the site map or content tree the number of touches needed to accomplish the task. The number of touches is reported by the tester in the use-case paper description as a reference.
Number of Mistakes
The second variable is the number of mistakes that the user makes while trying to accomplish his or her task. There are two categories of mistakes:
- Touch error. When the user touches the wrong link (Figure 11–17 left).
- Touch misidentification. When the user touches a non-touchable area (Figure 11–17 right).
When a user touches a wrong link, this means that he or she touched a link that brought him or her away from the ending point and that the link doesn't belong to the shortest path of the task. This type or mistake can either be the fault of the user or the design.
The tester needs to determine whether the design is correct and the user made a mistake triggered by the environment or some other cause, or whether the wrong design triggered the user's mistake.

Figure 11–17. The types of user (touch) mistakes: wrong link (left) and non-touchable area (right).
It is different when the user touches a non-touchable area thinking that he/she touched a link. In 99% of these cases, the mistake was triggered by a design error. Design errors could mean a context with a lack of user orientation, or just a wrong user interface design. In any case, this type of mistake calls our attention to some detail that we apparently overlooked in the design phase.
Estimated Time of Arrival
The third variable is the estimated time of arrival (ETA) (Figure 11–18), the time that the user needs in order to accomplish the task. The ETA is calculated against the tester, who knows the content tree and is able to pass the task.
Usually, the shortest path time is used as the lower-bound for the test, as taken by the experienced tester. The lower-bound defines the optimum, a standard that in practice is almost never matched by the user during a test. The closer the user is to this estimated time, the better he or she can accomplish the task and (presumably) the higher the level of user experience.
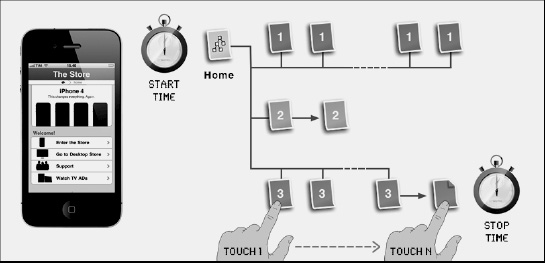
Figure 11–18. Call Support use-case: calculating the estimated time of arrival (ETA).
The ETA is reported in the use-case paper description as a reference for the tester.
Collecting Feedback
In addition to these three variables, there are three types of feedback that the tester can collect from the user's comments.
Design Feedback
The first type of feedback is design feedback about the quality of the user interface. In the design part of this book, we learned that, in the touch-oriented world, every part of the design is an interface that collects feedback about every design element. Figure 11–19 illustrates two different emotional feedbacks for the same user interface.
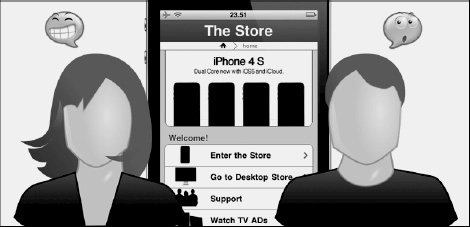
Figure 11–19. Call Support use-case: two different design feedbacks for the same interface.
Although this type of feedback can be useful in the paper prototype test to indicate the correctness of our design, it has more weight if gathered during the electronic prototype test because the implemented interface is almost the same as the release version and the information contains more useful details.
Expectation Feedback
The second type of feedback is expectation feedback about the design and service expectations of the user. This type of feedback is gathered every time the user lands on a web page that doesn't match his expectation or touches a link thinking that it represents a different service from the one implemented. Figure 11–20 shows what can happen when a user has a different mental representation of the landing page behind a link.
Figure 11–20. Buy an iPhone Dock use-case: the expectation doesn't match the design in the landing page.
The weight of this type of feedback is almost the same on both paper and electronic prototype tests. These tests are useful for understanding how semantically our design, functions, and services are represented in the user's mind and whether this meaning corresponds to our original plans.
Emotional Feedback
The last type of feedback is emotional feedback about the inner feelings of the user during the test session. This type of feedback has more weight for the electronic prototype test session and often isn't even gathered in the paper prototype test session.
Emotional feedback is triggered by two types of stimuli. One is absolute and triggered by colors, design elements, and everything involved in the identity of the project. In Figure 11–21, this stimulus is represented by the iPhone.
The other type of feedback is relative and involves the environment and the changes that this type of stimulus triggers in the user's inner world, as shown in Figure 11–21. The word “environment” refers to everything belonging to the physical world (except the mobile device) outside of the human user.
Figure 11–21. Emotional feedback is triggered by two types of stimuli: absolute and relative.
This type of feedback can give important information about the user's inner world during the test. This type of feeling is important as part of the global communication that comes from our web site or application. In order to test a relative stimulus, such as the environment, we need to implement an electronic prototype directly on the mobile device and go outside, allowing the user interface to join the real world.
Evaluation Techniques
Evaluating a test can be difficult, especially when working with a large amount of data and a wide-ranging project. We can apply statistical methods from a discipline called descriptive statistics in order to obtain reliable values. After performing a prototype test, we no longer need this type of approach, and an agile method can still provide reliable values without involving heavy calculations and complex mathematical skills.
Test Variable Evaluation
The simpler way to evaluate the variables involved in the prototype test is to count the number of occurrences of each variable and compare it to the number of occurrences in the actual test. In UML, the entity used to estimate (or represent) the expected value from a use-case test is called Oracle. In our test, the Oracle is represented by a set of variable values represented by natural numbers.
In our prototype tests, there are three natural numbers related to three types of variables: one for the number of touches, one for the number of mistakes, and one for the time of arrival.
The simplest method is to set a lower-bound for each variable that has to be matched in the test. Figure 11–22 shows a textual representation of the variable values in the use-case textual description. In our example, we set these values equal to the passed test (the user is four touches away from the Call the Support link), which means that the test will be either passed or failed.
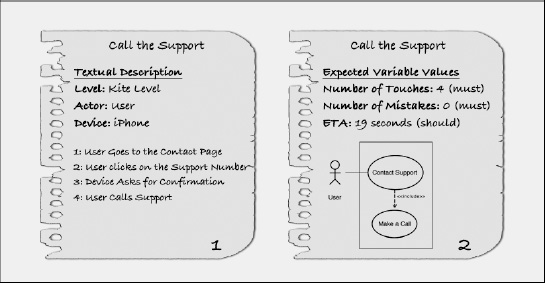
Figure 11–22. A textual use-case with notes about the variable values.
Once we set the minimum value for each variable, we need to set the variable's modal operator for the test. Variable modal operators set a verb for each variable showing how the expectation value should match. Generally, only a few modal operators are used. We use two for our purpose: “must” and “should.”
The modal operator shows whether a variable's value must be matched or just should be matched in order to pass the test. We present only a simple example of a prototype test: for more complex projects and tests, it is a good idea to add a certain level of matching for each variable.
Our use-case test can be passed by performing only four touches, with no touch mistakes. The “should” attribute of the ETA variable says that the value of this variable is not a “must” for passing the test. In some cases, a more reliable result can be achieved by including some sub-set of passed cases, setting a percentage to match for each variable.
Test Feedback Evaluation
When working with variables, the most important thing is to know how to set them. After this difficult part is done, all that is left is to compare the data. This approach is more technical but doesn't require a great deal of skill or experience from the tester.
A completely different scenario is the feedback evaluation. This is because we will not have a number with which to compare and our experience will play a fundamental role. For this reason, we can introduce any experimental method or technique to evaluate the feedbacks, as long as we specify the procedure.
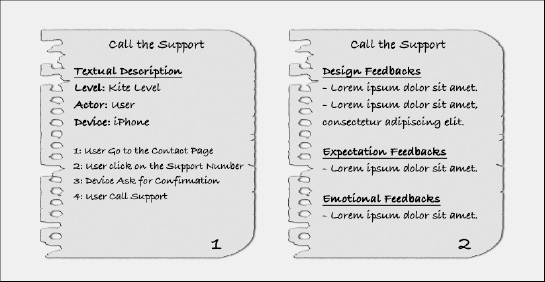
Figure 11–23. The textual use-case with notes about the user feedbacks
Collect the three types of feedback. Figure 11–23 shows an example of how we can note the user feedback. When everything is in place, we need to remember that every feedback has weight. The weight of a feedback is its inner value in relationship to the context. A user might report confusion with our interface, but the level of stress in a specific context might be the result of decreased cognitive resources, or these patterns might have been conditioned by another application or some ambient variables. For this reason, the tester's experience and practice are needed to gather reliable information from the user's feedback.
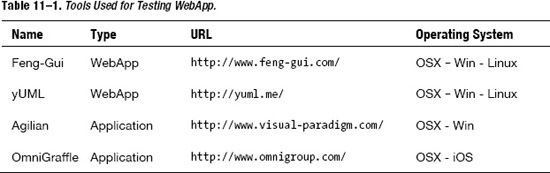
Resources on Testing
Table 11–1 provides some of the tools used in this chapter for testing our project.
Summary
In this chapter, we saw the importance of planning a testing phase and how this phase can be performed along the entire project flow—not just at the end of the process.
We began by showing how heat maps are a reliable source of feedback for the designer and developer. We then introduced paper and electronic prototypes. We saw how these two types of tests help the tester gather different types of feedback.
We discussed how to organize a test by applying artifact recycling from the previous steps of the process flow. We saw how to create a test and a use-case using different levels of detail. We used UML notations, introducing the use-case textual description and the use-case diagram.
We then saw how to perform a test with paper and electronic prototypes. We saw how to create and recycle the assets, and that the electronic prototype was performed in the early phase of design while the electronic prototype was performed at the end of the design phase before passing on to the implementation phase.
We also saw that the electronic prototype, because it shares the same technology with the web site or application, can be used to test the project outside the office in a real-world scenario.
Finally, we saw how to evaluate a test and the variables and types of feedback involved in this process. We presented three types of variables (number of touches, number of mistakes, and estimated time of arrival) and three types of feedback (design, expectation, and emotional feedback) used in the evaluation.