
Chapter 9
BI Semantic Models
What's in this chapter?
Introduction to data modeling
The BI Semantic Model
The conceptual architecture of the BI Semantic Model
Options for building models
Building reports requires some level of understanding the underlying data. This is often expressed as metadata and called a model. The model can be as simple as a flat list of fields returned by a query used in a report, or sophisticated enough to express complex data relationships and calculations.
In this chapter, you will learn about dimensional and relational modeling. You will explore how the BI Semantic Model supports both types of data models as a unified semantic model. You will discover the conceptual layers of the BI Semantic Model. They provide flexibility in how you can create models, richness in how you can express business logic, and scalability in terms of model and organizational sizes.
Furthermore, you will explore the options available for building each layer of the model. You will learn about designing data access and storage, see how to implement business logic in the model, and learn how other tools, such as Excel and Power View, use the model. You also will become familiar with dimensional modeling and relational/tabular modeling, discover the spectrum and needs of BI applications, explore the conceptual architecture of the BI Semantic Model, and understand the model's hybrid nature.
Introduction to Data Modeling
In previous chapters, you started to build your first reports, and then you explored more sophisticated report layouts, visualizations, and expression calculations. The type of data source for your reports can vary, and the chapters so far have focused on connecting to data stored in relational databases.
Many organizations use databases to keep track of the things they are doing to run their business — acquiring raw materials, manufacturing products, receiving orders, delivering services, receiving client payments. Each of these interactions results in one or more data transactions stored in databases.
Databases are often carefully designed and optimized for efficiently processing and storing data transactions. This typically results in structures designed to minimize any redundancy of data stored, often split into small chunks. This structure is frequently called normalized schemas.
Although these underlying database structures are a concept familiar to developers and IT professionals, they are often difficult for business users to understand. At times it can be challenging to use them to answer typical business intelligence questions. For example:
- Which product was the best-seller during the past winter season among my most profitable customers?
- What was the average quantity in stock for my best-selling products in retail stores during the past month?
- If a product was sold out in one retail store, how often was it available in another store within 5 miles?
Transactional databases typically focus on day-to-day operation. Databases frequently use the relational data model. It is a mathematical model defined in terms of predicate logic and set theory.
Answering the business questions just mentioned often requires comparing historical and current data. Transactional databases often don't store historical information, but only reflect the current situation, such as how many products of each type are in stock right now.
The dimensional model is a specialized adaptation of the relational model. It represents data in data warehouses in a way that allows data to be easily summarized using Online Analytical Processing (OLAP) queries. The so-called unified dimensional model (UDM) was originally introduced with SQL Server Analysis Services.
In the dimensional model, a database schema frequently consists of a large table of facts (such as sales transactions) that are described using dimensions and measures.
A dimension provides the context of a fact (such as which products were sold to which customer at what time) and is used in queries to group related facts. Dimensions tend to be discrete and are often hierarchical. For example, a time dimension may include year, quarter, month, day, and hour, and a geographic dimension may include country, state, region, city, and street.
A measure is a quantity describing the fact, such as cost or revenue. Measures are frequently aggregated as facts and grouped by dimensions. In an OLAP query, such as revenue for a particular product during the past year in the United States, all facts associated with those particular dimension values are grouped and aggregated to return the result.
The BI Semantic Model
The BI Semantic Model is a hybrid of the relational data model and the dimensional model. It unifies both types of models under a single BI platform for all BI end-user tools, such as Excel and Power View, newly added in SQL Server 2012.
The model builds on the strengths and success of Analysis Services and expands its reach to a much broader user base. Every UDM becomes a BI Semantic Model, so existing applications and tools built on previous version of Analysis Services and cubes simply keep working. For new applications, you have two options (tabular and dimensional) to build a model, but with a single common BI Semantic Model served to client tools. The model encompasses the capabilities of UDM today and also new interfaces and experiences for the tabular paradigm. One model provides all end-user experiences, such as accessing data from Excel, Reporting Services, and Power View. It is the same model for all tools — no conversions, no separate storage, and no separate security.
PowerPivot for Excel is one way of creating a BI Semantic Model. PowerPivot includes a wizard that you can use to import data from different types of sources. Data is imported into PowerPivot for Excel as tables, which are shown as separate sheets in the PowerPivot window, similar to worksheets in an Excel workbook.
PowerPivot data is stored in an analytical database (the so-called VertiPaq database) inside the Excel workbook, and a local VertiPaq engine loads, queries, and updates the data in that database. You can create relationships between tables in the PowerPivot window. The VertiPaq engine leverages the richness of Analysis Services object models internally, but without imposing dimensional modeling concepts on users.
Any Excel PowerPivot workbooks created with the original PowerPivot add-in for Excel 2010, released with SQL Server 2008 R2, already contain an autogenerated BI Semantic Model. They can be immediately leveraged with the new capabilities in SQL Server 2012, such as Power View.
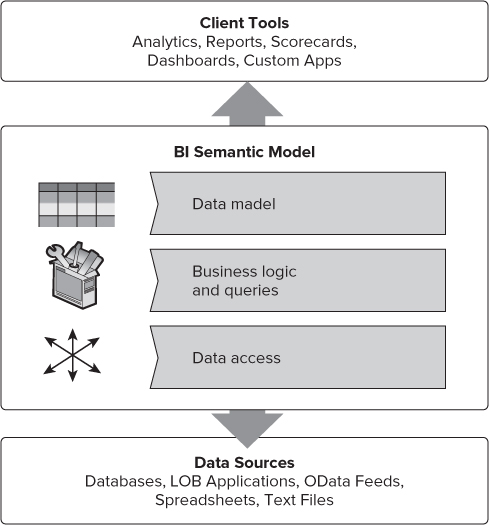
The BI Semantic Model embraces the relational data model, well understood by developers and professionals, and provides flexibility to meet the needs of a variety of BI applications. The role of the data access layer shown in Figure 9.1 is to mash up and relate data. It integrates data from several sources, including databases, data warehouses, OData feeds, web services such as SQL Azure, spreadsheets, text files, and existing Reporting Services reports rendered as Atom data feeds.
The model offers an expression language to define calculations, map to business entities, extend the data with calculated columns, and enrich the model with metadata. The underlying language is called DAX (Data Analysis Expressions language). It is closely modeled after the Excel formula language, with extensions. For example, the language includes time-based analysis functions to simplify expressing business logic in calculations.
The information is then served to client tools, such as Excel and Power View, as a semantic model that influences and drives a BI tool's automatic behavior. For example, a product sales revenue field's default aggregation is typically defined as “sum,” and for rebates the default aggregation may be defined as “average.” When the end user chooses any of these fields in an interactive analysis or visualization, the default aggregation is automatically applied in the specific usage context.
The BI Semantic Model powers experiences in business user tools as well as a spectrum of BI application scenarios, as shown in Figure 9.2. Personal BI focuses on business users who want to perform BI analysis in a flexible, self-service fashion using tools they are familiar with, without requiring advanced skills or the IT department. This empowers business users to create contents in their user context and typically manage them as documents. Business users are familiar with the concepts of granting access and managing document security.
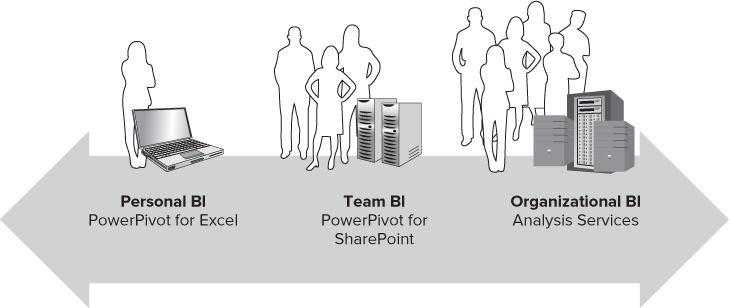
PowerPivot is a freely downloadable add-in for Excel that provides a modeling experience focused on tables and relationships, with which business users are often familiar. PowerPivot offers very fast performance for hundreds of millions of rows of data directly within Excel. Every PowerPivot workbook contains an automatically generated BI Semantic Model. Models in workbooks can be consumed in Excel as pivot tables, published to SharePoint to be used with Excel Services, or published to a PowerPivot Gallery in SharePoint.
Team BI focuses on collaboration among a workgroup. It may involve server infrastructure, such as SharePoint, to provide a common place for business users and IT departments to publish, share, and collaborate. An Excel PowerPivot workbook published in a SharePoint document library utilizes PowerPivot for SharePoint as an underlying service to expose APIs for model metadata discovery and query execution.
PowerPivot for SharePoint also includes services that integrate with Excel Services to consume and edit spreadsheets with PowerPivot data directly in the browser.
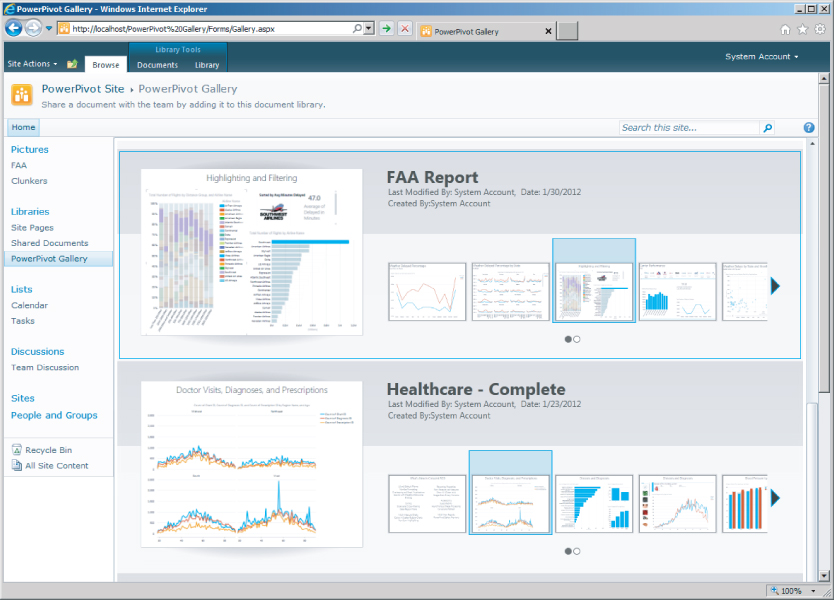
Furthermore, PowerPivot Gallery, shown in Figure 9.3, is a special-purpose SharePoint document library that provides rich preview and document management for the following:
- Excel workbooks that contain PowerPivot data, including the ability to specify a schedule for data refresh
- Power View reports
- Other document types
The PowerPivot Gallery combines an accurate preview of the file contents with facts about document origin. You can discover who created the document and when it was last modified. To create preview images, PowerPivot Gallery uses a snapshot service that can read PowerPivot Excel workbooks, Reporting Services, and Power View reports. If you publish a file that the snapshot service cannot read, no preview image is available for that file.
Organizational BI scenarios typically involve much data and many users. The contents are frequently created and managed by IT departments for business users. PowerPivot models originally created in Excel can be imported and extended using a professional developer-oriented SSDT (SQL Server Data Tools) PowerPivot modeling experience, which provides richer and more advanced capabilities. The underlying modeling technology is still the same, though. An IT department can track usage trends of business user-created PowerPivot workbooks in SharePoint, set up scheduled data refresh, and efficiently move workbooks as needed to dedicated Analysis Services servers. PowerPivot models from Excel, as well as models created in SSDT, can be deployed directly to an Analysis Services server. This provides scalability as models grow to billions of rows and increase in popularity from individual users to workgroups with dozens of users to large organizations with hundreds or thousands of users.
The choices available for how to build models, storage options, and query languages are discussed later in this chapter. Using multidimensional models with Reporting Services is covered in detail in Chapters 10 and 11, and tabular modeling is discussed in Chapter 12.
Conceptual Architecture
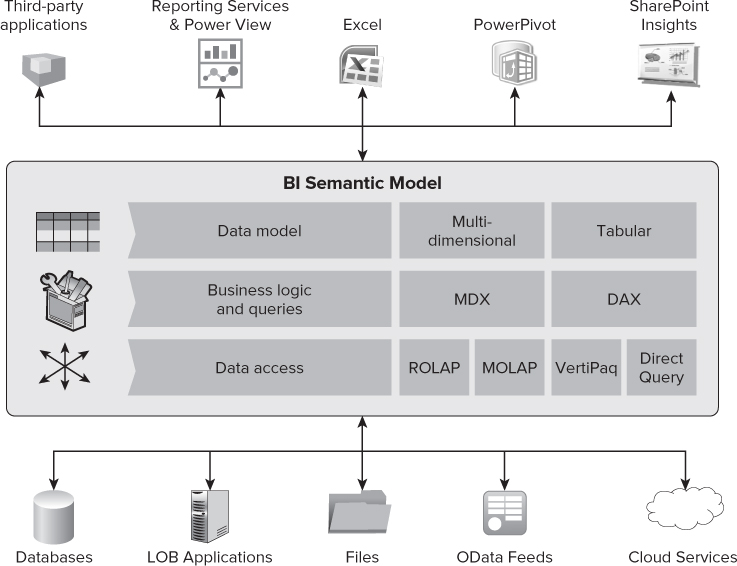
The BI Semantic Model supports a variety of data source types, as shown in Figure 9.4. For example, using the PowerPivot add-in for Excel, a business user can easily integrate and mash up data on their own from different sources directly in Excel, and thereby create a tabular model without actively thinking about modeling. The data integration could involve data added manually into Excel worksheets and linked to the model, data from external connections such as databases, data from SQL Azure and Azure Marketplace, data from web services and OData feeds directly from web sites.
In addition, an existing PowerPivot workbook can serve as a data source. For instance, an IT department can publish a model on an Analysis Services server or as a workbook in SharePoint, which business users then can leverage to mash up with their own data. This enables IT departments to provide “certified” data sources and monitor usage to adjust server capacity as needed. This also enables reuse (instead of copying) of modeled data. It also helps avoid issues with multiple copies of data disconnected from original sources that become inconsistent over time and are difficult to manage.
The BI Semantic Model has three layers:
- Data model
- Business logic and queries
- Data access
Each layer contributes to the hybrid nature of the BI Semantic Model, explained in more detail later in this chapter. First, we'll focus on each layer of the BI Semantic Model.
Data Model
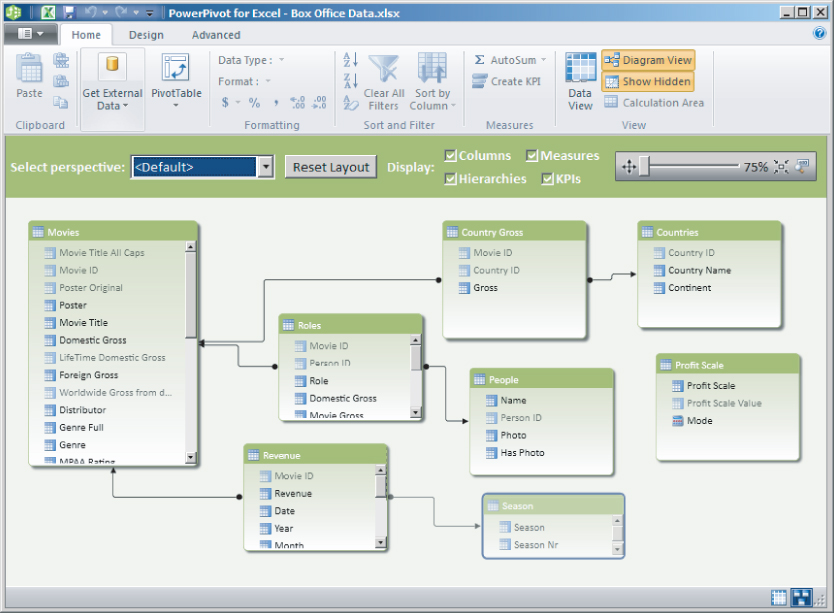
The data model is consumed by applications such as Excel (PivotTable, PivotChart) and Power View to comprehend the model's contents, such as tables, relationships, and other metadata. Figure 9.5 shows a data model, with hidden columns and tables in gray.
There are two ways to build a model: PowerPivot for Excel and SSDT.
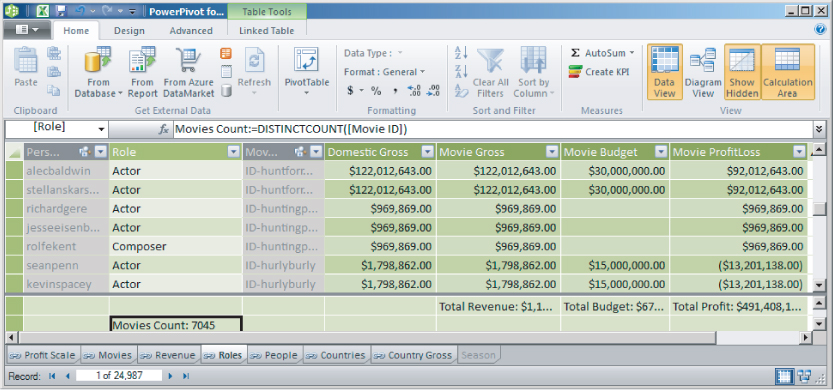
Business users may prefer to use PowerPivot for Excel, shown in Figure 9.6, to create models. PowerPivot is focused on tables and relationships and provides a simplified user interface experience for a lower barrier of entry. Power users can still easily create advanced workbook applications that rely on data relationships between tables as in a database, include calculated columns and measures, and aggregate over billions of rows.
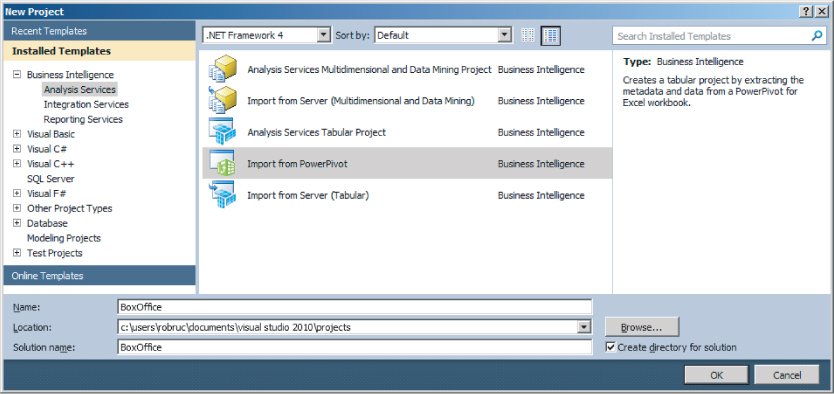
Developers and professional users may prefer SSDT to create a multidimensional model or a tabular model, and to get access to advanced properties and settings. Besides creating new models, the project types available in SSDT also allow you to import an existing model or cube already deployed on an Analysis Server and import from an Excel PowerPivot workbook (see Figure 9.7).
Here are some examples of model settings available only in SSDT:
- Fine-grained security to set up read, read and refresh, refresh, and administration privileges for particular roles and users
- Defining model partitions avoids reloading all rows in a model, but only small partitions. Any table can be partitioned, including dimension tables in tabular models, because everything is a table.
Table 9.1 compares tabular and dimensional model creation options.
| Tabular Modeling | Dimensional Modeling |
| A familiar model for many business users. Typically easier to build, with faster time to solution. | A sophisticated model with a steeper learning curve. |
| It's quick and easy to wrap a model over a raw database or warehouse for reporting and analytics. | Best suited for OLAP-type applications (such as planning, budgeting, and forecasting) that need the more advanced capabilities of the multidimensional model. |
| Advanced concepts (parent/child, many-to-many) are unavailable natively in the tabular model. You need calculations to simulate these. | Advanced concepts are baked directly into the model and are optimized (parent/child, many-to-many, attribute relationships, key versus name). |
Business Logic and Queries
Two languages can be used to express business logic and queries. MDX is a well-established and powerful language for expressing sophisticated business logic. It has achieved broad adoption as a standard, beyond the Analysis Services platform.
DAX is a new expression language inspired by the Excel formula language. DAX is built on top of tabular concepts to lower the barrier of entry to implement business logic. DAX was introduced in the PowerPivot add-in for Excel 2010. It was extended to become a query language in SQL Server 2012 (such as utilized by Power View).
SSDT for SQL Server 2012 offers a multidimensional project type. It expresses business logic in MDX and uses multidimensional OLAP (MOLAP) or relational OLAP (ROLAP) storage, as well as a tabular project type, to use the DAX expression language and VertiPaq or DirectQuery storage modes. Future versions could include additional project types, such as VertiPaq storage in multidimensional projects, or MDX scripts in tabular projects.
It is important to note that regardless of how the model is built, and which language is chosen to express business logic, client tools can use both MDX and DAX to send and execute queries.
Table 9.2 compares the use of DAX and MDX for business logic.
| DAX | MDX |
| DAX is based on Excel formulas and relational concepts. It's typically easy for new users to get started. | MDX is based on understanding multidimensional concepts, which has a higher initial learning curve. |
| Complex solutions such as row/filter context and calculated measures require a steeper learning curve. | Provides more expressive power than DAX, but complex solutions require a steeper learning curve (CurrentMember concept, calculation scopes, overwrite semantics). |
Data Access
The BI Semantic Model offers several storage modes to both cache the data, and occasionally refresh or pass through queries and calculations to the model's underlying data sources.
ROLAP and MOLAP storage are well known and available for multidimensional models. These storage modes are optimized for disk I/O to achieve high performance but also are somewhat rigid.
MOLAP uses disk-based storage with compression (typically a 3x compression ratio) and can scale up to terabytes. MOLAP typically requires aggregation tuning to determine a good trade-off between performance gains and aggregation maintenance costs. Calculations use disk scans with in-memory subcube caching.
ROLAP passes through fact table requests as queries to the original data source. This is supported for most types of relational databases. ROLAP storage is not recommended for large dimension tables.
VertiPaq is an in-memory column-store database technology that is optimized, but not limited, to main memory. VertiPaq achieves very high data compression ratios (typically 10× and, in some real-world scenarios, closer to 100× compression). It does not require any tuning, indexes, or aggregation. It accomplishes very fast performance by executing queries through sophisticated scanning algorithms of compressed data in memory. VertiPaq is the underlying technology and engine that power PowerPivot for Excel, PowerPivot for SharePoint, tabular models in Analysis Server in SQL Server 2012, and the new SQL Server 2012 Column Store Index in the relational database.
Direct Query passes through and translates DAX queries and calculations to the underlying database. This provides up-to-date results in each query execution. The data source is not just used as a row store, but the generated queries leverage database capabilities to execute queries efficiently. Currently in SQL Server 2012, the only type of relational data source that supports Direct Query is the SQL Server database. Another restriction is that only DAX queries, not MDX queries, can be translated for models in Direct Query mode (although it is likely to soon be an update to change that). Power View generates DAX queries, so it can leverage models configured with Direct Query enabled. A primary scenario for Direct Query in SQL Server 2012 is exposing a model (without cached data) directly over a SQL Server database or data warehouse.
Chapter 12 explains tabular model design in more detail, and provides a tutorial using PowerPivot for Excel.
The Hybrid Nature of the BI Semantic Model
It is important to note that regardless of how the data access layer, business logic, or data model are built and designed, client applications interact with one representation of the BI Semantic Model.
For example, a sales model is created with PowerPivot in Excel, is imported to SSDT, is further enhanced, and then is deployed to an Analysis Server to provide scalability for large data volumes:
- Data model is tabular
- Business logic is DAX
- Data access is VertiPaq
For the model in this example, Table 9.3 analyzes how the BI Semantic Model is used when a business user connects when using an Excel PivotTable or PivotChart, when using Power View, and when using Report Builder.
| Excel PivotTable, PivotChart | Power View | Report Builder |
| The BI Semantic Model is consumed as a multidimensional model. | Consumed as a tabular model. | Depending on the query designer utilized, may be multidimensional or tabular. |
| Excel generates MDX queries. | Power View generates DAX queries. | Depending on the query designer utilized, may be MDX or DAX queries. |
As a second example, consider a finance model with complex business logic. The model is created with SSDT as a cube and deployed to an Analysis Server:
- Data model is multidimensional
- Business logic is MDX
- Data access is MOLAP
Although the model's underlying internal layers are quite different from the first example, a BI Semantic Model is still exposed. Business users can connect using an Excel PivotTable or PivotChart and Report Builder (see Table 9.4). Power View in SQL Server 2012 won't work, because the multidimensional MOLAP model doesn't yet support DAX queries. They should be supported in the future, however, at which point the promise of a full hybrid model will be fulfilled.
| Excel PivotTable, PivotChart | Power View | Report Builder |
| The BI Semantic Model is consumed as a multidimensional model. | Not yet supported in SQL Server 2012. Should be supported in a future update. | The BI semantic model is consumed as a multidimensional model. |
| Excel generates MDX queries. | MDX is used as the query language. |
Summary
This chapter introduced data modeling and the BI Semantic Model. It provided an overview of how client tools such as Excel PivotTable and Power View consume models, and the options available to build models.
This chapter also provided a more detailed explanation of the conceptual layers of the BI Semantic Model, what options exist for each layer, and what application and user needs to consider for the layers of data access and storage, business logic, and data model.
This chapter's overview provides a solid foundation for your detailed exploration of building reports over multidimensional models, as well as building tabular models and using Power View, in the following chapters.