
Creating models of your solution
Enforcing application architecture
Exploring existing architectures
The VSTS Architecture edition offered four diagrams for designing distributed systems, which were almost never used by teams in production. These four diagrams have all been dropped in Visual Studio 2010 and all of the functionality targeted for architecture tasks is brand new. This functionality can be split into two broad categories.
The first new feature is Modeling Projects, which allow you to create UML diagrams to build up an application model. There is also a new diagram that can be used to determine and enforce certain relationships between code elements in your projects.
The other new features all revolve around navigating and understanding existing code bases. This includes the ability to generate sequence diagrams from C# and VB methods, as well as Dependency Graphs of various components in your solution. Finally, Visual Studio 2010 includes the new Architecture Explorer, which is used to quickly navigate your solution.
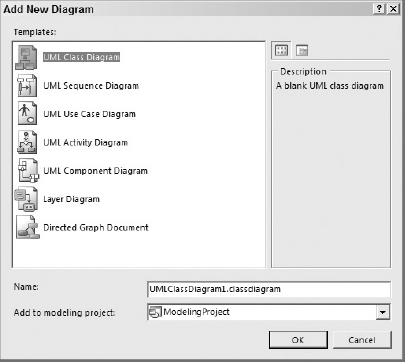
A model in software terms is an abstract representation of some process or object. You create models to better understand and communicate to others the way different parts of the application are intended to work. In Visual Studio 2010, you keep all of your models together in a Modeling Project. Modeling Projects are found on their own page in the Add New Project dialog. You can also create a new Modeling Project by adding a diagram to your solution with the Architecture
Many of the diagrams in a Modeling Project can easily be attached to Work Items in Team Foundation Server, which makes them a great tool for communicating with the rest of the team.
Note
The ability to create Modeling Projects and their associated diagrams is limited to the Ultimate edition of Visual Studio 2010. The Premium edition includes the ability to view Modeling Projects and diagrams already created by someone else.
The Unified Modeling Language (UML) is an industry standard for creating diagrammatic models. Visual Studio 2010 has the ability to create the most common UML diagrams, including Activity Diagrams, Component Diagrams, Class Diagrams, Sequence Diagrams, and Use Case Diagrams.
Note
The Visual Studio 2010 UML diagrams adhere to the UML 2.0 standard.
A Use Case Diagram (Figure 54-2) defines the users of a system (Actors) and the tasks they need to achieve with the system (Use Cases). As Figure 54-2 shows, each use case can be made up of subordinate use cases. Use Case Diagrams are typically very high level.
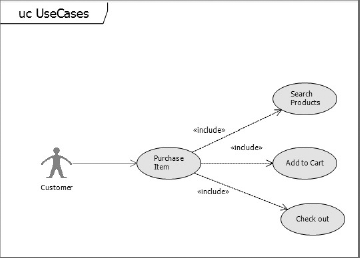
Modeling Use Cases helps you to focus on the objectives of the end users and ensure that their needs are being met by the application that you are providing. Additionally, it helps to identify the boundaries of your application with respect to the user's needs, which is very good for understanding the scope of what you need to build. Use Cases are typically associated with User Story and Test Case work items within TFS.
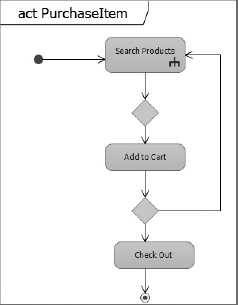
An Activity Diagram (Figure 54-3) describes the actions and decisions that go into performing a single task. Activity Diagrams and Use Case Diagrams are often used to show different views of the same information. Use Cases are often better at showing the hierarchical nature of tasks that a user performs, whereas Activity Diagrams show how each of the sub-tasks are used.
Activity begins with the small black circle and follows the arrows until they reach the circle with the ring around it. Each rounded box is an activity and each diamond shape represents a decision about which activity to move to next. The small fork icon in the bottom-right corner of the Search Products activities identifies it as calling another activity.
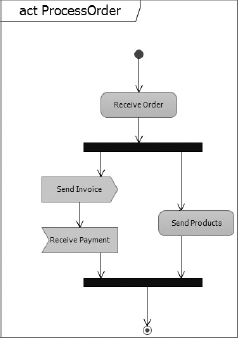
Activity diagrams can also run activity streams in parallel as shown in Figure 54-4. This figure also shows sending and receiving events asynchronously.
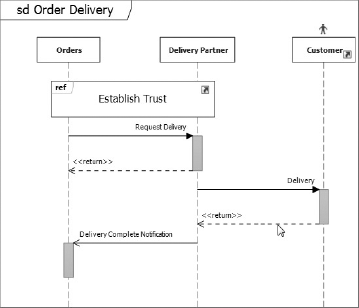
A Sequence Diagram (Figure 54-5) shows the messages passed between different components in a system or between systems during some larger activity. You use a Sequence Diagram when you want to show the flow of activities from one actor to another within a system.

Running along the top of the diagram are boxes representing the different actors involved. Running down from each actor is a dashed lifeline on which hangs thicker execution contexts that show where in the process each actor is performing some operation. As you read a sequence diagram, moving down a lifeline equates to moving forward in time. Running between the lifelines are messages being passed back and forth between the different actors. Messages can be synchronous (closed arrow) or asynchronous (open arrow). Messages can be found, which means that you don't know where they come from, or lost, which means that you don't know where they go. These commonly appear at the boundaries of the activity being modeled.
An Interaction Use (Figure 54-6) is a piece of a Sequence Diagram that is separated out and can be re-used. To create an Interaction Use, select it from the Toolbox and then drag a rectangle over the lifelines that should be involved. Once an Interaction Use has been created, you can use it to generate another sequence diagram or link it to an existing one. Double-clicking an Interaction Use opens its diagram.
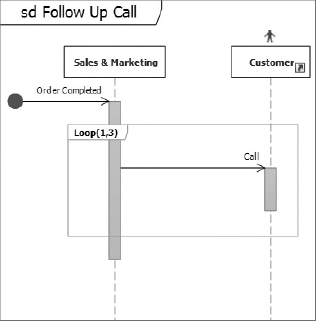
Sometimes you need to group a few execution contexts and messages together. An example is when you want to repeat an interaction in a loop. To do this, you need to create a Combined Fragment (Figure 54-7) by selecting the elements that should be involved and selecting one of the Surround With options.
Note
Although they both use the same notation, UML Sequence diagrams should not be confused with .NET Sequence diagrams. UML Sequence diagrams can only be created within Modeling Projects and can include elements from other parts of the model. .NET Sequence diagrams are generated from existing .NET code and are not a part of the model.
A component is a single unit of functionality that can be replaced within its environment. Each component hides its internal structure but publishes provided interfaces that other components can use to access its features. Additionally, each component can publish a set of required interfaces that it needs to perform its tasks. A Component Diagram (Figure 54-8) shows the components in a system along with their published and required interfaces. It also shows how published interfaces will be matched up with required interfaces.
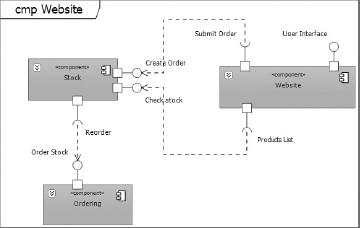
Modeling components helps you to think about the parts of your application as discrete units. This in turn reduces the coupling in your design, making your application easier to maintain and evolve going forward. You will typically model interactions between systems components (or between the parts inside a component) with a Sequence Diagram. You can use a Class Diagram to model the interfaces of a component along with the data that travels between the interfaces (parameters).
You can also use a Class Diagram to describe the classes that make up components' parts. Finally, you use an Activity Diagram to model the internal processing of a component.
A Class Diagram (Figure 54-9) allows you to model the types in your system and the relationships between them. These are probably the most widely used of the UML diagram types in the industry. You can define classes, interfaces, and enumerations. Each of these items can be related to each other by inheritance, composition, aggregation, or just association. Each item can have attributes and operations defined on them. Finally, these items can be grouped into packages.

Note
Although based on the same notation, UML Class Diagrams should not be confused with .NET Class Diagrams. A UML Class Diagram is used to define and organize elements of the model. A .NET Class Diagram performs a similar role for .NET code. Changing a .NET Class Diagram will alter the underlying .NET code.
Each of the UML diagrams actually present different views of the same underlying model. To see the entire model, you can use the UML Model Explorer (Figure 54-10) tool window. As you add content to your model using the various diagrams, each element will also appear in the UML Model Explorer.
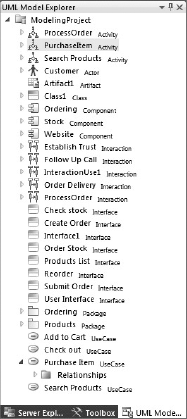
You can add items directly to the model using the context menu on many of the nodes in the UML Model Explorer. You can also drag elements from the Model Explorer directly onto the surface of many diagrams. Doing this creates a link between the original element and its appearance on the diagram. When you try to delete any element from a UML diagram, you have the option to simply remove it from the diagram or to remove it from the model altogether.
A Layer Diagram (Figure 54-11) is a tool that helps you specify the high-level structure of a software solution. It is made up of different areas or layers of your application and defines the relationships between them.
Each layer is a logical group of classes that commonly share a technical responsibility, such as being used for data access or presentation.
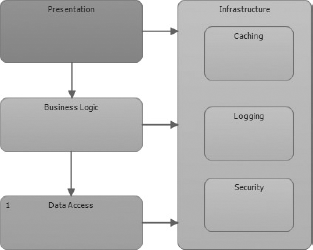
Once you have created a new Layer Diagram, you can drag each layer onto the design surface and configure it with a name. You can draw directed or bidirectional dependency links between layers. A layer depends on another layer if any of its components have a direct reference to any of the components in the layer it depends on. If there is not an explicit dependency, it is assumed that no components match this description.
Note
As is shown in Figure 54-11, layers can be nested inside one another.
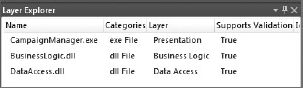
Once you have created a layer diagram you use it to discover communications between layers in your compiled application and to verify that these links match the design. Before you do this, you need to associate projects with each layer by dragging them from the Solution Explorer and onto the layer itself. As you do this, entries are added to the Layer Explorer tool window (Figure 54-12) and a number inside each layer is updated to reflect the number of artifacts associated with it.
Note
You can create new layers by dragging projects from the Solution Explorer directly onto the Layer Diagram surface.
Once the layer diagram has assemblies associated with it, you can fill in any missing dependencies by selecting Generate Dependencies from the design surface context menu. This will analyze the associated assemblies, building the project if necessary, and fill in any dependencies that are missing. Note that the tool won't ever delete unused dependencies.
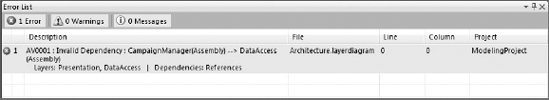
When your layer diagram contains all of the layers and only the dependencies that you would expect, you can verify that your application matches the design specified by the layer diagram. To do this, you can select Validate Architecture from the design surface context menu. The tool will analyze your solution structure and any violations that are found will appear as build errors, as seen in Figure 54-13. Double-clicking one of these errors opens a Directed Graph showing the relationships between the various projects.
Note
Not all artifacts that can be linked to a layer diagram support validation. The Layer Explorer window has a Supports Validation column, which can help you determine if you have linked artifacts for which this is true.
Modeling projects have a Boolean property called ValidateArchitecture, which is used to determine if all Layer Diagrams should be validated whenever the project is built. You can also request that Team Foundation Build validates your architecture by adding a property called ValidateArchitectureOnBuild to your TfsBuild.proj file or Process Template and setting it to true.
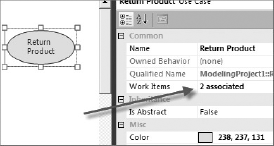
Each of the elements of a diagram in a Modeling Project, as well as the diagrams themselves, can be linked to Work Items in Team Foundation Server. You can do this from the context menu of the item you would like to associate and selecting either Create Work Item or Link to Work Item. When a model element is associated with Work Items, it will show in the properties window for that element (Figure 54-14). You can also get a list of Work Items that an element is linked to by selecting View Work Items from the element's context menu.
Many advanced features in Visual Studio are designed to help you understand and navigate the structure of an existing code base. Directed Graphs give you a high-level view of the relationships between various types of components within your project. The Architecture Explorer lets you deep dive into different areas while still leaving a trail of breadcrumbs to help you understand where you are. The ability to generate Sequence Diagrams lets you quickly understand how a particular method behaves, especially as it relates to other methods and classes.
One of the hardest aspects of navigating a new code base is understanding where you are in relation to everything else. The Architecture Explorer window (Figure 54-15) allows you to move very quickly through the code structure with single clicks, leaving a trail that always makes it easy to figure out how you got to wherever you end up. Some elements can be dragged from the Architecture Explorer directly onto the design surfaces of many of the other diagrams in this chapter.
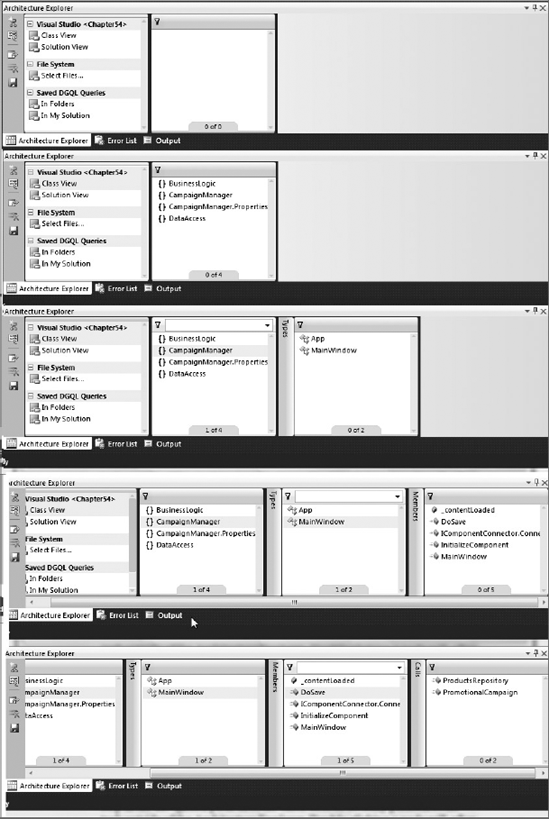
Figure 54-15 shows the progression of columns, each of which contains a series of nodes. Each time you click a node in a column, a new column opens up based on the node selected. Between each of the columns is a collapsed Action column, which you can expand by clicking it (Figure 54-16). Selecting a different action allows you to change the next step in the navigation path. In some cases, actions actually perform some task outside of the Architecture Explorer. Double-clicking a node will often open it in the editor window.
Note
You can select multiple nodes in a column to see a union of the results in the next column.
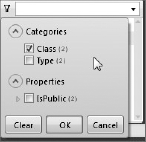
Each column in the Architecture Explorer can be independently filtered in one of two ways. The simplest way is to type into the textbox at the top of the column and press Enter. This filters the content based on the information you entered. The other way is to use the Category and Property Filter box (Figure 54-17) by clicking the small filter icon in the top-left of the column. When a column is filtered, it will have a large filter icon in its background.
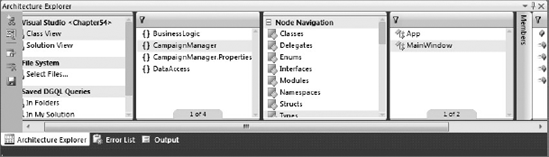
The first column is the Architecture, which is a special column that contains views, each of which belongs to a domain. The Solution domain offers the Class View, which is based on a logical view of your classes, and the Solution View, which is based on the physical layout of your files. The File System domain allows you to load compiled assemblies from disk and analyze them in the Architecture Explorer.
The Saved DGQL Queries domain offers access to previously saved queries. These queries can be saved as a part of your solution or they can be located in your DocumentsVisual Studio 10ArchitectureExplorerQueries folder. To save a query, use the Save Query to Favorites button on the left of the Architecture Explorer.
When you inherit an existing code base, one of the more difficult tasks is trying to figure out the dependencies between the different assemblies, namespaces, and classes. A Dependency Graph allows you to visualize the dependencies between items at different levels of focus. The easiest way to create a Dependency Graph is the Architecture
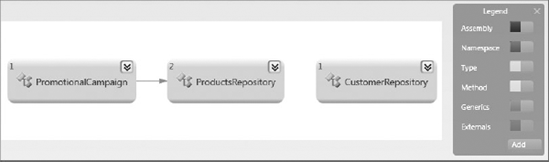
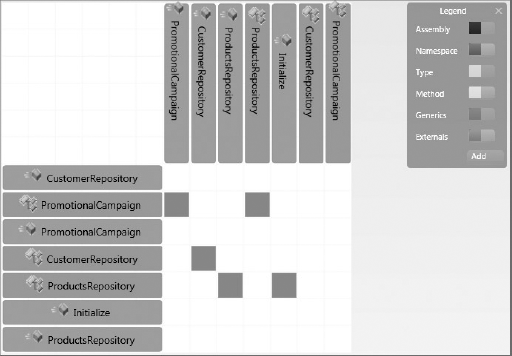
In addition to these views, there is a Dependency Matrix view (Figure 54-19), which shows a colored square whenever the item in the row depends on the item in the column.
Visual Studio 2010 includes three analyzers for dependency graphs that can help you find potential problems with a code base. These are enabled and disabled under the Analyzers context menu and will update the legend to colorize any items that match criteria defined by the analyzer.
Circular References: These can become difficult to detect, especially as the number of components involved grows. This analyzer will detect strongly connected items and colorize them.
Show Hubs: A hub is a component that many other components depend on. These can be difficult to change because the impact of most changes tends to ripple out through the rest of the system.
Unreferenced Nodes: These are nodes that no other node takes a dependency on. This can be an issue because it might indicate that the item it represents is not used by anyone else. It may also mean that the items that are dependent on it are not in the diagram.
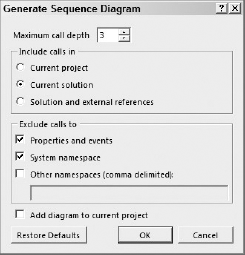
A .NET Sequence Diagram allows you to model the implementation of a C# or VB method. The best way to create a .NET sequence diagram is to right-click a method signature in the editor window and select Generate Sequence Diagram to display the Generate Sequence Diagram dialog shown in Figure 54-20.
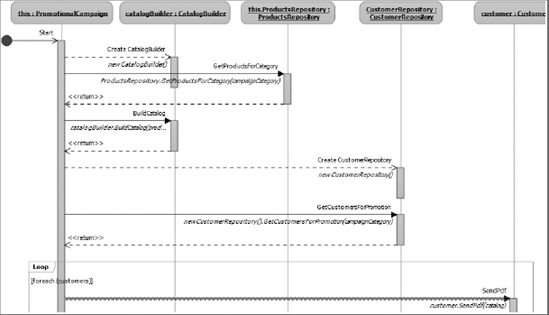
Once you click the OK button, Visual Studio analyzes your project and produces a .NET Sequence Diagram as in Figure 54-21. You can make changes to this sequence diagram without affecting the underlying code, so you can use this diagram to rapidly try out different ideas about how the code should work.
Note
You can add a .NET Sequence Diagram to any .NET project by using the Add New Item dialog. If you add a Sequence Diagram this way, it will not be related to a specific .NET method.
Modeling Projects provide a great way for you to communicate the design of your project clearly, unambiguously, and effectively. You can use Use Case Diagrams, Activity Diagrams, and Sequence Diagrams to model user requirements from a number of different perspectives. You will use Component Diagrams, Class Diagrams, and Layer Diagrams to model the structure of your application. The ability to verify that your application meets the architecture as designed by the Layer Diagram can be a useful sanity check to ensure project quality standards remain high and architectural decisions are not abandoned once the project gets underway.
Getting up to speed with an existing code base can be very hard. Directed Graphs are an easy way to identify the relationships between various parts of your application. The new Architecture Explorer allows you to rapidly move through the connections between components in the system to find the items that you are looking for. Finally, the ability to generate a Sequence Diagram from an existing method allows you to quickly grasp the fundamentals of how a method interacts with other methods and classes within the application.