
Long gone are the days where debugging an application involved adding superfluous output statements to track down where an application was failing. Visual Studio 2010 provides a rich interactive debugging experience that includes breakpoints, tracepoints, and the Edit and Continue feature. This chapter covers how you can use these features to debug your application.
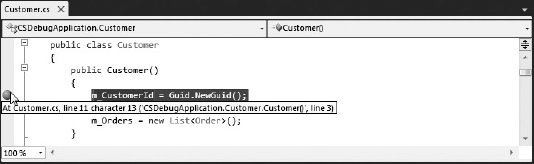
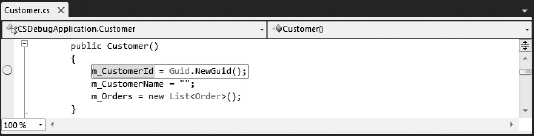
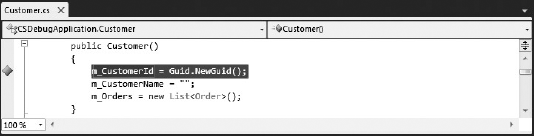
A breakpoint is used to pause, or break, an application at a particular point of execution. An application that has been paused is said to be in Break mode, causing a number of the Visual Studio 2010 windows to become active. For example, the Watch window can be used to view variable values. Figure 40-1 shows a breakpoint that has been added to the constructor of the Customer class. The application breaks on this line if the Customer class constructor is called.
Breakpoints can be set either through the Debug menu, using the Breakpoint item from the right-click context menu, or by using the keyboard shortcut, F9. The Visual Studio 2010 code editor also provides a shortcut for setting a breakpoint using a single mouse click in the margin.
An application can only be paused on a line of executing code. This means that a breakpoint set on either a comment or a variable declaration will be repositioned to the next line of executable code when the application is run.
A breakpoint can be set on a line of code by placing the cursor on that line and enabling a breakpoint using any of the following methods:
Selecting Toggle Breakpoint from the Debug menu.
Selecting Insert Breakpoint from the Breakpoint item on the right-click context menu.
Pressing F9.
Clicking once in the margin of the code window with the mouse. Figure 40-1 shows the location of the mouse cursor immediately after a breakpoint has been set using the mouse.
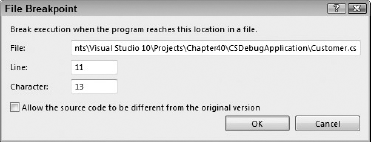
Selecting Location from the Breakpoint item on the right-click context menu for the line of code with the breakpoint set displays the File Breakpoint dialog, shown in Figure 40-2. Here you can see that the breakpoint is set at line 11 of the Customer.cs file. There is also a character number, which provides for the case in which multiple statements appear on a single line.
Another type of breakpoint that can be set is a function breakpoint. The usual way to set a breakpoint on a function is to select the function signature and either press F9 or use the mouse to create a breakpoint. In the case of multiple overloads, this would require you to locate all the overloads and add the appropriate breakpoints. Setting a function breakpoint enables you to set a breakpoint on one or more functions by specifying the function name.
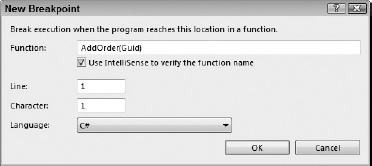
To set a function breakpoint, select Break at Function from the New Breakpoint item on the Debug menu. This loads the New Breakpoint dialog shown in Figure 40-3, in which you can specify the name of the function on which to break. There is a toggle to enable IntelliSense checking for the function name. The recommendation is to leave this checked, because it becomes almost impossible to set a valid breakpoint without this support.
Unfortunately, the IntelliSense option doesn't give you true IntelliSense as you type, unlike other debugging windows. However, if you select the name of the function in the code window before creating the breakpoint, the name of the function is automatically inserted into the dialog.
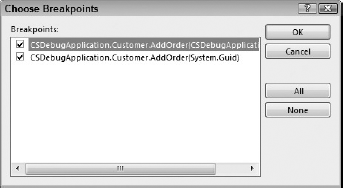
When setting a function breakpoint, you can specify either the exact overload you want to set the breakpoint on or just the function name. In Figure 40-3, the overload with a single Guid parameter has been selected. Notice that unlike a full method signature, which requires a parameter name, to select a particular function overload, you should provide only the parameter type. If you omit the parameter information, and there are multiple overloads, you are prompted to select the overloads on which to place the breakpoint, as illustrated in Figure 40-4.
Another way to set a breakpoint is via the Call Stack window. When the application is in Break mode, the call stack shows the current list of function calls. After selecting any line in the call stack, a breakpoint can be set in the same way as a file breakpoint, as described earlier (toggle Breakpoint from the Debug menu, use the F9 keyboard shortcut, or use Insert Breakpoint from the context menu). Figure 40-5 shows a short call stack with a new breakpoint set on a control event on Form1.
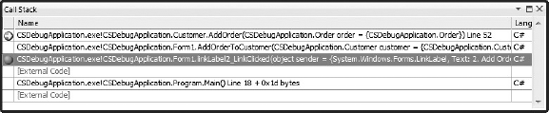
The call stack is generated using function addresses. As such, the breakpoint that is set is an address breakpoint. This type of breakpoint is only useful within a single debugging session, because function addresses are likely to change when an application is modified and rebuilt.
Though breakpoints are useful for pausing an application at a given point to review variables and watch application flow, if you are looking for a particular scenario it may be necessary to break only when certain conditions are valid. Breakpoints can be tailored to search for particular conditions, to break after a number of iterations, or even be filtered based on process or machine name.
A breakpoint condition can be specified by selecting Condition from the Breakpoint item on the right-click context menu for the breakpoint. This brings up the Breakpoint Condition dialog shown in Figure 40-6, which accepts a Boolean expression that determines whether the breakpoint will be hit. If the expression evaluates to false, the application continues past the breakpoint without breaking.
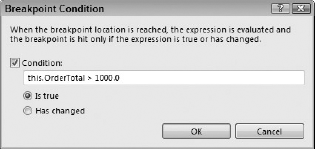
In the case of Figure 40-6, which is for a breakpoint set within the Order class, the condition specifies that the order total must be greater than 1000. As with most debugging windows, the Condition field provides rich IntelliSense support to aid writing valid conditions. If an invalid condition is specified, the debugger throws an appropriate error message and the application will break the first time the breakpoint is reached.
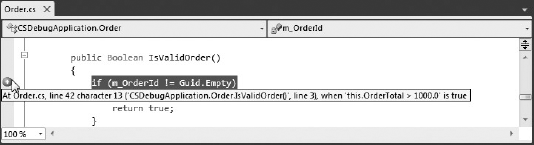
When a condition, or a hit count, as shown in the next section, is placed on a breakpoint, the breakpoint changes appearance. The solid red dot is replaced with a red dot with a white cross. When you move your mouse across this dot, the tooltip provides useful information about the breakpoint condition, as illustrated in Figure 40-7.
Sometimes it is more relevant to know when this condition changes status, rather than when it is true. The Has Changed option breaks the application when the status of the condition changes. If this option is selected, the application will not break the first time the breakpoint is hit, because there is no previous status to compare against.
Note
Using multiple breakpoints with complex conditions can significantly slow down the execution of your application, so it is recommended that you remove breakpoints that are no longer relevant in order to speed up the running of your application.
Though it's perhaps not as useful as breakpoint conditions, it is also possible to break after a particular number of iterations through a breakpoint. To do this, select Hit Count from the Breakpoint item on the right-click context menu. Figure 40-8 shows the Breakpoint Hit Count dialog, which can be used to specify when the breakpoint should be hit.
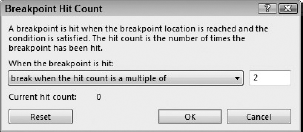
Every time the application is run, the hit count is reset to zero, and it can be manually reset using the Reset button. The hit count is also unique to each breakpoint. The hit count condition is one of four options:
Always: Disregard the hit count.
Is equal to: Break if the hit count is equal to the value specified.
Multiple of: Break if the hit count is a multiple of the value specified (as shown in Figure 40-8).
Is greater than or equal to: Break if the hit count is greater than or equal to the value specified.
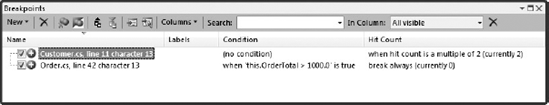
Figure 40-9 shows the Breakpoints window, which provides additional information about the status of each of the breakpoints. In this case, the breakpoint is set to break every second time. The current hit count is 2.
A single solution may contain multiple applications that need to be run at the same time. This is a common scenario when building a multi-tier application. When the application is run, the debugger can attach to all these processes, enabling them to be debugged. By default, when a breakpoint is reached all the processes will break. This behavior can be controlled from the Debugging (General) node in the Options window, accessible from the Options item on the Tools menu. Unchecking the Break All Processes When One Process Breaks checkbox enables processes to be debugged individually.
If a breakpoint is set in a class library that is used by more than one process, each process will break when it reaches that breakpoint. Because you might be interested in debugging only one of these processes, you can place a filter on the breakpoint that limits it to the process you are interested in. If you are debugging applications on multiple machines, it is also possible to specify a machine name filter.
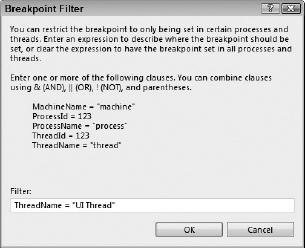
In fact, filtering can be useful for a multi-threaded application for which you want to limit the breakpoints to a particular thread. Although the breakpoint will only be triggered when a thread matches the filter criteria, all threads will still be paused. Figure 40-10 shows the Breakpoint Filter dialog and the possible filter conditions.
It's often necessary to adjust a breakpoint, because it might be in the wrong location or no longer relevant. In most cases it is easiest to remove the breakpoint, but in some cases — for example, when you have a complex breakpoint condition — it might be necessary to adjust the existing breakpoint.
To remove a breakpoint that is no longer required, select it, either in the code editor or in the Breakpoints window, and remove it using the Toggle Breakpoint item from the Debug menu. Alternatively, the Delete Breakpoint item from the right-click context menu or the Delete Breakpoint icon from the Breakpoints window toolbar will remove the breakpoint.
Instead of deleting a breakpoint, simply disabling the breakpoint can be useful when you have a breakpoint condition set or you are tracking a hit count. To disable a breakpoint, select it either in the code editor or in the Breakpoints window, and disable it using the Disable Breakpoint item from the right-click context menu. Alternatively, you can uncheck the checkbox against the breakpoint in the Breakpoints window. Figure 40-11 shows how a disabled breakpoint would appear in the code window.
The location of a breakpoint can be modified by selecting Location from the Breakpoint item on the right-click context menu. Depending on what type of breakpoint has been set, the dialog shows the location of the breakpoint as either a line and character position in a file or function, or as an address within an assembly. If the location is either a file or function position, the breakpoint can be adjusted so it is in the correct location. Address breakpoints are harder to relocate, because you need to ensure that the new address is a valid location for a breakpoint.
One new feature introduced in Visual Studio 2010 is the ability to assign a label to a breakpoint. This is particularly useful if you want to group a set of related breakpoints together. Once labeled, you can search for and perform a bulk action on all breakpoints with a specific label.
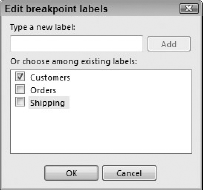
To assign a label to a breakpoint, right-click the breakpoint and choose Edit Labels. This displays the Edit Breakpoint Labels dialog, shown in Figure 40-12, where you can attach one or more labels to the breakpoint.
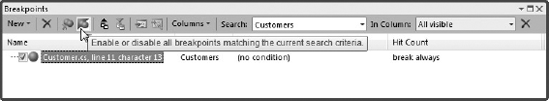
After you have labeled your breakpoints you can perform bulk actions on them by opening the Breakpoints window (Debug
Note
By default, the search will be performed across all columns that are shown in the Breakpoint window. You can limit the search to specific columns by changing the In Column drop-down from All Visible to a specific column.
Another new debugging feature in Visual Studio 2010 is the import and export of breakpoints. This feature allows you to back up and restore breakpoints, and share them among developers. This functionality was previously impossible, because the location of breakpoints is stored in the binary solution user options file (.suo), along with a whole raft of other user-specific information.
Export of breakpoints is performed from the Breakpoints window (Debug
Import of breakpoints can also be performed from the Breakpoints window by clicking the appropriate button on the toolbar.
A tracepoint differs from a breakpoint in that it triggers an additional action when it is hit. In fact, for purposes such as applying filters, conditions, and hit counts, a tracepoint can be thought of as a breakpoint.
Tracepoints can be compared to using either Debug or Trace statements in your code, but tracepoints can be dynamically set as the application is being debugged and will not affect your code.
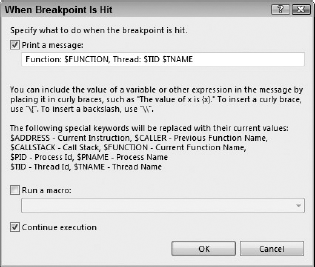
Tracepoints can be created from either an existing breakpoint or the Breakpoint right-click context menu. To create a tracepoint from an existing breakpoint, select When Hit from the Breakpoint right-click context menu. The resulting dialog, shown in Figure 40-14, gives you the option of printing a message to the console window or running a macro. Alternatively, to create a tracepoint at a new location, select Insert Tracepoint from the Breakpoint item on the right-click context menu. This again loads the dialog shown in Figure 40-14 so you can customize the tracepoint action.
Once you set a tracepoint, the code window changes the appearance of that line of code to indicate that a tracepoint has been set. This is shown in Figure 40-15, where the tracepoint appears with a diamond in the margin (the diamond is red, although this can't be seen in the figure).
Two types of actions can be performed when a tracepoint is hit: either print a message to the console window or run a macro. In the dialog shown in Figure 40-14, you can indicate which action should be run when the tracepoint is hit. If both actions are unchecked, the tracepoint will fall back to being a breakpoint.
By default, once a tracepoint action has been indicated, the Continue Execution checkbox will be checked so the application will not break at this point. Unchecking this option causes the application to break at the tracepoint as if it were a breakpoint. The action defined will be performed prior to the application breaking. The appearance of this tracepoint will be the same as that of a breakpoint, because the visual cue indicates that the debugger will not stop at the tracepoint, rather than indicating that there are actions associated with the tracepoint.
As the dialog in Figure 40-14 suggests, a number of keywords can be used in conjunction with your trace message. However, a couple of keywords are not listed by the dialog: $FILEPOS, which gives the location of the current file, and $TICKS, which can be used as a relative time indicator.
Tracepoints can execute any Visual Studio macro, which includes macros you may have created. Because macros can be used to modify source code, be careful which macros you execute within a tracepoint. Modifying code while debugging an application may result in the source code being out of sync with the running application. Visual Studio macros are discussed in Chapter 52.
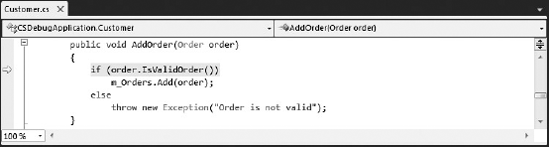
After reaching a breakpoint, it is often useful to be able to step through code and review both variable values and program execution. Visual Studio 2010 not only enables you to step through your code, it also permits you to adjust the execution point to backtrack or even repeat operations. The line of code that is about to be executed is highlighted and an arrow is displayed to the left, as shown in Figure 40-16.
The first step in manipulating the execution point is simply to step through code in the expected order of execution. Three size increments can be used to step the debugger forward. It is important to remember that when stepping through code it is actually being run, so variable values may change as you progress through the application.
Stepping Over is fully executing the line that currently has focus and progressing to the next line in the current code block. If the end of the code block has been reached, Stepping Over returns to the calling code block.
Stepping Into behaves the same as Stepping Over when the line is a simple operator, such as a numeric operation or a cast. When the line is more complex, Stepping Into steps through all user code. For example, in the following code snippet, pressing F10 through the TestMethod only steps through the lines of code within TestMethod. Pressing F11 steps through TestMethod until the MethodA call is made, and then the debugger steps through MethodA before returning to TestMethod:
C#
public void TestMethod()
{
   int x = 5 + 5;
   MethodA();
}

private void MethodA()
{
   Console.WriteLine("Method A being executed");
}If you step into a long method by accident, it is quite often convenient to be able to step back out of that method without having to either step over every line in that method or setting a breakpoint at the end of the method. Stepping Out moves the cursor out of the current method to where it was being called. Considering the previous snippet, if you entered MethodA, pressing Shift+F11 would immediately return the cursor to the end of TestMethod.
One very welcome feature that was introduced with Service Pack 1 of Visual Studio 2008 is the ability to automatically step over properties and operators. In many cases, public properties are simply wrappers for a private member variable, and as a result there is very little to be gained from stepping into them while debugging. This debugger option is especially useful if you are calling a method that passes a number of properties as parameters, such as the method call listed here:
C#
printShippingLabel(cust.name, shipTo.street, shipTo.city, shipTo.state,
shipTo.zipCode);
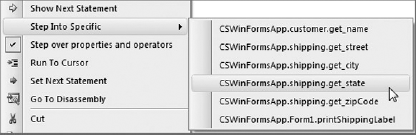
With the Step Over Properties and Operators option enabled, the debugger steps directly into the first line of the printShippingLabel method if you hit F11. If you need to, you can manually step into a specific property by right-clicking the code editor window and selecting Step Into Specific. This displays a submenu with each of the available properties listed, as shown in Figure 40-17.
The Step Over Properties and Operators option is enabled by default. You can enable or disable it during debugging by right-clicking anywhere in the code editor window and selecting it from the context menu, or from the Options dialog window (Tools
As you become familiar with stepping in and out of functions, you will find that you are occasionally overzealous and accidentally step over the method call you are interested in. In this case, what you really want to do is go back and review the last action. Though you can't actually unwind the code and change the application back to its previous state, you can move the execution point so the method is reevaluated.
To move the current execution point, select and drag the yellow arrow next to the current line of execution (refer to Figure 40-16) forward or backward in the current method. Use this functionality with care, because it can result in unintended behavior and variable values.
One of the most useful features of Visual Studio 2010 debugging is Edit and Continue. Both C# and Visual Basic have support for Edit and Continue, enabling you to make changes to your application on the fly. Whenever your application is paused, you can make changes to your code and then resume execution. The new or modified code is dynamically added to your application, with the changes taking immediate effect.
At this point, you are likely wondering whether any limitations exist on the changes that you can make. The answer is yes, and there are quite a few types of rude edits, which refer to any code change that requires the application to be stopped and rebuilt. A full list of rude edits is available from the Visual Studio 2010 help resource under the Edit and Continue topic, but they include the following:
Making changes to the current, or active, statement
Changes to the list of global symbols — such as new types or methods — or changing the signatures of methods, events, or properties
Changes to attributes
When changes are made to the source code while the application is paused, Visual Studio has to integrate, or apply, the changes into the running application. Depending on the type or complexity of the changes made, this could take some time. If you want to cancel this action, you can select Stop Applying Code Changes from the Debug menu.
Most developers who use Visual Studio 2010 will use breakpoints to track down issues with their application. In this chapter, you learned how to optimize the use of breakpoints to reduce the amount of time spent locating the issue.
The following chapter examines data tips and explains how to create debugging proxy types and visualizers. This allows you to customize the debugging experience and reduce the time spent wading through unnecessary lines of code.