
Analyzing code for potential problems
Profiling applications to find bottlenecks
Developing database projects
The Premium and Ultimate editions of Visual Studio 2010 have many advanced features for developers mainly designed to improve quality and facilitate database development. The quality tools include code metrics, static analysis, and profiling tools. It's not that you can't develop quality software with other editions or that using these tools will make sure your software performs well. Obviously, there's more to it than using a few tools, but these can be of great help and will reduce the time invested in other tasks like code review and debugging. The most interesting new debugging tool is called IntelliTrace, which allows you to capture environment information associated with failed test cases.
Chapter 26 already examined some of the tools available for working with databases in Visual Studio 2010. This chapter looks at two main areas: SQL-CLR development, and tools to help teams working with databases. The first will aid in developing and deploying .NET code that will be hosted inside SQL Server. The second will allow you to version schema changes, isolating developers and allowing them to compare changes, auto-generate data, and share their modifications easily with other developers or DBAs.
Code metrics serve as a reference to know how maintainable your code is. Visual Studio 2010 provides five metrics for your source code, which are all shown in the Code Metrics window (Figure 55-1). To open this window use the Analyze
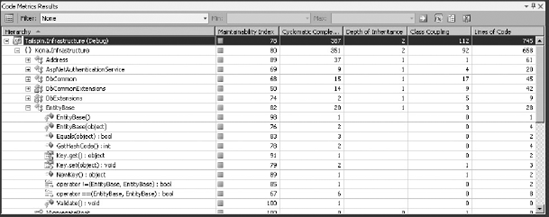
Directly from the list, you can filter any of the metrics to show methods that fall within a specified range, export to Excel, configure columns to remove metrics, or create a Team Foundation Server work item. Export to Excel is particularly useful to generate reports using pivot tables or to work with a flat view of the information using filters and sorts. For example, if you want to look for methods with more than 15 lines of code, filtering directly in the Code Metrics window will get you a lot of namespaces and types, but you will have to expand each to see whether there are any methods, whereas in Excel you can easily filter out namespaces and types and only look at methods.
As you use the metrics to make decisions about your code, bear in mind that the actual values are not as important as relative values. Having a rule that states "all methods must have less than 25 lines of code" is not as useful as one that makes relative statements such as "prefer shorter methods." You should also consider the changing values as important, so if your average Maintainability Index is going down it might be a sign you need to focus on making code easier to maintain.
Note
For each metric except for Maintainability Index, lower numbers are considered to be better.
The name is self-explanatory; however, it's worth mentioning that the purpose of this metric should be only to get a clue of the complexity of the code, and must not be used to measure progress. Clearly, a method with five lines of code that calls other methods will be simpler than if you inline all 25 lines of code in that method.
public class OrdersGenerator
{
  public void GenerateOrder(Order order)
  {
    IsUnderCreditLimit(order);
    IsCustomerBlocked(order.Customer);
    AreProductsInStock(order);
    IsCustomerBlocked(order);
    SaveOrder(order);
  }
  // remaining methods are omitted.
}
If you compare a class with six methods, as shown in the preceding code, with a class having the same functionality, but with all the code inlined in one method, the latter will have 25 lines. Assuming the remaining methods have five lines each, the former will be 30 lines long, although it is simpler. You have to be careful about how to consider this metric; a longer class might be better than a short one.
Note
Use the Extract Method refactoring discussed in Chapter 8 to reduce this metric. Be sure to keep an eye on extracted methods to see if they might be better off in a new class.
This metric counts the base classes; some recommendations are to have a value lower than six. But this, like other metrics, has to be looked at with special care. It's hard to give a recommended value and it's relative to which classes you are inheriting from. If you inherit from LinkLabel, you will have a depth of 4, but your base classes are less likely to change than if you inherit from ProviderXComponent and have a depth of 1. It's more probable that ProviderX will change his component and break yours, while Microsoft will take more care not to break code. But you'll probably never update ProviderX's library. The point is that this metric is relative to what base classes you have.
This counts the dependencies an item has on other types except for primitives and built-in types like Int32, Object, and String. The more dependencies you have, the harder it's supposed to be to maintain, because it would be more probable that changes on other types will cause a break in your code. Similarly to depth of inheritance, the importance you give is relative to the dependencies you have. A class referencing System libraries is less likely to have a break than classes referencing other types on active development. You can see a value for this metric at each level of the hierarchy (project, namespace, type, and member).
Cyclomatic Complexity is a measure of how many paths of execution there are through your code. A method with higher cyclomatic complexity is going to be harder to understand and maintain than one with a lower value. It is hard to find a recommended value for this metric because it depends on the level of your team and on the team that will maintain the product. Far more important is trending information — a steadily increasing cyclomatic complexity indicates that your code is getting harder to understand and follow. Having said that, sometimes a complex solution is warranted.
This metric is calculated using a formula that considers cyclomatic complexity, lines of code, and the Halstead volume, which is a metric that considers the total and distinct number of operators and operands. It will give you a range between 0 and 100, with the higher being easier to maintain than the lower.
Code marked with the CompilerGenerated and GeneratedCode attributes won't be considered in the metrics. Datasets and Web Service Proxies are examples of code marked with the GeneratedCode attribute, but other generated code (like Windows Forms) isn't marked and will be considered in the metric's results.
This is a tool based on FxCop, a Microsoft internal tool released to the public a few years ago and finally integrated into the IDE. It allows you to perform static code analysis using a set of rules that define the quality decisions that you want to apply to your code. You can configure which set of rules to apply to each project from the project property page shown in Figure 55-2.

To use it you can right-click a project and select Run Code Analysis, or if you selected Enable Code Analysis on Build in the project's property window, you can simply compile it. The rules will be evaluated and if there is any violation (and believe me, there will be sooner or later) you will have a set of warnings in the Error List window.
Note
By default each violation will appear as a warning, but you can change this behavior.
If you right-click a warning and select Show Error Help, you will have a description of the rule, the cause, steps on how to fix violations, and suggestions on when to suppress warnings. Suppressing warnings is done with the System.Diagnostics.CodeAnalysis.SuppressMessageAttribute, which can be applied to the offending member or to the assembly as a whole. You can quickly and easily generate these attributes by selecting one of the Suppress Message menu options from the right-click menu in the Errors window.
More than 200 rules are conveniently organized into 11 categories, and you can add custom rules if needed. Depending on your project, you might want to exclude some categories or some particular rules. For example, if you don't need globalization and don't have plans in the future to support it, you might exclude that category. You can even create your own sets of rules (Add New Item
When you first get started with Code Analysis tools, you should turn on all the rules and either exclude or suppress the warnings as needed. This is an excellent way of learning best practices. After a couple of iterations, new code written will be less prone to violate a rule. If you are starting a new project you might want to add a check-in policy, which prevents code with Analysis warnings from being checked in.
Note
Never suppress a warning unless you have a very good reason. Finding these violations again can be quite difficult.
This tool is similar to the Managed Code Analysis Tool, but works for unmanaged code. To activate it simply go to your C++ project's properties window, look for the Code Analysis node inside the Configuration Properties, and select Yes for Enable Code Analysis for C/C++ on Build. Every time you compile your project, the tool will intercept the process and attempt to analyze each execution path.
It will help you detect crashes that are otherwise hard to find with other techniques like debugging that are very time consuming. It's able to detect memory leaks, uninitialized variables, pointer management problems, and buffer over/under runs.
Profiling tools enable you to detect and correct performance and memory issues in your projects. You can start a profiling session by selecting Launch Performance Wizard from the Analyze menu. The first step of the wizard asks you to select one of four profiling methods:
CPU Sampling reports the CPU utilization at regular intervals while your application is running. This type of profiling is good for initial analysis or for identifying issues specifically related to CPU usage.
Instrumentation actually inserts additional lines of code into your assembly to report on the length of time each method call takes. You can use this sort of profiling to get a detailed look at where your application spends most of its time.
The .NET Memory profiler collects data about objects as they are created and as they are cleared up by the garbage collector.
Concurrency profiling collects information about multi-threaded applications and provides some visualizations that you can use to explore several concurrency-related issues.
Next you need to select a project, executable, DLL, or web site to profile. With that information, the Performance Wizard creates a performance session and opens the Performance Explorer window. You could also create a blank session from the Performance Explorer or from a test in the Test Results window.
In the Performance Explorer (Figure 55-3) you can change between instrumentation and sampling. Using the combo box, you could start the wizard again or manually create a new performance session. Although you can instrument or sample a DLL, you need a point of entry for your application to run when you start the session, so be sure to include an executable, web site, or test project as a target.

Note
If you have high code coverage, profiling unit test projects can give you a good insight into which methods take the longest to execute or use the most memory. Be wary of reacting to this information, though, because long-running methods may be called infrequently and improving an already fast method that is called many times will have a greater impact on overall application performance.
To configure your session, simply right-click and select Properties. In the General section you can change between Sampling, Instrumentation, and Concurrency (Figure 55-4), and choose if you want to activate .NET memory profiling collection, the output for the reports, and the report names.
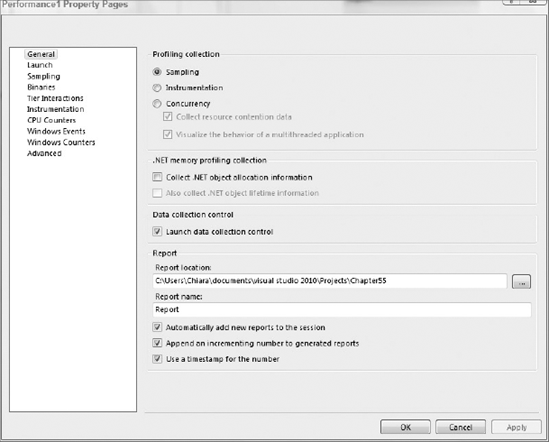
In the Sampling section, you can select when to take samples; by default this is set to 10,000,000 clock cycles. Depending on what you want to track, you can change the sample event to page faults, system calls, or a particular performance counter.
Enabling Tier Interaction Profiling (TIP) allows you collect information about synchronous ADO.NET calls between your application and SQL Server. This includes the number of times each query is made and how long each one took. If you are profiling an ASP.NET WebForms application, TIP is also able to provide data about page request counts and generation times.
The Instrumentation section is used to specify pre- and post-instrument events, for example signing an assembly with a strong name. These settings are set on a per-target basis. The last section in the property page, Advanced, is also used when instrumentation is selected, and there you can specify additional command arguments. To see a list of available options, search for VSInstr on MSDN. VSInstr is the tool used to instrument binaries.
The remaining sections are used to specify the collection of different counters or events. CPU Counters will let you capture additional low-level information and will be displayed as extra columns in the different report views. These are only available for instrumentation. The Windows Counters are system performance counters and you will be able to see the results in the Marks report view.
The Windows Events section will let you specify event trace providers. To see the information on Windows events, you would need to manually get a text report using the following command:
Vsperfreport c:<path>ReportName.vsp /calltrace /output:c:<path>
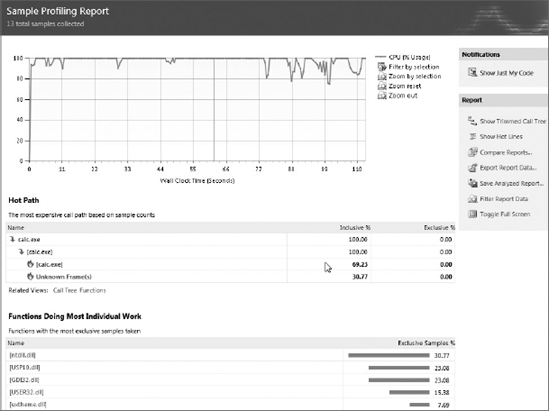
Once you are all set, you can start the application, test, or web site from the Performance Explorer. It will run as usual, but will be collecting data. Once your application terminates, a report will be generated. Table 55-1 shows a description of some of the report views and Figure 55-5 shows the Summary View.
Table 55.1. Some Report Views
VIEW NAME | DESCRIPTION |
|---|---|
Summary | Shows function information. Sampling it will show functions causing the most work and functions with the most individual work. With instrumentation it will show the most called functions with the most individual work and functions taking the longest. From here you can navigate to the Functions view. If Collect .NET Object Allocation Information is selected as shown in Figure 55-4, it will show functions allocating the most memory and types with the most memory allocated and most instances. |
Call Tree | Contains a hierarchy of the functions called. The Call Tree has a feature called Hot Spot that will point you to child functions taking the most time. |
Modules | Shows information about the module sampled or instrumented. |
Caller/Callee | Shows you which functions a particular function called and which functions called it. |
Functions | Presents a list of all the functions sampled or instrumented. Double-clicking each function lets you navigate to the caller/callee window. |
Allocations | Shows the number of instances and bytes allocated of a particular type. |
Additional reports can be generated using the command-line tool VSPerfReport. For more information, consult the MSDN documentation.
Allocation and Object Lifetime are only available if you select Collect .NET Object Allocation Information and Also Collect .NET Object Lifetime Information, respectively, in the session's property page. Some of the report views are different depending on the configuration. To see a description of a particular column, simply hover over its title. You should go through the documentation on MSDN to get a thorough description on each report.
In all the views, you can use the filter from the toolbar to get to specific information. You can add or remove columns by right-clicking a header and sort using a particular column. Reports can be exported to either XML or CSV and successive reports can be compared against one another, allowing you to spot changes in your application's performance.
This is a command-line tool that is useful when you need to profile an application without installing Visual Studio on the machine — for example, in a production environment. To install this tool, you need to execute vs_profiler.exe from the Visual Studio installation media located in the Standalone Profiler folder. It will install the tools in the directory %ProgramFiles%Microsoft Visual Studio 10.0Team ToolsPerformance Tools. If you are going to use the command-line profiler often, you could add this path to the system path.
The following commands profile an application using sampling with the default settings. The first line enables the trace. The next command switches the profiler to use CPU Sampling and to output a report. In this case the report will be saved in the ApplicationToProfile directory on a file named Report.vsp. Then you launch the application, interact with it as usual, and when you are done you finally shut down the Profiler. You can then open and inspect the generated report in Visual Studio.
C:ApplicationToProfile>vsperfclrenv /traceon
Enabling VSPerf Trace Profiling of managed applications (excluding allocation
profiling).
...
C:ApplicationToProfile>vsperfcmd -start:sample -output:Report
Microsoft (R) VSPerf Command Version 10.0.30128 x86
...
C:ApplicationToProfile>vsperfcmd -launch:Application.exe
Microsoft (R) VSPerf Command Version 10.0. 30128 x86
...
Successfully launched process ID:4144 Application.exe
C:ApplicationToProfile>vsperfcmd -shutdown
Microsoft (R) VSPerf Command Version 10.0. 30128 x86
...
Shutting down the Profile Monitor
IntelliTrace is a new tool in Visual Studio 2010 Ultimate that makes debugging your application a lot easier. It operates like a flight recorder while you are in a debug session and allows you to look back at historical values and state. In addition to this, you can save IntelliTrace sessions and load them back up at a later time. Testers who are using Microsoft Test and Lab Manager can also collect IntelliTrace information while they run through test cases, providing you with the exact state of the system when a bug is reported.
Note
IntelliTrace currently supports C# and VB projects with experimental support for F#. You cannot use IntelliTrace by using the Attach To Process command or in remote debugging scenarios.
When a debugging session is started and IntelliTrace is enabled (Tools
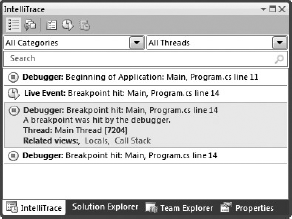
As each new diagnostic event occurs, Visual Studio adds it to the end of the list. If you pause the execution or hit a breakpoint, the IntelliTrace window becomes active. If you click any of the diagnostic events, it expands to show a little more information. This expanded view contains a list of Related Views, which have been updated by IntelliTrace to reflect the state of the application at the time of the event. You can check the call-stack, add watches, check locals, and generally perform any of the tasks that you would normally be able to during a normal debugging session. When you are ready to resume execution of the application you can click the Return to Live Debugging button.
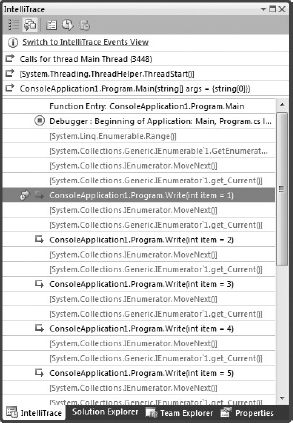
IntelliTrace is able capture two types of information during a debugging session. IntelliTrace Events are enabled by default and include Visual Studio debugger events such as application start and hitting breakpoints. Throwing and catching exceptions are also IntelliTrace events. When a tester is collecting IntelliTrace information, the beginning and end of a test along with any failures form contextual events that are covered under the label of IntelliTrace Events. Finally, the Framework itself is able to raise some diagnostic events. You can find a list of these in the IntelliTrace options.
The other type of information, that IntelliTrace can track is method calls along with parameter information. To use this information, you need to turn it on before starting the debugging session (Tools
When you are in an IntelliTrace session with Call Information enabled, a new border is added to the editor window, which contains IntelliTrace navigational markers (Figure 55-8). You can use these to navigate the IntelliSense information from inside the editor. This border is a light grey during normal debugging, but turns a darker grey when IntelliSense is activated.

IntelliTrace files (.tdlog files) are stored in a default location on your hard drive and can be archived and re-opened later. When you open a .tdlog file you see the IntelliTrace Summary view. By double-clicking a thread or an exception, you can open the IntelliTrace session at the appropriate point and begin debugging again.
Note
By default, IntelliTrace files are stored in the C:ProgramDataMicrosoft Visual Studio10.0TraceDebugging folder. You can always check where the files are stored from Tools
Most applications require some kind of database to store data when it is not being used. Visual Studio 2010 Premium provides all of the capabilities that were previously introduced with the Database edition of VSTS and adds tools that were previously only available as Power Tools.
In the New Project dialog inside the Database node are two nodes for C# and VB SQL-CLR Database projects. These are used to create managed classes to use inside a SQL Server. When you create a new project of this type, you will be prompted for a connection and to enable CLR debugging. Use CLR debugging only on development database servers and isolated from other developers, as explained later in the "Best Practices" section.
You can add to this project some types like Aggregates, User-Defined Functions, Stored Procedures, Triggers, User-Defined Types, and Classes. You can think of this as a normal VB/C# project; you can add classes, references, and even web references. You can create unit tests for your methods as explained in Chapter 11, refactor your code, and build, in the same way you would for other library projects. However, the debugging history is a bit different, because your code is running in an SQL Server context. First you will need to allow VS to remote debug the code. This is needed only the first time you debug your project. However, the point of entry for your code will be through a script that will use any of your managed objects. As you may have noticed when you created the project, there's already a file named Test.sql, which is used to create and test your types.
The test scripts can grow quickly, and long script files are not easy to maintain. You can add new test scripts and right-click to set them as Default Debug Script. This is similar to the way you would set an ASP.NET page as the start page. You can set a breakpoint on the script or the classes you are testing and hit F5 (or from the menu Debug
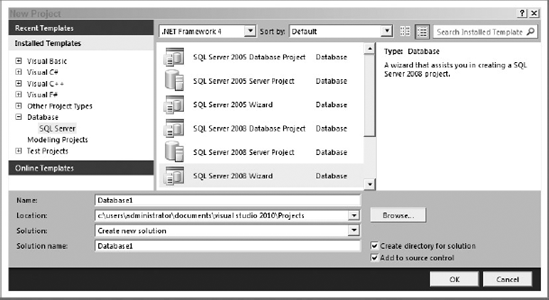
There's another type of Database Project and it's inside the Microsoft SQL Server node, as shown in Figure 55-9. As you can see, there are three options each for SQL Server 2005 and SQL Server 2008, but it's basically the same project type; the difference between them is the use of a wizard and the SQL Server version being targeted. Some options are available only from the creation of the project using the wizard, so I suggest you start using that. These projects will let you have an offline representation of your DB schema, so that you can version it along with your code. It will create a file for each schema object and deploy the changes to a database.
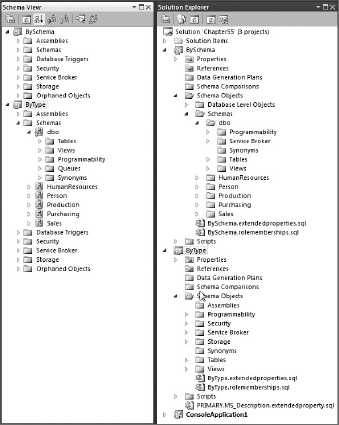
If you run the wizard for SQL Server 2008, the first option will let you choose whether your project will manage a single database or a SQL Server. This is the same as choosing either Database Project or Server Project in Figure 55-9. The other option on this page is to organize the files by schema or object type (tables, views, stored procedures, and so on). This is important because you can't change this option once the project is created, although you will find yourself working on the Schema View most of the time instead of doing it directly on the files — from that window you can select or deselect the filter by Schema View. However, if you select "No" to organizing by schema inside the types, you can still distinguish the schema because of the prefix added to each filename. On the other hand, if you select to organize by schema, inside of each you will have folders for each type. Figure 55-10 shows at the left the Schema View filtered by schema. You could change this option to organize all the objects by type. The Solution Explorer (at the right) shows two different projects where files are physically organized differently.
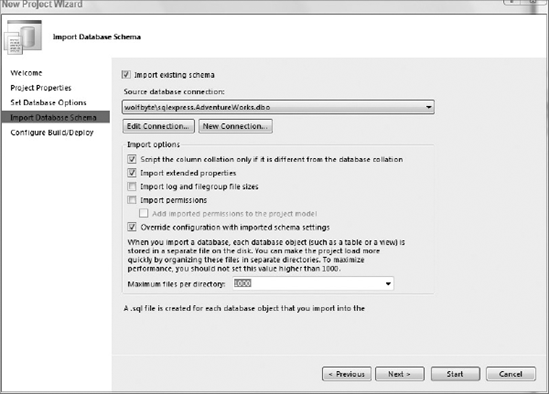
The database options are the next step of the wizard; if you don't know your defaults now, don't be afraid to choose something and change it once you get this information from either your DBA or your production DB. You can select to import this configuration directly from a DB. If you can connect to your production DB, it's a good idea to import them at this moment. To do this, simply go to the next step in the wizard and mark the needed checkboxes as shown in Figure 55-11.
The last step is to configure the build and deployment options. You will need more deployment configurations, so here you will only select your development database. Keep in mind this doesn't have to be the same as in the previous step — here you are configuring your development database and in the previous step, if available, you would import existing objects and configuration from a production DB. You see the three configurations needed in more detail later, so for now you can go with the default options. The final step will take a while, especially if you have many objects to import.
Once the wizard finishes, you can add, edit, or delete schema objects right from the Solution Explorer or the Schema View (View
When working with Source Control, this type of project becomes really useful. The scenario would be that each developer works on his own server instance. One of them has made changes to the schema and his .NET code and deployed them to his instance. He then tests the .NET application and it works fine with the new database changes. Then he checks in all of his changes to the server and another developer retrieves the changes. When the second developer deploys his database instance it is also updated with the latest changes, and he will be running the new code changes along with the new schema changes applied to his SQL Server instance.
In addition to versioning the schema, you might want a way to generate data for testing purposes. To do this, you need to add a Data Generation Plan. If you right-click the Offline Schema project under the Add menu, you will find the option for Data Generation Plan. By default, all the tables on the schema will be selected, but you can override these settings. In the top section of Figure 55-12, only the Products table is checked. The ProductModel and ProductCategory tables are automatically added (darkened checkboxes) because of the foreign key between Products and those tables.
Note
Keep in mind these generation plans are only for development and testing purposes. Don't run them on production servers.
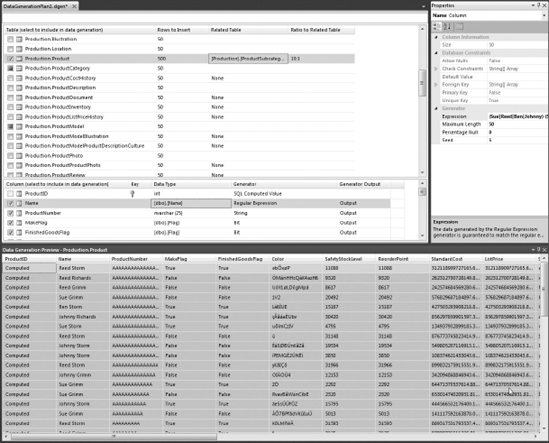
In the plan, you can select the ratio between Related Columns; for example, in Figure 55-12 we are specifying to have 10 products for each subcategory (10:1).
In the Column Details window, all columns are selected except for the ProductID, which is an identity column. You can deselect columns as long as they have either a Default value or allow nulls. In the properties window you can specify the percentage of nulls to be generated.
For each column, you can also specify the type of generator to use. By default a generator will be selected depending on the data type, or in case a column is a foreign key, the values will come from the related table's primary keys. You can use other generators. In the example in Figure 55-12, for the Name on the Products table we used a regular expression to mix first names and last names. Another option would be to use a Data Bound Generator. In that case, you would need to specify a connection string and a select query to get the values to insert. You could also create a Custom Generator and implement your own logic simply by implementing a base class and registering your assembly as a Customer Generator. For more information see "Creating Custom Generators" on MSDN.
To run the Data Generation Plan, simply select Generate Data from the Data
Chapter 8 introduced the topic of refactoring for normal .NET code. For databases you have only three refactoring tasks: Rename, Move Schema, and Fully-Qualify Names. You can rename tables, columns, stored procedures, constraints, and indexes, as well as other database objects. You can also rename the references to other servers or databases if a cross-database reference is used in the scripts.
To rename an object from the Schema View, right-click it and select Rename from the Refactor submenu. When renaming an object, you will see a preview of the changes as shown in Figure 55-13. In the upper pane you will see the old version, and in the lower pane you will see the new one for all the dependencies.
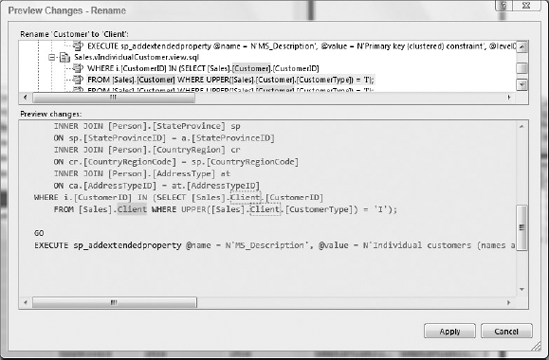
Renaming is easily done on an offline schema version, but for tables and columns it can be hard to deploy to the database. Because the old object will be dropped and re-created, this can result in data loss. If you have a Data Generation Plan, you can regenerate the data after the changes are deployed, but if you need to preserve your data you should either modify the deployment script or apply the refactoring manually. See "Protecting Data during a Renaming Operation" on MSDN for more information.
This tool enables you to compare schemas between databases or Database Projects. To use it, select New Comparison from the Data
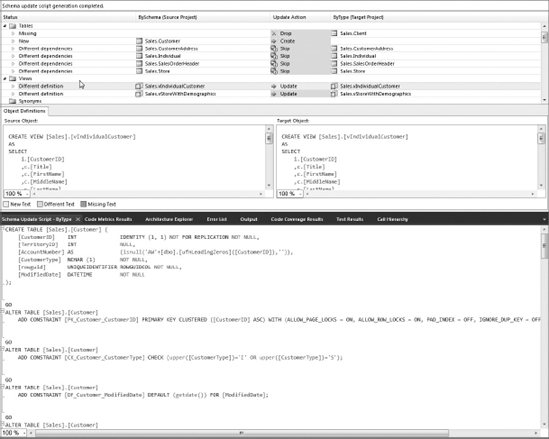
For each DB object, you can see the action that will be applied. Then from the toolbar you can either select Write Updates to apply all the changes or Export to Editor to get the SQL statements used for the update in case you need to do manual changes or hand it out to your DBA.
To customize the options for Schema Comparisons, go to Tools
Remember that if you are using a Database Project, the deploy option will write the changes from your Database Project to the database selected in the build option in the project's properties. This tool can be useful to see the changes or do manual tweaking.
This tool is useful for copying data from one database to another. Go to Data
You will be presented with all the objects selected in the last step of the wizard, but only the objects with differences will be selected. I recommend filtering the view to show only the Selected Records. From there you can check/uncheck the changes you want to apply either at a table or row level.
Figure 55-15 shows the comparison results between two versions of a simple Products database. The upper pane shows the tables and the lower pane shows the records for the selected table. The Different Records tab in the lower pane will show side by side each Source and Target column, so you can see where the differences are.
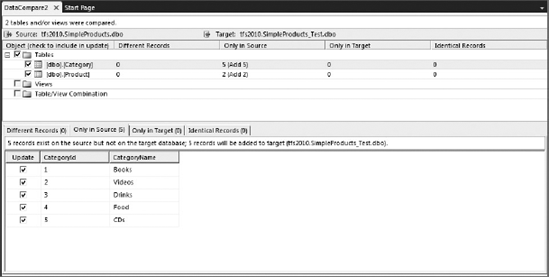
From the toolbar you can select either Write Updates or Export to Editor to manually apply the changes.
Visual Studio 2010 Premium and Ultimate include static analysis tools for databases as well as for code. To run the static analysis tools, select Data
This editor allows you to work with Transact-SQL (T-SQL) code directly in Visual Studio. To open it, you can double-click a .sql file in Solution Explorer or from the Schema View of a Database Project. Another option is to start with a blank editor — to do this go to Data
The following is a list of best practices we compiled through our work with Database Professionals and which have worked for us on small and medium-sized projects:
Each developer works with his own local SQL database instance, one for development and another for testing. This is necessary to isolate uncommitted and untested changes and avoid affecting other developers working on the database at the same time. It is strictly necessary for managed-code debugging purposes, because starting a debugging session will cause all managed threads to stop. From the project properties for Database Projects, you can specify the database to target for each Solution Configuration, but SQL-CLR projects can only target one database.
Each developer works with two databases, one for development and one for unit testing because different data will be used for each.
Use (local) or 127.0.0.1 for the hostname instead of, say, MikesComputer or 192.168.2.6, which would work only on one machine.
If you are using database instances, be sure all your developers have an instance with the same name.
All developers should have the same SQL Server version. Although SQL Server Express can be used for design-time validation and testing purposes, some features, like Text Indexing, are not supported.
Clear the Block Incremental Deployment if Data Loss Might Occur checkbox in the project properties window for the Solution Configuration used for Test Databases. Because you will have a Data Generation Plan, data will be easy to re-create after changes have been made to the schema.
When deploying to a production database, build the Database Project and then modify the build script to manually deploy it to the server. You can lean on the Schema Comparison tool to have a more granular view of the changes made.
In this chapter, you saw a couple of advanced features that are part of Visual Studio 2010 Premium. All of these target quality improvement. Code Metrics and the Analysis Tool will analyze your code or binaries statically, collecting metrics and evaluating rules. The metrics will be useful to see how maintainable your code is. For the analysis, you have rules for different categories that will help you ensure that your code will perform well before it runs. On the other hand, the Profiling Tools will evaluate your code at run time and IntelliTrace lets you explore the execution of your application during a debugging session.
This chapter covered some of the most important features for database developers. You saw how easy it is to develop code for SQL-CLR and how the Offline Schema Projects will help you work on a team, versioning and merging your changes. Advanced features like refactoring and unit testing will change the way you develop databases, and tools like Schema Compare, Data Compare, Data Generation, and the T-SQL Editor will support the process as well.