
CHAPTER 15
Decision Trees and the Value of New Information
A decision tree is a graph that represents a decision problem. It can be easily generated from a project schedule. Decision trees are used to calculate the expected value or expected utility of an alternative and, as a result, they allow you to make a rational choice. Value-of-information analysis is a process that helps determine the price someone should pay to determine the actual value of an uncertainty.
What Is a Decision Tree?
Burglars usually lack good judgment, let alone any expertise in decision analysis. Case in point: Harry and Marv, the two would-be burglars in the movie Home Alone (1990). Based on how they selected their targets, it would be safe to say that neither has a degree in decision analysis from Stanford or Duke (see figure 15-1). What kind of decision process would lead them to choose to rob a home in the Chicago suburbs when it was occupied—granted, by a young boy—if they could break into an unoccupied home nearby? It may be that they constructed a simple decision tree (figure 15-2) to help them select which home they should consider for their burglary project. (In chapter 4, if you recall, we briefly mentioned decision trees when we discussed the concept of the expected value of projects.)
Perhaps Harry and Marv used this process to develop their decision tree:
1. They identified the decision they wanted to make: choose which home they would break into.
2. They identified the criteria for the selection: Harry and Marv wanted the home to be as “loaded” as possible.
Let’s assume that three houses (1, 2, and 3 in figure 15-2) in the neighborhood met their criteria. Due to some prior “casing” of the homes, Harry and Marv knew approximately how much loot they could steal from each: House 1 = $20,000, House 2 = $10,000, and House 3 = $8,000.
Figure 15-1. Applying Decision Analysis to Make a Better Choice
3. Using this information, Harry and Marv started to construct a decision tree. First, they drew a decision node (rectangle) associated with their strategic decision—which home they would rob. From this node, they drew three branches, one for each alternative.
4. Then the two would-be robbers brainstormed to come up with the risks and uncertainties associated with each of the three homes. As it turned out, they did not anticipate any risks or uncertainties that were unique to either home 2 or home 3: the tasks were to pick the lock, locate the valuables, and grab the loot. Nice and easy work! However, they discovered that in home 1, which contained a larger amount of valuables, there was a possibility that a little boy was inside—definitely an uncertainty. So, Harry and Marv drew a circle representing an uncertainty or chance node on the decision tree. They estimated the chance that a boy was inside at 80%.
5. Even if the house were inhabited, they could still rob it. Harry and Marv believed that if the boy were present, he would be too frightened to stop them. So, they drew another circle with two branches representing the chances that the boy would be either scared or not scared.
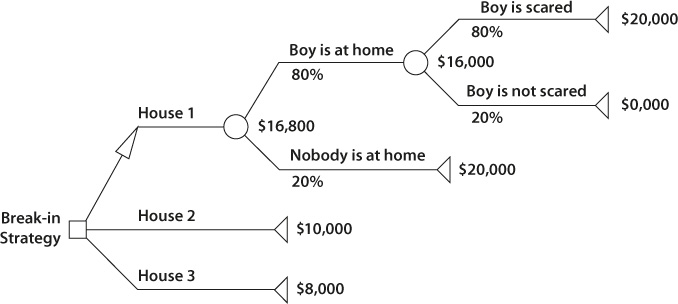
Figure 15-2. Analysis of Break-In Strategy Using a Decision Tree
6. They closed each branch with a triangular end node. Harry and Marv attached a value to each end node. If the boy was home and not scared, the value would be zero, for it would be difficult to get anything out of the home without the boy’s raising an alarm. For the other end nodes—“boy is home and scared,” “boy is not home,” “house 2,” and “house 3”—the values would be the estimated amount of loot in the home.
7. Now that they had set up their decision tree, it was time to calculate. They started calculating values from right to left. For each uncertainty node, Harry and Marv needed to calculate an expected value. The expected value for the “boy is at home” branch equals: (boy is scared) + (boy is not scared). Mathematically, it looks like this: ($20,000 × 0.8) + ($0,000 × 0.2) = $16,000. As we calculate to the left, we can see that the expected value for house 1 equals: (boy is home) + (boy is not home), or $16,000 × 0.8 + $20,000 × 0.2 = $16,800.
8. Using expected value as their criterion, the decision for Harry and Marv is now easy to see. House 1 has the highest expected value, even when taking into account the uncertainty associated with the possibility of the boy’s being in the house.
Here are a few further thoughts regarding the quality of Harry and Marv’s decision tree:
• Sometimes a number of decisions that rely on each another can be made up front. In this case, decision nodes are not confined to the beginning (on the left) of the tree, but they can be placed throughout the decision tree wherever a decision must be made. For example, Harry and Marv might have wanted to see the effect that scaring the boy out of the house would have on the expected value.
• You can incorporate risk profiles by applying a utility function to the decision tree analysis (discussed in chapter 4). Apparently, Harry and Marv, like most criminals, are risk-takers, and this risk profile could affect their choices.
• In most situations, the value associated with the end node can be calculated by using a valuation model. For example, Harry and Marv’s valuation model could include a number of parameters: house type, habitation status, and so on. It would be possible to set these parameters, and the valuation model would return a value for each node.
• As we mentioned in chapter 12, influence diagrams can be used to construct a decision tree representing the same problem.
Why Project Managers Avoid Decision Trees (and Why They Shouldn’t)
It is not only burglars who use decision trees; many honest people use them, as well. Trial lawyers (we’ll call them honest for the sake of our argument) routinely use decision trees when they try to determine their strategies—to sue or not to sue (with apologies to Shakespeare). If they sue, should they accept an out-of-court settlement or go to trial? If they go to trial, what is the chance that they will win? If they win, what is the chance that the other side will appeal? This analysis depends on the potential payout at each step and can make for a very complex decision tree.
Honest people can make other choices with a decision tree: Which product that they are developing has the greatest chance of success, given unknown market uncertainties? What movie should the studio produce, given the wide range of ideas and scripts on which they have options? Which mineral deposits should a company explore and develop first? Many companies use decision trees to make their strategic decisions. How can organizations use them for project management?
The PMBOK Guide recommends using decision trees as one of your quantitative risk tools for analyzing different project alternatives. Chapter 11 of the Guide includes an example of a simple decision tree, plus explanations for calculating a project’s expected value. Although a great deal of information about decision trees is available, the actual use of this tool in project management remains limited. We think there are a number of reasons:
• If a project is relatively small, most project managers believe that they can make a choice intuitively and don’t need to use a sophisticated analysis tools like a decision tree. In these cases, project managers have made an assumption that is not necessarily true—that the size of a project and the number of potential choices in it are positively related. In reality, a small project may have many alternatives that require a sophisticated analysis.
• If a project is large and complex, like the construction of a highway, project managers prefer to delegate the decision analysis to a business analyst in the strategic planning department, or to hire a consultant.
It is important to remember that as soon as you have to make a decision that depends upon other decisions, it is not trivial, and that a purely intuitive solution may lead to mistakes. In these cases, decision trees will help you to make the right decision.
Here is another observation related to the use of decision trees in organizations: as with all quantitative methods in project decision analysis, decision trees rely on the valuation model of the project. In most cases, project managers do not create a valuation model specifically for a decision tree analysis; they already have too many other issues to worry about. But if they already have this model, which in many cases is the project schedule, it is easy to convert the model into a decision tree using available software tools (see appendix A). With this in mind, project managers should not have any reasons—excuses, maybe—not to use decision tree analysis for small and medium-sized projects, since the process provides a great deal of value for a little additional effort. Let’s see how this conversion works.
Converting Project Schedules into Decision Trees
Let’s assume that your project schedule includes several alternatives (figure 15-3). If one project scenario depends on another scenario, the number of potential alternatives can be substantial. It is always easier to use one project schedule for multiple alternatives than to create separate schedules. Value measures for a project schedule can be cost or duration.
Here is how the conversion from a project schedule to a decision tree works:
First, create a project schedule that contains alternative scenarios. These can be represented by different parallel paths through the schedule. Different paths of a project schedule are the result of branching when a predecessor activity has more than one successor activity.
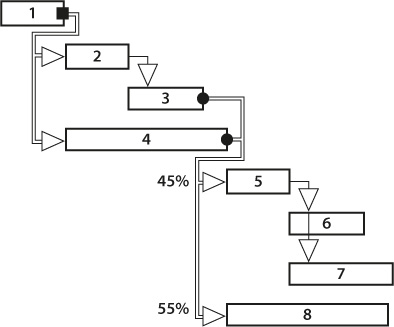
Figure 15-3. Project Schedule to Be Converted to a Decision Tree
1. Some activities are performed in parallel. (In our Home Alone scenario, Harry is looking for cash in the bedroom, while Marv is collecting electronics from the family room.)
2. Different scenarios apply. (Either both Harry and Marv start with family room, or they go to separate bedrooms.)
To distinguish between these two types of paths, they need to be visualized differently on a Gantt chart. We recommend using double lines and horizontal arrows for alternative paths versus single lines, and also vertical arrows for parallel activities. In our example, a double line connects task 1 with task 2 and task 4. This represents that tasks 2 and 4, with all their successors, are alternative scenarios.
Activities can have alternative successors, for two reasons:
1. A decision must be made. The solid square at the end of the predecessor indicates that a decision is being made (see task 1 in figure 15-3).
2. The activity has uncertainties associated with it. The solid circle at the end of an activity indicates that there is an uncertainty (see tasks 3 and 4) and the need to specify a probability associated with each branch (in our example, we have assigned probabilities of 45% and 55% for the branches after tasks 3 and 4).
After you have entered all the information to construct a decision tree, perform separate network calculations (a forward path in the critical path method) for each alternative. The end nodes of the decision tree represent the cost or duration of each alternative; branches represent tasks or group of tasks.
In practice, of course, project schedules can be large and complex. To prevent the decision tree from becoming too large and unmanageable, a schedule consolidation algorithm can be applied. With this algorithm, the cost and duration of all activities between the decision and uncertainties nodes are calculated separately and represented as one branch of the tree.
Figure 15-4 shows the results of converting a schedule to a decision tree. Even if you don’t go as far as converting your schedule to a decision tree, this approach can be beneficial since it enables you to visualize decisions and uncertainties on any Gantt chart. This provides a useful tool for discussing various project scenarios and the probabilities that they will occur.
The Value of Perfect Information
Here is an anecdotal story that we came across:
At a chemical plant, a huge reactor had broken down, and nobody knew the exact reason for the failure. To understand what went wrong, management had two choices: disassemble a major section of the reactor, or examine many little sections of the reactor one at a time. In either scenario, it would cost millions of dollars, because of the lengthy downtime. So, before starting the investigation, the project management team invited a guru (translation: a consultant), hoping that he could pinpoint the cause of the breakdown faster.
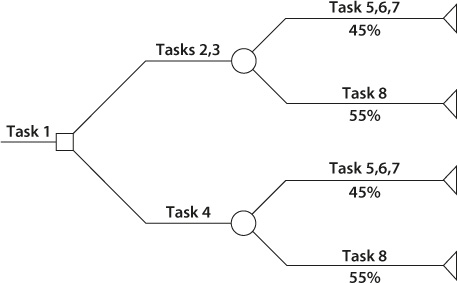
Figure 15-4. Results of a Schedule-to-Decision Tree Conversion
The guru walked around the reactor a couple of times and soon became interested in a particular section of it. He pulled out a small hammer, tapped lightly on the reactor, and listened intently. After a few more minutes of tapping and listening, the guru turned around and said, “Cut a small opening here and replace the pipe.” A supervisor quickly put some workers on the task, although he was skeptical and thought the whole process a bit odd. (But remember the first rule: never question a guru!) Much to the astonishment of the supervisor and the rest of the management team, this almost miraculous fix had the reactor up and running at full capacity the very same day. The plant manager was extremely happy. “What is this going to cost me?” he asked the guru. “One million dollars,” the guru replied.
The manager protested: “One million dollars for hitting the reactor with small hammer?” “No, hitting the reactor only costs you one dollar. The other $999,999 is for saving you at least triple the amount that you would have spent if you had gone ahead with your original plans,” answered the guru.
The guru had calculated the value of the information he provided, which was the amount of money that was saved through his investigation. His concept of the value of information is extremely important in project management, especially when answering questions such as these:
• Should you spend the time and money to create a prototype of a new device?
• Should you perform additional testing of a software or hardware component to ensure its reliability?
• Should you buy new software to perform a more detailed analysis?
• Should you hire a consultant to solve a complex problem?
Here is how the value of information is calculated. Harry and Marv want to break into a house, but do not know exactly how much money is inside. It can be a “loaded home” worth $20,000 (80% probability) or worth nothing (20% probability). For the other houses, Harry and Marv already know with 100% certainty that they would take $10,000 from house 2.
Recognizing the uncertainty around the target home, Harry and Marv decided to get additional information. If you saw Home Alone (spoiler alert!), you will remember that Harry visited the homes before Christmas, dressed as a police officer. But before he did this, they needed to estimate whether it made sense to get this information. First, Harry needed to procure a police uniform; in addition, visiting the homes impersonating a police officer could increase the chance that they would be discovered. So, Harry and Marv constructed the decision tree shown in figure 15-5. They had three alternatives:
1. Break into house 1. Expected value will be $0,000 × 0.2 + $20,000 × 0.8 = $16,000.
2. Break into house 2. They know for sure that they can get $10,000.
3. Get additional information about house 1.
If Harry goes to house 1 and acquires the additional information, he may find that the probabilities are 80% “loaded” and 20% nothing. If the first house has nothing, it would be wise to break into the second house instead and get a certain $10,000. If the first house is loaded, they should rob that house. This logic is represented by the third branch, “Obtain new information.” The expected value of this alternative is $10,000 × 0.2 + $20,000 × 0.8 = $18,000, or $2,000 more than the first alternative ($16,000). As a result, the expected value of information is $18,000—$16,000 = $2,000. Now Harry can use this number to decide whether the risks of procuring (buying or stealing) a police uniform and visiting the houses is worth the additional $2,000 in potential benefit.
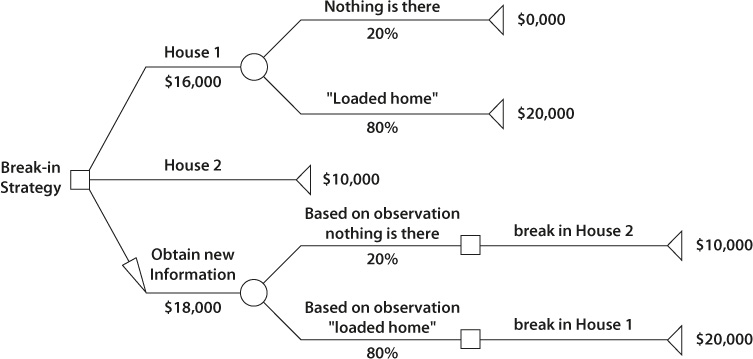
Figure 15-5. Analysis of Value of Perfect Information for Break-In Strategy
The Value of Imperfect Information
This value-of-information analysis has one significant stipulation: Harry and Marv assume that the information Harry received is perfect. In other words, the burglars assume that Harry’s observations are absolutely reliable. In reality, his assessments will not be absolutely accurate. There will be some things he could not see, and others that he will have difficulty evaluating. In other words, there is a probability that Harry’s assessment is inaccurate.
The value of new imperfect information can be analyzed using the Bayes theorem, which is a formula that revises probabilities based on new information.
Decision theory offers methods to incorporate imperfect information into the analysis and calculate an expected value for it. If the probability of event A is conditional on event B, it is generally different from the probability of event B when it is conditional on event A. The Bayes theorem, which we discussed in chapter 1, actually defines this relationship. The Bayes theorem is a formula that revises probabilities, based on new information.
You should be skeptical if an expert or consultant tells you that the Bayes theorem is a straightforward concept. The formula itself is really quite simple; however, the explanation and actual application of the formula have been known to cause some confusion. Therefore, we have not included the formula in this book. You may find the actual formula in most of the books on decision analysis mentioned in the Future Reading section. If you want to calculate the value of imperfect information for your project, you can find software tools that will do this for you in appendix A.