11
Measuring Return on Investment on Project Management Training Dollars
11.0 INTRODUCTION
For almost three decades, the 1960s through the 1980s, the growth and acceptance of project management were restricted to the aerospace, defense, and heavy construction industries. In virtually all other industries, project management was nice to have but not a necessity. Very few project management training programs were offered in the public marketplace, and those that were offered covered the basics of project management with weak attempts to customize the material to a specific company. The concept of measuring the return on investment (ROI) on training, at least in project management courses, was nonexistent. More recently, however, several studies have quantified the benefits of project management and there has been some pioneering work on the benefits of project management training.1 There is still a great deal of effort needed, but at least we have recognized the need.
Today, our view of project management education has changed and so has our desire to evaluate ROI on project management training funds. There are several reasons for this:
- Executives realize that training is a basic necessity for companies to grow.
- Employees want training for professional growth and advancement opportunities.
- Project management is now viewed as a profession rather than a part-time occupation.
- The importance of becoming a PMP® credential holder2 has been increasing.
- There are numerous university programs available leading to MS, MBA, and PhD degrees in project management.
- There are certificate programs in various project management concepts, such as risk management and program management.
- The pressure to maintain corporate profitability has increased, resulting in less money available for training. Yet more and more training funds are being requested by the workers who desire to become PMP® credential holders and then must accumulate 60 professional development units (PDUs) every three years to remain certified.
- Management realizes that a significant portion of training budgets must be allocated to project management education, but it should be allocated for those courses that provide the company with the greatest ROI. The concept of educational ROI is now upon us.
11.1 PROJECT MANAGEMENT BENEFITS
In the early years of project management, primarily in the aerospace and defense industries, studies were done to determine the benefits of project management. In a study by Middleton, the benefits discovered were:
- Better control of projects
- Better customer relations
- Shorter product development time
- Lower program costs
- Improved quality and reliability
- Higher profit margins
- Better control over program security
- Improved coordination among company divisions doing work on the project
- Higher morale and better mission orientation for employees working on the project
- Accelerated development of managers due to breadth of project responsibilities
These benefits were identified by Middleton through surveys and were subjective in nature. No attempt was made to quantify the benefits. At that time, there existed virtually no project management training programs. On-the-job training was the preferred method of learning project management, and most people learned from their own mistakes rather than from the mistakes of others.
Today the benefits identified by Middleton still apply, and we have added other benefits to the list:
- Accomplishing more work in less time and with few resources
- More efficient and more effective performance
- Increase in business due to customer satisfaction
- Potential for a long-term partnership relationship with customers
- Better control of scope changes
Executives wanted all of the benefits described here, and they wanted the benefits yesterday. It is true that these benefits could be obtained just by using on-the-job training efforts, but this assumed that time was a luxury rather than a constraint. Furthermore, executives wanted workers to learn from the mistakes of others rather than their own mistakes. Also, executives wanted everyone in project management to look for continuous improvement efforts rather than just an occasional best practice.
Not every project management training program focuses on all of these benefits. Some courses focus on one particular benefit while others might focus on a group of benefits. Deciding which benefits you desire is essential in selecting a training course. And if the benefits can be quantified after training is completed, then executives can maximize their ROI on project management training dollars by selecting the proper training organizations.
11.2 GROWTH OF ROI MODELING
In the past 10 years, the global expansion of ROI modeling has taken hold. The American Society for Training and Development has performed studies on ROI modeling.4 Throughout the world, professional associations are conducting seminars, workshops, and conferences dedicated to ROI on training.
According to the 2001 Training’s annual report, more than $66 billion was spent on training in 2001. It is therefore little wonder that management treats training with a business mind-set, thus justifying the use of ROI measurement. But despite all of the worldwide commitment and documented successes, there is still a very real fear in many companies preventing the use of ROI modeling. Typical arguments are: “It doesn’t apply to us”; “We cannot evaluate the benefits quantitatively”; “We don’t need it”; “The results are meaningless”; “It costs too much.” These fears create barriers to the implementation of ROI techniques, but most barriers are myths that can be overcome.
In most companies, human resources development (HRD) maintains the lead role in overcoming these fears and performing the ROI studies. The cost of performing these studies on a continuous basis could be as much as 4 to 5 percent of the HRD budget. Some HRD organizations have trouble justifying this expense. And to make matters worse, HRD personnel may have a poor understanding of project management.
The salvation in overcoming these fears and designing proper project management training programs could very well be the project management office (PMO). Since the PMO has become the guardian of all project management intellectual property as well as designing project management training courses, the PMO will most likely take the lead role in calculating ROI on project management–related training courses. Members of the PMO might be required to become certified in educational ROI measurement the same way that they are certified as a PMP® credential holder or Six Sigma Black Belt.
Another reason for using the PMO is because of the enterprise project management (EPM) methodology. EPM is the integration of various processes, such as total quality management, concurrent engineering, continuous improvement, risk management, and scope change control, into one project management methodology that is utilized on a company-wide basis. Each of these processes has measurable output that previously may not have been tracked or reported, which has placed additional pressure on the PMO and project management education to develop the necessary metrics and measurements for success.
11.3 THE ROI MODEL
Any model used must provide a systematic approach to calculating ROI. It should be prepared on a life-cycle basis or step-by-step approach similar to an EPM methodology. Just as with EPM, there are essential criteria that must exist for any model to work effectively.
Because certain criteria are considered essential, any ROI methodology should meet the vast majority of, if not all, criteria. The bad news is that generally most ROI processes do not meet all of these criteria. A typical model is shown in Figure 11-1. The definitions of the levels in Figure 11-1 are shown in Table 11-1.

Figure 11-1 The ROI model.
Source: Adapted from J. J. Phillips, Return on Investment in Training and Performance Improvement Programs, 2nd ed. (Burlington, MA: Butterworth-Heinemann, 2003), p.37.
TABLE 11-1 DEFINING LEVELS
| Level | Description |
| 1: Reaction/satisfaction | Measures the participants’ reaction to the program and possibly creates an action plan for implementation of the ideas |
| 2: Learning | Measures specific skills, knowledge, or attitude changes |
| 3: Application | Measures changes in work habit or on-the-job performance as well as application and implementation of knowledge learned |
| 4: Business impact | Measures the impact on the business as a result of implementation of changes |
| 5: Return on investment | Compares monetary benefits with the cost of the training and expressed as a percentage |
11.4 PLANNING LIFE-CYCLE PHASE
The first life-cycle phase in the ROI model is the development of evaluation plans and baseline data. The evaluation plan is similar to some of the PMBOK® Guide5 knowledge areas that require a plan as part of the first process step in each knowledge area. The evaluation plan should identify:
- The objective(s) of the program
- The way(s) the objective(s) will be validated
- The target audience
- Assumptions and constraints
- The timing of the program
Objectives for the training program must be clearly defined before ROI modeling can be completed. Table 11-2 identifies typical objectives. The objectives must be clearly defined for each of the five levels of the model. Column 3 in the table would be representative of the objectives that a company might have when it registers a participant in a Project Management Certificate Program (PMCP) training course. In this example, the company funding the participant’s training might expect the participant to become a PMP® credential holder and then assist the organization in developing an EPM methodology based on the PMBOK® Guide with the expectation that this would lead to customer satisfaction and more business. Column 4 in Table 11-2 might be representative of a company that registers a participant in a course on best practices in project management. Some companies believe that if a seminar participant walks away from a training program with two good ideas for each day of the program and if these ideas can be implemented reasonably fast, then the seminar is considered a success. In this example, the objectives are to identify best practices in project management that other companies are doing and that can be implemented effectively in the participant’s company.
TABLE 11-2 TYPICAL PROGRAM OBJECTIVES
| Objectives | |||
| Level | Description | Typical PMCP Training | Typical Best Practices Training Course |
| 1 | Reaction/satisfaction | Understand principles of PMBOK® Guide | Understand that companies are documenting their best practices |
| 2 | Learning | Demonstrate skills or knowledge in domain groups and knowledge areas | Demonstrate how best practices benefit an organization |
| 3 | Application | Development of EPM processes based on the PMBOK® Guide | Develop a best practices library or ways to capture best practices |
| 4 | Business impact | Measurement of customer and user satisfaction with EPM | Determine the time and/or cost savings from a best practice |
| 5 | Return on investment | Amount of business or customer satisfaction generated from EPM | Measure ROI for each best practice implemented |
There can be differences in training objectives, as seen through the eyes of management. As an example, looking at columns 3 and 4 in Table 11-2, objectives might be:
- Learn skills that can be applied immediately to the job. In this case, ROI can be measured quickly. This might be representative of the PMCP course in column 3.
- Learn about techniques and advancements. In this case, additional money must be spent to achieve these benefits. ROI measurement may not be meaningful until after the techniques have been implemented. This might be representative of the best practices course in column 4.
- A combination of the above.
11.5 DATA COLLECTION LIFE-CYCLE PHASE
In order to validate that each level’s objectives for the training course were achieved, data must be collected and processed. Levels 1 to 4 in Figure 11-1 make up the data collection life-cycle phase.
To understand the data collection methods, we revisit the course on best practices in project management, which covers best practices implemented by various companies worldwide. The following assumptions will be made:
- Participants are attending the course to bring back to their company at least two ideas that can be implemented in their company within six months.
- Collecting PDUs is a secondary benefit.
- The course length is two days7
Typical data collection approaches are shown in Table 11-3 and explained below for each level.
TABLE 11-3 DATA COLLECTION
| Level | Measures | Data Collection Methods and Instruments | Data Sources | Timing | Responsible Person |
| Reaction/ satisfaction | A 1–7 rating on end-of-course critique | Questionnaire | Participant (last day of program) | End of program | Instructor |
| Learning | Pretest, posttest, online courses, and case studies | In-class tests and skill practice sets | Instructor | Each day of course | Instructor |
| Application | Classroom discussion | Follow-up session or questionnaire | Participant and/or PMO | Three months after program 11:11-tfoot-0001 | PMO |
| Business impact | Measurement of EPM continuous improvement efforts | Benefit–cost monitoring by the PMO | PMO records | Six months after program | PMO |
| Return on investment | Benefit–cost ratios | PMO studies | PMO records | Six months after program | PMO |
aUsually for in-house program only. For public seminars, this may be done by the PMO within a week after completion of training.
Level 1: Reaction and Satisfaction
Level 1 measures the participant’s reaction to the program and possibly an action plan for implementation of the ideas. The measurement for level 1 is usually an end-of-course questionnaire where the participant rates the information presented, quality of instruction, instructional material, and other such topics on a scale of 1 to 7. All too often, the questionnaire is answered based on the instructor’s presentation skills rather than the quality of the information. While this method is most common and often serves as an indication of customer satisfaction hopefully leading to repeat business, it is not a guarantee that new skills or knowledge have been learned.
Level 2: Learning
This level measures specific skills, knowledge, or attitude changes learned during the course. Instructors use a variety of techniques for training, including:
- Lectures
- Lectures/discussions
- Exams
- Case studies (external firms)
- Case studies (internal projects)
- Simulation/role playing
- Combinations
For each training technique, a measurement method must be established. Some trainers provide a pretest at the beginning of the course and a posttest at the end. The difference in scores is usually representative of the amount of learning that has taken place. This is usually accomplished for in-house training programs rather than public seminars. Care must be taken in the use of pretests and posttests. Sometimes a posttest is made relatively easy for the purpose of making it appear that learning has taken place. Out-of-class testing can also be accomplished using take-home case studies and online questions and exams.
Testing is necessary to validate that learning has taken place and knowledge has been absorbed. However, simply because learning has taken place is no guarantee that the information learned on best practices can or will be transferred to the company. The learning might simply confirm that the company is doing well and keeping up with the competitors.
Level 3: Application of Knowledge
This level measures changes in work habits or on-the-job performance as well as implementation of knowledge learned. Measurement at this level is normally done through follow-up sessions or follow-up questionnaires. However, for publicly offered courses with a large number of participants, it is impossible for the instructor to follow up with all participants. In such cases, the responsibility falls on the shoulders of the PMO. Participants may be required to prepare a short one- or two-page report on what they learned in the course and what best practices are applicable to the company. The report is submitted to the PMO that might have the final decision on the implementation of the ideas. Based on the magnitude of the best practices ideas, the portfolio management of projects may be impacted. However, there is no guarantee at this point that there will be a positive impact on the business.
Level 4: Business Impact
This level measures the impact on the business as a result of implementation of the changes. Typical measurement areas are shown in Figure 11-2.
![Diagram shows triangle with labels for mission, customer satisfaction, business opportunity, functional support, methodology, executive support, time, cost, quality, scope, and performance analysis, and markings for project measures, business units [future].](http://images-20200215.ebookreading.net/5/2/2/9781119468851/9781119468851__project-management-best__9781119468851__images__c11f002.jpg)
Figure 11-2 Postmortem pyramid.
Source: From H. Kerzner, Advanced Project Management: Best Practices in Implementation, 2nd ed. (Hoboken, NJ: Wiley, 2004, p. 302.
The critical terms in Figure 11-2 are:
- Critical success factor (CSF). This measures changes in the output of the project resulting from implementation of best practices. Hopefully, this will lead to improvements in time, cost, quality, and scope.
- Key performance indicator (KPI). This measures changes in the use of the EPM system and support received from functional management and senior management.
- Business unit impact. This is measured by customer satisfaction as a result of the implementation of best practices and/or future business opportunities.
The measurement at level 4 is usually accomplished by the PMO. There are three reasons for this:
- The information may be company sensitive and not available to the instructor.
- Since there may be a long time span between training and the implementation of best practices, the instructor may not be available for support.
- The company may not want anyone outside of the company talking to its customers about customer satisfaction.
Although the implementation of best practices may have a favorable business impact, care must be taken that the implementation was cost effective.
As shown in Figure 11-1, an important input into level 4 is isolate the effects of training. It is often impossible to clearly identify the business impact that results directly from the training program. The problem is that people learn project management from multiple sources, including:
- Formal education
- Knowledge transfer from colleagues
- On-the-job experience
- Internal research on continuous improvements
- Benchmarking
Because of the difficulty in isolating the specific knowledge, this step is often overlooked.
11.6 DATA ANALYSIS LIFE-CYCLE PHASE
In order to calculate the ROI, the business impact data from level 4 must be converted to a monetary value. The information can come from interviews with employees and managers, databases, subject matter experts, and historical data. Very rarely will all of the information needed come from one source.
Another input required for data analysis is the cost of the training program. Typical costs that should be considered include:
- Cost of course design and development
- Cost of materials
- Cost of the facilitator(s)
- Cost of facilities and meals during training
- Costs of travel, meals, and lodgings for each participant
- Fully burdened salaries of participants
- Administrative or overhead cost related to the training course or approach of participants to attend training
- Possible cost (loss of income) of not having the participants available for other work during the time of training
Not all benefits can be converted to monetary values. This is the reason for the “identify intangible benefits” box in Figure 11-1. Some business impact benefits that are easily converted to monetary values include:
- Shorter product development time
- Faster, higher-quality decisions
- Lower costs
- Higher profit margins
- Fewer resources needed
- Reduction in paperwork
- Improved quality and reliability
- Lower turnover of personnel
- Quicker implementation of best practices
Typical benefits that are intangible and cannot readily be converted to monetary value include:
- Better visibility and focus on results
- Better coordination
- Higher morale
- Accelerated development of managers
- Better project control
- Better customer relations
- Better functional support
- Fewer conflicts requiring some management support
Despite the fact that these benefits may be intangible, every attempt should be made to assign monetary values of these benefits.
Level 5: Return on Investment
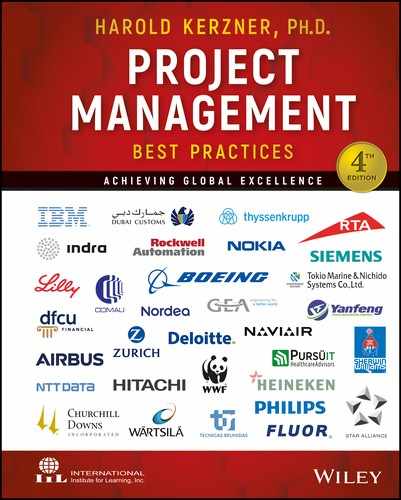
Two formulas are required for completion of level 5. The first formula is the benefit cost ration (BCR), which can be formulated as
The second formula is the ROI expressed as a percentage. The formula is based on “net” program benefits, which are the benefits minus the cost. Mathematically, we can describe it as
To illustrate the usefulness of this level, we consider three examples all based on the same training course. You attend a two-day seminar on best practices in project management. Your company’s cost for attending the course is:
| Registration fee | $ 475 |
| Release time (16 hr at $100/hr) | 1,600 |
| Travel expenses | 800 |
| $2,875 |
When the seminar is completed, you come away with three best practices to recommend to your company. Your company likes all three ideas and assigns you as the project manager to implement all three best practices. Additional funds must be spent to achieve the benefits desired.
Example 1
During the seminar, you discover that many companies have adopted the concept of paperless project management by implementing a traffic light status reporting system. Your company already has a web-based EPM system, but you have been preparing paper reports for status review meetings. Now every status review meeting will be conducted as paperless PowerPoint presentation displaying the web-based methodology with a traffic light display beside each work package in the work breakdown structure.
The cost of developing the traffic light system is:
| Systems programming (240 hr at $100/hr) | $24,000 |
| Project management (150 hr at $100/hr) | 15,000 |
| $39,000 |
The benefits expressed by monetary terms are:
- Executive time in project review meeting (20 hr/ project to 10 hr/ project × 15 projects × 5 executives per meeting × $250/hr): $187,500
- Paperwork preparation time reduction (60 hr/project × 15 projects × $100/hr): $90,000
- Total additional benefit is therefore $275,500:

This means that for every dollar invested in the training program, there was a return of $8,109 in net benefits! In this example, it was assumed that workers were fully burdened at $100/hr and executives at $250/hr. The benefits were one-year measurements, and the cost of developing the traffic light system was not amortized but expensed against the yearly benefits.
Not all training programs generate benefits of this magnitude. Lear in Dearborn, Michigan, has a project management traffic light reporting system as part of its web-based EPM system. Lear has shown that in the same amount of time that it would review the status of one project using paper, it can review the status of all projects using traffic light reporting.
Example 2
During the training program, you discover that other companies are using templates for project approval and initiation. The templates are provided to you during the training program, and it takes very little effort to make the templates part of the EPM system and inform everyone about the update. The new templates will eliminate at least one meeting per week at a savings of $550:

In this example, for each $1 invested in the best practices program, a net benefit of $8.56 was recognized.
Example 3
During the training program, you learn that companies are extending their EPM systems to become more compatible with systems utilized by their customers. This should foster better customer satisfaction. The cost of updating your EPM system to account for diversified customer report generators will be about $100,000.
After the report generator is installed, one of your customers with whom you have four projects per year informs you that it is so pleased with this change that it will now give you sole-source procurement contracts. This will result in a significant savings in procurement costs. Your company typically spends $30,000 preparing proposals:
In this case, for every dollar invested in the best practices program, there was a net benefit of $5.96 received.
To date, there have been very few attempts to measure ROI specifically on project management education other than work done by Phillips. However, there have been some successes. In an insurance company, a $100 million project was undertaken. All employees were required to undergo project management training prior to working on the project. The project was completed 3 percent ($3 million) below budget.
Unsure of whether the $3 million savings was due to better project management education or poor initial estimating, the company performed a study on all projects where the employees were trained on project management prior to working on project teams. The result was an astounding 700 percent return on training dollars.
In another organization, the HRD people worked with project management to develop a computer-based project management training program. The initial results indicated a 900 percent ROI. The workers took the course on their own time rather than company time. Perhaps this is an indication of the benefits of e-learning programs. The e-learning programs may produce a much higher ROI than traditional courses because the cost of the course is significantly reduced with the elimination of the cost of release time.
11.7 REPORTING LIFE-CYCLE PHASE
The final life-cycle phase in Figure 11-1 is reporting. The acceptance of the results could very well be based on how the report is prepared. The report must be self-explanatory to all target groups. If assumptions are made concerning costs or benefits, then they must be justified. If the ROI numbers are inflated to make a training program look better than it was, then people may be skeptical and refuse to accept the results of future ROI studies. All results should be factual and supported by realistic data.
11.8 CONCLUSIONS
Because of the quantity and depth of available project management training programs, the concept of measuring ROI on training dollars can be expected to grow. Executives will recognize the benefits of this approach and its application to project management the same way it is applied to other training programs. Project management training organizations will be required to demonstrate expertise in ROI analysis. Eventually, PMI might even establish a special investigation group on ROI measurement.