19
Benefits Realization and Value Management
19.0 INTRODUCTION
Organizations in both the public and private sectors have been struggling with the creation of a portfolio of projects that would provide sustainable business value. All too often, companies add all project requests to the queue for delivery without proper evaluation and with little regard if the projects were aligned with business objectives or provided benefits and value upon successful completion. Projects were often submitted without any accompanying business case or alignment to business strategy. Many projects had accompanying business cases that were based on highly exaggerated expectations and unrealistic benefits. Other projects were created because of the whims of management, and the order in which the projects were completed was based on the rank or title of the requestor. Simply because an executive says “Get it done” does not mean it will happen. The result was often project failure, a waste of precious resources, and, in some cases, business value was eroded or destroyed rather than created.
19.1 UNDERSTANDING THE TERMINOLOGY
It is important to understand the definitions of benefits and value.
A benefit is an outcome from actions, behaviors, products, or services that is important or advantageous to specific individuals, such as business owners, or to specific groups of individuals, such as stakeholders. Generic benefits might include:
- Improvements in quality, productivity or efficiency
- Cost avoidance or cost reduction
- Increase in revenue generation
- Improvements in customer service
Benefits are derived from the goals of strategic planning activities. In the past, traditional business goals were customer satisfaction, cost reduction, and profits and they focused on near-term targeted savings and deliverables rather than long-term benefits. As such, too much emphasis was placed on the outcome of projects, which on their own may not necessarily deliver long-term benefits. Today, strategic goals and objectives seem to focus on:
- Productivity
- Efficiency
- Performance improvements
- Quality
- Customer service
- Rework
- Cost avoidance
- Revenue generation
Benefits, whether they are strategic or nonstrategic, are normally aligned to the organizational business objectives of the sponsoring organization that will eventually receive the benefits. The benefits appear by harvesting the deliverables or outputs that are created by the project. It is the responsibility of the project manager to create the deliverables.
Benefits are identified in the project’s business case. Some benefits are tangible and can be quantified. Other benefits, such as an improvement in employee morale, may be difficult to measure and therefore may be treated as intangible benefits. Intangibles may be tough to measure, but they are not immeasurable. Some tough benefits to measure include:
- Collaboration
- Commitment
- Creativity
- Culture
- Customer satisfaction
- Emotional maturity
- Employee morale
- Image/reputation
- Leadership effectiveness
- Motivation
- Quality of life
- Stress level
- Sustainability
- Teamwork
There can also be dependencies between the benefits where one benefit is dependent on the outcome of another. As an example, a desired improvement in revenue generation may be dependent on an improvement in quality or better marketing is needed to attract more tourists.
When scoping out a project, we must agree on the organizational outcomes or benefits we want, and they must be able to be expressed in measurable terms. This is necessary because improvements are usually expressed in financial terms to justify the investment in the business. Typical generic benefits metrics might include:
- Increase in market share
- Reduction in operating costs
- Reduction in waste
- Increase in profitability
- Improvements in productivity and efficiency
- Increase in quality
- Increase in customer satisfaction
- Improvement in employee morale
- Increase in employee retention and reduction in employee turnover
The metrics are needed for feedback to revalidate performance, measure success, investigate anomalies, and decide if health checks are needed.
Benefits realization management (BRM) is a collection of processes, principles, and deliverables to effectively manage the organization’s investments and to make the benefits happen.1 Project management is the vehicle for producing the outcomes that create benefits delivery. Project management focuses on maintaining the established baselines whereas BRM analyzes the relationship that the project has to the business objectives by monitoring for potential waste, acceptable levels of resources, risk, cost, quality and time as it relates to the desired benefits. The ultimate goal of BRM is not merely to achieve the benefits but to sustain them over the long term.
Organizations that are reasonably mature at BRM:
- Enjoy better business/strategic outcomes
- Have a much closer alignment of strategic planning, portfolio management, BRM, and business value management
- Use project management successfully as the driver or framework for BRM
- Capture best practices in the BRM activities
Decision makers must understand that, over the life cycle of a project, circumstances can change, requiring modification of the requirements, shifting of priorities, and redefinition of the desired outcomes. It is entirely possible that the benefits can change to a point where the outcome of the project provides detrimental results and the project should be canceled or backlogged for consideration at a later time. Some of the factors that can induce changes in the benefits and resulting value include:
- Changes in business owner or executive leadership. Over the life of a project, there can be a change in leadership. Executives who originally crafted the project may have passed it along to others who have a tough time understanding the benefits, are unwilling to provide the same level of commitment, or see other projects as providing more important benefits.
- Changes in assumptions. Based on the length of the project, the assumptions can and most likely will change, especially those related to enterprise environmental factors. Tracking metrics must be established to make sure that the original or changing assumptions are still aligned with the expected benefits.
- Changes in enterprise environmental factors. Changes in market conditions (i.e., markets served and consumer behavior) or risks can induce changes in the constraints. Legislation and elections can also impact the enterprise environmental factors. Companies may approve scope changes to take advantage of additional opportunities or reduce funding based on cash flow restrictions. Metrics must also track for changes in the constraints and the enterprise environmental factors.
- Changes in resource availability. The availability or loss of resources with the necessary critical skills is always an issue and can impact benefits if a breakthrough in technology is needed to achieve the benefits or to find a better technical approach with less risk.
Project value is what the benefits are worth to someone. Project or business value can be quantified whereas benefits are usually explained qualitatively. When we say that the return on investment (ROI) should improve, we are discussing benefits. But when we say that the ROI should improve by 20 percent, we are discussing value. Progress toward value generation is easier to measure than progress toward benefits realization, especially during project execution. Benefits and value are generally inseparable; it is difficult to discuss one without the other.
19.2 REDEFINING PROJECT SUCCESS
For more than five decades, we have erroneously tried to define project success in terms of only the triple constraints of time, cost, and scope. We knew decades ago that other metrics should be included in the definition, such as value, safety, risk, and customer satisfaction, and that these were attributes of success. Unfortunately, our knowledge of metrics measurement techniques was just in the infancy stage at that time, and we selected only those metrics that were the easiest to measure and report: time, cost, and scope.
For decades, we defined value as:
If we wanted to increase the perceived value, we had to either increase the quality or lower the cost. This equation unfortunately implied that quality and cost are the only components of value.
Today, metric measurement techniques are maturing to the point where we believe that we can measure just about anything.2 Perhaps the greatest level of research has been in measuring and reporting business value. During the past two decades, research has been conducted in the following areas:
- Value dynamics
- Value gap analysis
- Intellectual capital valuation
- Human capital valuation
- Economic value-based analysis
- Intangible value streams
- Customer value management/mapping
- Competitive value matrix
- Value chain analysis
- Valuation of information technology projects
The output of the research has created value measurement models and metrics:
- Intellectual capital valuation
- Intellectual property scoring
- Balanced scorecard
- Future Value ManagementTM
- Intellectual Capital RatingTM
- Intangible value stream modeling
- Inclusive Value MeasurementTM
- Value measurement methodology (VMM)
Value could very well become the most important word in the project manager’s vocabulary, especially in the way that we define project success. In the glossary to the fifth edition of the PMBOK®Guide3, a project is defined as a temporary endeavor undertaken to create a unique product, service, or result. The problem with this definition is that the unique product, service, or result might not create any business value after the project is completed. Perhaps a better definition of a project might be:
- A collection of sustainable business value scheduled for realization
The definition of project success has almost always been the completion of a project within the triple constraints of time, cost, and scope. This definition likewise must change because it lacks the word “value,” and it does not account for the fact that today we have significantly more than three constraints, which refer to as competing constraints. Therefore, the future definition of success might be:
- Achieving the desired business value within the competing constraints
A definition of project success that includes reference to value becomes extremely important when reporting on the success of benefit realization and value management activities. With traditional project management, we create forecast reports that include the time at completion and cost at completion. Using the new definition for success, we can now include in the forecast report benefits at completion and value at completion. This reporting of benefits and value now elevates project performance reporting to the corporate boardroom.
There is another inherent advantage to using value as part of the project’s success criteria. We can now establish termination or pull-the-plug criteria defined in terms of value or benefits that tells us when we should consider canceling a project before additions funds and resources are squandered. All too often, projects are allowed to linger on and continue wasting valuable resources because no one has the heart to cancel the failing project. Establishing cancellation criteria in the business case or benefits realization plan may resolve this issue.
19.3 VALUE-DRIVE PROJECT MANAGEMENT
With the recognition of the importance of value, we are now focusing on value-driven project management activities. Value-driven project management focuses on the delivery of business value outcomes rather than simply deliverables that come from traditional project management practices. Value-driven project management requires an easily understood business case that includes the specific benefits desired.
Project management is now the vehicle for delivering benefits and value. Companies that are mature in BRM also appear to be reasonably mature in project management. In these companies, both the project management approach and the corporate culture are value-driven.
However, some risks need to be considered in value-driven project management:
- Possibility of endless changes in the requirements if not controlled
- Creation of a culture that fosters (possibly unnecessary) scope creep on all projects
- The value determination is made by different people over the project’s life cycle
- Refusal to forecast the true value for fear of project cancellation
- Refusal to believe the forecasted value
Benefits desired must be defined at project initiation. But how do we define value in the early life-cycle phases of a project when value may be just a perception? We would like to define value as well, but value is what the benefits are worth. The hardest part of value determination is defining the metrics so that measurements can be made. Table 19–1 shows some of the easy and hard metrics that are often used to measure value (and possibly benefits as well), and Table 19–2 shows several of the problems that can be encountered with the measurements. The metrics are needed to validate or revalidate not only benefits and value creation but also the business case, assumptions, and constraints. Decision makers must understand that, over the life cycle of the project, circumstances can change, requiring modification of the requirements, shifting of priorities, and redefinition of the desired outcomes.
TABLE 19–1 HARD AND SOFT VALUE METRICS
| Easy (Soft/Tangible) Values | Hard (Intangible) Values |
| Return on investment (ROI) calculators | Stockholder satisfaction |
| Net present value (NPV) | Stakeholder satisfaction |
| Internal rate of return (IRR) | Customer satisfaction |
| Opportunity cost | Employee retention |
| Cash flow | Brand loyalty |
| Payback period | Time-to-market |
| Profitability | Business relationships |
| Market share | Safety |
| Reliability | |
| Reputation | |
| Goodwill | |
| Image |
TABLE 19–2 PROBLEMS WITH VALUE METRICS MEASUREMENTS
| Easy (Soft/Tangible) Values | Hard (Intangible) Values |
| Assumptions are often not disclosed and can affect decision making | Value is almost always based on subjective-type attributes of the person doing the measurement |
| Measurement is very generic | Measurement is more of an art than a science |
| Measurement never meaningfully captures the correct data | Limited models are available to perform the measurement |
Without proper metrics, we tend to wait until the project is way off track before taking action. By that time, it may be too late to rescue it, and the only solution is to pull the plug and cancel a project that possibly could have been saved.
19.4 BENEFITS HARVESTING
Benefits harvesting is the most difficult part of BRM. The problem is not with identifying the benefits or managing the projects to create the benefits. The real issue is harvesting the benefits and managing the transition once the projects are over. The project team produces the deliverables but may have no control over how the business uses those deliverables to create benefits and value.
The benefits of a project are typically realized over time—sometimes years after the project has been completed and the project team has been disbanded. Some benefits will be near term, midterm, and long term. Someone must take ownership for the harvesting process.
Figure 19–1 shows how benefits and value are created over time. The unknown in the figure is the amount of time needed to harvest the benefits and the amount of time necessary to sustain the benefits. There must be long-term adoption consideration to maintain benefits sustainment. Organizational change may be needed, and people may have to be moved out of their comfort zones. This is accomplished by people experienced in organizational change management.
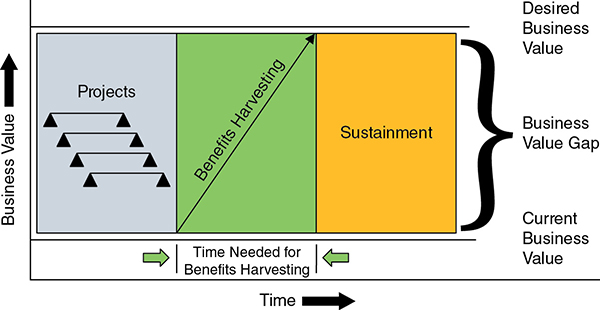
Figure 19–1 Creation of business value over time.
19.5 THE BUSINESS CASE
Benefits realization and value management begin with the preparation of the business case. There are six major players in benefits realization and value management projects:
- A portfolio governance committee composed of members that possess at least a cursory level of knowledge of project management
- The benefits or business owner
- The change management owner, if organizational change management is necessary to harvest the benefits at project completion
- A sustainability owner to assure that the benefits harvested are sustainable
- A Portfolio Project Management Office to assist with metric identification, measuring and reporting
- Project and/or program managers
The business owner is responsible for the preparation of the business case and for contributing to the benefits realization plan. Typical steps that are included as part of business case development are:
- Identification of opportunities such as improved efficiencies, effectiveness, waste reduction, cost savings, new business, and others.
- Benefits defined in both business and financial terms
- A benefits realization plan
- Estimated project costs
- Recommended metrics for tracking benefits and value
- Risk management
- Resource requirements
- High-level schedules and milestones
- Degree of project complexity
- Assumptions and constraints
- Technology requirements—new or existing
- Exit strategies if the project must be terminated
Templates can be established for most of the items in the business case. A template for a benefits realization plan might include the following:
- A description of the benefits
- Identification of each benefit as tangible or intangible
- Identification of the recipient of each benefit
- How the benefits will be realized
- How the benefits will be measured
- The realization date for each benefit
- The handover activities to another group that may be responsible for converting the project’s deliverables into benefits realization
Well-written benefit realization plans, usually prepared by the business owner, tell what is included and excluded from the scope. Poorly written benefit realization plans imply that everything must be done and can lead to numerous and often unnecessary scope changes. Benefit realization plans are not statements of work. Therefore, there will always be some ambiguity in how the expected benefits from a strategic initiative are defined. Types of ambiguity appear in Table 19–3.
TABLE 19–3 TYPES OF AMBIGUITY
| Ambiguity | Description |
| Expectations | Based on the number of stakeholders and the business owner’s previous experience, the benefit realization plan may have vague wording open to an interpretation of the expected outcome. |
| Priority | Each stakeholder and business owner can have a different interpretation of the priority of the project. The project team may not know the real priority. |
| Processes | There are numerous processes to select from as part of execution. Process flexibility will be necessary. There are also several forms, guidelines, checklists and templates that can be used. |
| Metrics/Key Performance Indicators | There are numerous things that can be measured based on the expectations. |
19.6 TIMING FOR MEASURING BENEFITS AND VALUE
The growth in metric measurement techniques has made it possible to measure just about anything, including benefits and value. But currently, since many of the measurement techniques for newer metrics are in their infancy, there is still difficulty in obtaining accurate results. Performance results will be reported both quantitatively and qualitatively. There is also difficulty in deciding when to perform the measurements: incrementally as the project progresses or at completion. Measurements on benefits and value are more difficult to determine incrementally as the project progresses than at the end.
Value is generally quantifiable and easier to measure than benefits. On some projects, the value of the project’s benefits cannot be quantified until several months after the project has been completed. As an example, a government agency enlarges a road with the aim of reducing traffic congestion. The value of the project may not be known until several months after the construction project has been completed and traffic flow measurements have been made. Value measurements at the end of the project, or shortly thereafter, are generally more accurate than ongoing value measurements as the project progresses.
Benefits realization and business value do not come from simply having talented resources or superior capabilities. Rather, they come from how the organization uses the resources. Sometimes even projects with well-thought-out plans and superior talent do not end up creating business value; they may even destroy existing value. An example might be a technical prima donna who views this project as his or her chance for glory and tries to exceed the requirements to a point where the schedule slips and business opportunities are missed. This occurs when team members believe that personal objectives are more important than business objectives.
19.7 INVESTMENT LIFE-CYCLE PHASES
For years, academia taught that traditional project life-cycle phases begin once the project is approved and a project manager is assigned and end after the deliverables have been created. However, when benefits realization and value management become important, additional life-cycle phases must be included, as shown in Figure 19–2. Project managers are now being brought on board earlier than before and remaining after the deliverables have been produced to measure the business value created. Figure 19–2 is more representative of an investment life cycle than a traditional project life cycle. If value is to be created, then the benefits must be managed over the complete investment life cycle. The traditional project life cycle falls within the investment life cycle. More than six life-cycle phases could have been identified in the investment life cycle, but only these six will be considered here for simplicity.
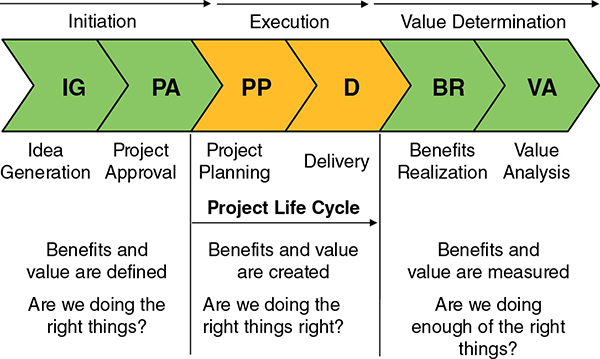
Figure 19–2 Investment life cycle.
The first phase, the Idea Generation (IG) Phase, which often includes a feasibility study and a cost–benefit analysis, is where the idea for the project originates. The idea can originate in the client’s or business owner’s organization, within the senior levels or lower levels of management in the parent company or the client’s firm, or within the organization funding the project. The output of the IG Phase is usually the creation of a business case.
Although the idea originator may have a clear picture of the ultimate value of the project, the business case is defined in terms of expected benefits rather than value. Value is determined near the end of the project based on the benefits that actually are achieved and can be quantified. The benefits actually achieved may be significantly different from the expected benefits defined at project initiation because of the many of the reasons discussed earlier that can lead to changes.
Not all projects require the creation of a business case. Examples might include projects that are mandatory for regulatory agency compliance and are well understood or simply to allow the business or part of the business to continue more efficiently.
Once the business case is prepared, a request is sent to the portfolio project management office (PPMO) for project approval. Companies today are establishing a PPMOs to control the second phase, the Project Approval (PA) Phase, and to monitor the performance of the portfolio of projects during delivery.
The PPMO must make decisions for what is in the best interest of the entire company. A project that is considered extremely important to one business unit may be a low priority when compared to all of the other corporate projects in the queue. The PPMO must maximize the business value of the portfolio through proper balancing of critical resources and proper prioritization of projects. The PPMO must address three critical questions, as shown in Table 19–4.
TABLE 19–4 TYPICAL ROLE FOR A PORTFOLIO PMO
| Critical Questions | Areas of Consideration | Portfolio Tools and Processes |
| 1. Are we doing the right things? | Alignment to strategic goals and objectives, such as shareholder value, customer satisfaction, or profitability Evaluation of internal strengths and weaknesses Evaluation of available and qualified resources |
Templates to evaluate rigor of business case Strategic fit analysis and linkage to strategic objectives Matrix showing relationships between projects Resources skills matrices Capacity planning templates Prioritization templates |
| 2. Are we doing the right things right? | Ability to meet expectations Ability to make progress toward benefits Ability to manage technology Ability to maximize resource utilization |
Benefit realization plans Formalized, detailed project plans Establishing tracking metrics and key performance indicators Risk analysis Issues management Resource tracking Benefits/value tracking |
| 3. Are we doing enough of the right things? | Comparison to strategic goals and objectives Ability to meet all customers’ expectations Ability to capture all business opportunities that are within capacity and capability of company’s resources |
Overall benefits tracking Accurate reporting usingproject management information system |
The activities identified with the third question in Table 19–4 are usually part of the PPMO’s responsibility for determining if all of the benefits were captured or if additional projects need to be added to the queue.
Most companies tend to believe that project managers should be brought on board after the project has been approved and added to the queue. The argument is that project managers are not businesspeople, have limited information that could help in the approval process, and are paid to make project-based decisions only. This is certainly not true today. In today’s world, project managers view themselves as managing part of a business rather than just managing a project. Thus, project managers are paid to make both project-based and business-related decisions on their projects.
When project managers are brought on board after project approval, they are at the mercy of the information in the business case and benefits realization plan. Unfortunately, these two documents do not always contain all of the assumptions and constraints, nor do they discuss the thought process that went into creating the project.
Perhaps the most important reason for bringing the project manager on board early is for resource management. Projects are often approved, added to the queue, and prioritized with little regard for the availability of qualified resources. Then, when the benefits are not delivered as planned, the project manager is blamed for not staffing the project correctly.
Some of the critical staffing issues that need to be overcome include:
- Management does not know how much additional work can be added to the queue without overburdening the labor force
- Projects are added to the queue with little regard for (1) resource availability, (2) skill level of the resources needed, and (3) level of technology needed
- No central repository exists solely for staffing strategic projects
- Project prioritization is based on guesses rather than evidence or facts
- There are no techniques for understanding how a scope change on one project may affect workloads on other ongoing projects
- Resource decisions are made before project approval and before the project manager is brought onboard
- Lack of understanding of how project managers can assist early on in capacity planning and resource management
- Critical resources are assigned to failing or non-value-added projects
Project managers may very well be the best people qualified to critically identify the number of resources needed and the skill levels of the assigned staff. The ability to bring a project manager on board early makes it easier for the portfolio governance personnel to perform effective resource management practices, according to Figure 19–3.

Figure 19–3 Resource management activities.
Even when assigning project managers early in the investment life cycle, resource management shortcomings can occur. These shortcomings include:
- Not capturing all resource demands
- Lacking knowledge of the resource skill levels needed
- Changing resource needs on a project due to scope changes
- Not accounting for the resources that may be needed if transformational activities are required
- Shifting priorities due to firefighting on other critical projects
- Having unrealistic benefit and value estimates
If the shortcomings are not identified and properly managed, the results can be:
- A failure of benefits realization planning
- No maximization of portfolio business value
- Continuous changes to the portfolio
- Continuous reprioritization
- Continuous conflicts over manpower
The benefits of effective resource management are well known:
- Balancing workloads among the most critical projects
- Improvements in resource usage efficiencies by assigning resources with the right skills
- Better planning and control of projects
- Better selection of a portfolio of projects that can maximize business value
The third life-cycle phase is the Project Planning (PP) Phase. This phase includes preliminary planning, detailed planning, and updates to benefits realization planning. Although the business case may include assumptions and constraints, the PPMO may provide additional assumptions and constraints related to overall business objectives and the impact that enterprise environment factors may have on the project. The benefits realization plan that may have been created as part of the business case may undergo significant changes in this phase.
The benefits realization plan is not the same as the project plan but must be integrated with the project plan. The benefits realization plan and the accompanying project plan may undergo continuous changes as the project progresses based on changing business conditions.
The fourth life-cycle phase is the Delivery (D) Phase. This phase, as well as the PP Phase, are most commonly based on the domain areas of the PMBOK® Guide. Traditional project management methodologies are used. In this phase, the project manager works closely with the PPMO, the business owner, and the steering/governance committee to maximize the realization of the project’s benefits.
Performance reporting must be made available to the PPMO as well as to the appropriate stakeholders. If the project is no longer aligned with business objectives, which may have changed during delivery, the PPMO may recommend that the project be redirected or even canceled such that the resources will then be assigned to other projects that can provide a maximization of portfolio benefits.
The fifth and sixth life-cycle phases in Figure 19–3 are the Benefits Realization (BR) Phase and the Value Analysis (VA) Phase. The benefits realization plan, regardless of in which life-cycle phase it is prepared, must identify the metrics that will be used to track the benefits and accompanying value. Benefits and value metrics identification are the weak links in benefits realization planning. Much has been written on the components of the plan, but very little appears on the metrics to be used. However, companies are now creating value metrics that can be measured throughout the project rather than just at the end.4
These last two life-cycle phases are often called benefits harvesting phases, which refers to the actual realization of the benefits and accompanying value. Harvesting may necessitate the implementation of an organizational change management plan that may remove people from their comfort zones. People must be encouraged to make the changes permanent and not revert to their old ways when the projects end.
The people responsible for benefits harvesting need to consider:
- Organizational restructuring
- New reward systems
- Changing skills requirements
- Records management
- System upgrades
- Industrial relations agreements
Full benefit realization may face resistance from managers, workers, customers, suppliers, and partners. There may be an inherent fear that change will be accompanied by loss of promotion prospects, less authority and responsibility, and possible loss of respect from peers.
Benefits harvesting may also increase benefits realization costs because of:
- Hiring and training new recruits
- Changing the roles of existing personnel and providing training
- Relocating existing personnel
- Providing additional or new management support
- Updating computer systems
- Purchasing new software
- Creating new policies and procedures
- Renegotiating union contracts
- Developing new relationships with suppliers, distributors, partners, and joint ventures
19.8 CATEGORIES OF BENEFITS AND VALUE
Part of strategic planning is to create a balanced portfolio of projects. For simplicity’s sake, we use the four categories of projects shown in Figure 19–4. These same four categories can then be used to identify the categories of benefits and value. Numerous benefits, values, and accompanying metrics can be used for each category. Only a few appear here as examples.

Figure 19–4 Categories of benefits and value.
Metrics must be established in each quadrant to serve as early warning signs of possible problems. Some examples of metrics that can identify benefit erosion problems are:
- Metrics on the number of scope changes, which identify the possibility of a schedule slippage and cost overrun
- Metrics on the number of people moved to put out fires elsewhere, which also indicate the possibility of a schedule slippage and cost overrun
- Metrics on excessive overtime, which could indicate serious unresolved issues
- Metrics on missed deadlines, which could indicate that the time to market may slip and opportunities may be lost
Table 19–5 shows typical benefits for each of the four categories. The metrics in the last column can be used to track the benefits.
TABLE 19–5 BENEFITS IN EACH CATEGORY
| Category | Benefits | Project Tracking Metrics |
| Internal Benefits | Processes for adherence to constraints Templates for identifying objectives, sign-offs, and capturing best practices Maintaining a best practices and metrics library Control of scope changes Control of action items Reduction in waste |
Time Cost Scope Quality Number of scope changes Duration of open action items Number of resources Amount of waste Efficiency |
| Financial Benefits | Improvements in ROI, NPV, IRR, and payback period Cash flow Improvements in operating margins Maintaining or increasing market share |
Financial metrics ROI calculators Operating margin |
| Future (Strategic) Benefits | Reducing time to market Image/reputation Technical superiority Creation of new technology or products Maintaining a knowledge repository Alignment of projects to strategic objectives |
Time Surveys on image and reputation Number of new products Number of patents Number of retained customers Number of new customers |
| Customer-Related Benefits | Customer loyalty Number of customers allowing you to use their name as a reference Improvements in customer delivery Customer satisfaction ratings |
Loyalty/customer satisfaction surveys Time to market Quality |
The portfolio governance committee exists for the entire investment life cycle. Its role includes:
- Establishing the right priorities
- Eliminating surprises
- Building contingencies into the portfolio
- Maintaining response flexibility
- Controlling scope creep
- Trying to do more with less
- Ensuring informed decisions using metrics
- Capturing best practices
- Understanding future resource needs
The portfolio governance committee must make strategic decisions and metrics assist in the process. Types of strategic decisions include the need to:
- Verify that value is being created
- Know the risks and how the risks are being mitigated
- Know when to intervene
- Predict future corporate performance
- Confirm that projects are still aligned to strategic objectives
- Perform resource reoptimization if necessary
The role of the PPMO is to work with the governance committee and determine the optimal resource mix for project delivery and benefits realization while honoring the imposed constraints. The PPMO also supports metrics identification, measurement, and reporting. The PPMO supports the governance committee by addressing the following questions:
- Do we have any weak investments that need to be canceled or replaced?
- Must any of the programs and/or projects be consolidated?
- Must any of the projects be accelerated or decelerated?
- How well are we aligned to strategic objectives?
- Does the portfolio have to be rebalanced?
Sometimes the benefits result in best practices that can be applied to other projects. Table 19–6 illustrates benefits from several companies and in which quadrant the benefits appeared. Some benefits can be attributed to more than one quadrant.
TABLE 19–6 COMPANY-SPECIFIC BENEFITS
| Company | Benefit Category | Benefit |
| General Electric | Future | Improving productivity |
| Motorola | Financial | Control of scope creep |
| Computer Associates | Internal | Better handling of customer expectations |
| ABB | Future | Project audits to seek out continuous improvement opportunities |
| Westfield Group | Internal | Development of an online intranet enterprise project management system |
| Antares Solutions (Medical Mutual) | Customer related | Customer-focused change control process |
As mentioned previously, it is important to know whether the measurements of benefits and value should be done incrementally or at the end of the project. Examples of incremental versus end point measurements are shown in Table 19–7. As mentioned, end-of-project measurements are generally more accurate, but some measurements may also be made incrementally.
TABLE 19–7 EXAMPLES OF BENEFITS
| Benefit Category | Benefit | Measured Incrementally | Measured at End |
| Internal | Speed up sign-offs | Yes | |
| Financial | Improving ROI, NPV, IRR and shortening payback period | Yes | Yes |
| Future (Strategic) | Speed up product commercialization process | Yes | |
| Customer related | Improving customer satisfaction | Yes |
19.9 CONVERTING BENEFITS TO VALUE
Value is what the benefits are worth either at the end of the D Phase or sometime in the future. Even though the benefits may be on track for achievement, the final value may be different from the planned value based on the deliverables produced and the financial assumptions made. Here are two examples of converting benefits to value:
- A company approved the development of a customized software package with the expected benefit of reducing order entry processing time, which would be a savings of approximately $1.5 million annually. The cost of developing the package was estimated at $750,000. The value calculation was as follows:

- A company decided to create a dashboard project performance reporting system to reduce paperwork and eliminate many nonproductive meetings. The value calculation was made as follows:
- Eliminate 100 pages or reports and handouts each month at a fully burdened cost of $1000/page, or a savings of $1.2 million.
- Eliminate 10 hours of meetings per week for 50 weeks, with 5 people per meeting and at $100 per hour, or a savings of $250,000.

In both cases, the companies received multiyear benefits and value from the projects.
19.10 GO-LIVE PROJECT MANAGEMENT
One of the challenges facing executives is in the determination of who is best qualified to function as the leader for benefits harvesting. Some people argue that the project manager should remain on board even after project is ready to “go live.” In this case, because benefits harvesting could require a great deal of time, the project manager may very well be functioning as a functional manager in which case the skills needed could be different from those required for traditional project management. This is shown in Table 19–8. A project manager may not be qualified to assume the role of a go-live project manager on all projects.
TABLE 19–8 CHANGE IN SKILLS FOR A GO-LIVE PROJECT MANAGER
| Traits | Differences |
| Authority | From leadership without authority to significant authority |
| Power | From legitimate power to judicious use of power |
| Decision making | From some decision making to having authority for significant decision making |
| Types of decisions | From project-only decisions to project and business decisions |
| Willingness to delegate | Length and size of project will force project managers to delegate more authority and decision making than they normal would |
| Loyalty | From project loyalty to corporate vision and business loyalty |
| Social skills | Strong social skills are needed since we could be working with the same people for years |
| Motivation | Learning how to motivate workers without using financial rewards and power |
| Communication skills | Communication across the entire organization rather than with a select few |
| Status reporting | Status of strategic projects cannot be made from time and cost alone |
| Perspective/outlook | Having a much wider outlook, especially from a business perspective |
| Vision | Must have same long-term vision as the executives and promote that vision throughout the company |
| Compassion | Must have much stronger compassion for workers than in traditional or short term projects since the team members may be assigned for years |
| Self-control | Must not overreact to bad news or disturbances |
| Brainstorming and problem solving | Must have very strong brainstorming and problem-solving skills |
| Change management | Going from project to corporate-wide change management |
| Change management impact | Going from project to organizational change management effects |
19.11 PORTFOLIO BENEFITS AND VALUE
The project tracking metrics identified in Table 19–5 are design to track individual projects in each of the categories. However, specific metrics can be used to measure the effectiveness of a portfolio of projects. Table 19–9 shows the metrics that can be used to measure the overall value created by project management on individual projects, a traditional PMO and a PPMO. The metrics listed under project management and many of the metrics under the traditional PMO are considered micro-metrics focusing on tactical objectives. The metrics listed under the PPMO are macro-level metrics that represent the benefits and value of the entire portfolio. These metrics can be created by grouping together metrics from several projects. Benefits and value metrics are also used to help create the portfolio metrics.
TABLE 19–9 METRICS FOR SPECIFIC TYPES OF PMOs
| Project Management | Traditional PMO | PPMO |
Adherence to schedule baselines Adherence to cost baselines Adherence to scope baselines Adherence to quality requirements Effective utilization of resources Customer satisfaction levels Project performance Total number of deliverables produced |
Growth in customer satisfaction Number of projects at risk Conformance to the methodology Ways to reduce number of scope changes Growth in yearly throughput of work Validation of timing and funding Ability to reduce project closure rates |
Business portfolio profitability or ROI Portfolio health Percentage of successful portfolio projects Portfolio benefits realization Portfolio value achieved Portfolio selection and mix of projects Resource availability Capacity and capability available for portfolio Utilization of people for portfolio projects Hours per portfolio project Staff shortage Strategic alignment Business performance enhancements Portfolio budget versus actual Portfolio deadline versus actual |
Both the traditional and PPMOs are generally considered as overhead and subject to possible downsizing unless the PMOs can show through metrics how the organization benefits by their existence. Therefore, metrics must also be established to measure the value that the PMO brings to the parent organization.
It is important to understand that some of the micro-metrics used for tracking benefits may have different meanings for customers or ultimate consumers. As an example, let us assume that you are managing a project for an external client. The deliverable is a component that your customer will use in a product he or she is selling to customers (i.e., your customer’s customers or consumers). Table 19–10 shows how each of the metrics may be interpreted differently. It is important to realize that benefits and value are like beauty; they are in the eyes of the beholder. Customers and contractors can have a different perception of the meaning of benefits and value as well as of the associated metrics.
TABLE 19–10 INTERPRETATION OF THE METRICS
| Benefit Metric | Project Manager’s Interpretation | Customer’s Interpretation | Consumer’s Interpretation |
| Time | Project duration | Time to market | Delivery date |
| Cost | Project cost | Selling price | Purchasing price |
| Quality | Performance | Functionality | Usability |
| Technology and scope | Meeting specifications | Strategic alignment | Safe buy and reliable |
| Satisfaction | Customer satisfaction | Consumer satisfaction | Esteem in ownership |
| Risks | No future business from this client | Loss of profits and market share | Need for support and risk of obsolescence |
19.12 ALIGNMENT TO STRATEGIC OBJECTIVES
Because of advances in metric measurement techniques, models have been developed by which we can show the alignment of projects to strategic business objectives. One such model appears in Figure 19–5. Years ago, the only metrics use were time, cost, and scope. Today we can include metrics related to both strategic value and business value. This allows us to evaluate the health of the entire portfolio of projects as well as individual projects.

Figure 19–5 Project scoring model.
Since all metrics have established targets, we can award points for each metric based on how close we come to the targets. Figure 19–6 shows that the project identified in Figure 19–5 has thus far received 80 points out of a possible 100 points. Figure 19–7 shows the alignment of projects to strategic objectives. If the total score in Figure 19–6 is between zero and 50 points, we would assume that the project is not contributing to strategic objectives at this time, and this would be shown as a zero or blank cell in Figure 19–7. Scores between 51 and 75 points would indicate a “partial” contribution to the objectives and shown as a 1 in Figure 19–7. Scores between 76 and 100 points would indicate fulfilling the objective and shown as a 2 in Figure 19–7. Periodically we can summarize the results in Figure 19–7 to show management Figure 19–8, which illustrates our ability to create the desired benefits and final value.

Figure 19–6 Project scoring model with points assigned.

Figure 19–7 Match projects to strategic business objectives.
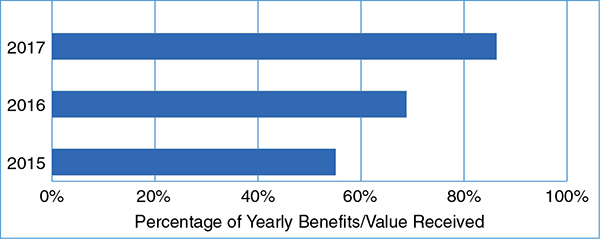
Figure 19–8 Periodic benefits and value achieved.
19.13 CAUSES OF COMPLETE OR PARTIAL BRM FAILURE
No matter how hard we try to become good at benefits realization and value management, there are always things that can go wrong and lead us to disaster. Fourteen such causes of failure that can occur along the entire investment life cycle include:
- No active involvement by the business owner or stakeholders.
- Decision makers are unsure about their roles and responsibilities, especially in the early life-cycle phases.
- The project is approved without a business case or benefits realization plan.
- A high level of uncertainly and ambiguity exists in defining the benefits and value such that they cannot be described adequately in a document such as a benefits realization plan.
- Highly optimistic or often unrealistic estimates of benefits are made to get project approval and a high priority.
- Failing to recognize the importance of effective resource management practices and the link to BRM.
- Maintaining a heavy focus on the project’s deliverables rather than on benefit realization and the creation of business value.
- Using the wrong definition of project success.
- Managing the project with traditional rather than investment life-cycle phases.
- Using the wrong metrics, unreliable metrics, or simply lacking of metrics to track benefits and value.
- Failing to track benefits and value over the complete life cycle.
- Not having any criteria establish for when to cancel a failing project.
- Having no transformational process if necessary where the benefits and value can be achieved only from necessary organizational changes in the way the firm must now conduct business.
- Failing to capture lessons learned and best practices, thus allowing mistakes to be repeated.
Item 14 is often the solution to correct the first 13 problems from recurring.
19.14 CONCLUSION
Because of the importance of benefits and value, today’s project managers are more business managers than the pure project managers of the past. Today’s project managers are expected to make business decisions as well as project-based decisions. Project managers seem to know more about the business than their predecessors.
With the growth in measurement techniques, companies will begin creating metrics to measure benefits and value. While many of these measurement techniques are still in their infancy, the growth rate is expected to be rapid.