
2 PROJECT PLANNING
LEARNING OUTCOMES
When you have completed this chapter you should be able to demonstrate an understanding of the following:
- project deliverables and intermediate products;
- work and product breakdowns;
- product definitions (including the identification of ‘derived from’ and ‘component of’ relationships between products);
- relationship between products and activities in a project;
- checkpoints and milestones;
- elapsed time and effort required for activities;
- activity networks (using the ‘activity on node’ notation);
- calculation of earliest and latest start and end dates of activities and the resulting float;
- identification and significance of critical paths;
- resource allocation, smoothing and levelling, including the use of resource histograms;
- work schedules and Gantt charts.
2.1 INTRODUCTION
In this chapter we describe the main steps in producing an initial plan for a project. You will recall from Chapter 1 that before the detailed planning of a project starts, the business case for the project should have been set out. This shows how the value of the proposed IT application’s benefits are expected to outweigh the costs of developing and managing it. The overall objectives of the project, which define the successful outcomes of the project, have also been identified and have been agreed by the main participants in the project.
2.2 APPROACHES TO PLANNING
There are two approaches to identifying the components of a project: product-based and work- or activity-based.
2.2.1 Product-based planning
With the product-based approach, detailed planning usually begins with identifying the project deliverables: that is, the products that will be created by the project and delivered to the client. A product must be in some way tangible, but it can be any of a wide range of things. It could be a software component, a document, a piece of equipment or even a person (for example, a trained user). It could be a new version of some existing product, as with a modified version of a software component.
In the case of the Canal Dreams ebooking enhancement project, the deliverables include:
- software functionality which enables members of the public to book canal holidays via the internet;
- enhanced network systems that can cope with the expected additional traffic to the Canal Dreams website;
- a new network support centre to support 24-hour/seven days a week activity.
Once the deliverables have been defined, intermediate products can be identified. These are products which are created during the course of the project, but which may not actually be delivered to the client at the end of the project. In the case of the Canal Dreams ebooking enhancement project, intermediate products include (among other things):
- business process models;
- interface design documents, such as a corporate website style guide, site maps, ‘wire-frame’ designs,
- an enhanced IT infrastructure architecture plan;
- software specifications;
- acceptance test plan;
- progress reports.
Some products, such as the progress reports in the list above, will relate to the management or quality control of the project.
The deliverable and intermediate products can be written simply as a list of products, but sometimes they are shown in a product breakdown structure diagram.
Some of the stakeholders in the project may find there are some products with which they are unfamiliar. Some users, for example, may be unsure of what is meant by an ‘acceptance test plan’. To remedy this, planning should include drawing up product definitions. For each product, the following should be documented:
- The identity of the product, for example ‘acceptance test plan’.
- A description of the product, for example ‘a plan of the test cases and the results that the users expect the application to produce’.
- The product or products that have to exist before this one can be created: that is, those it is derived from. For example, the acceptance test plan is stated to be derived from the requirements specification, which describes the main transactions of the application.
- The components that make up the product – in the case of an acceptance test plan, the main sections in the document.
- The format of the product – for example, that it is a word-processed document or a spreadsheet or a piece of software.
- The quality criteria that explain how the product will be judged as satisfactory – for example, the acceptance test plan being reviewed against the requirements specification.
2.2.2 Work and product breakdown structures
An alternative method of planning is the work- or activity-based approach, which identifies the required work activities or tasks in a work breakdown structure (WBS). In this case, the intermediate products related to setting up the Canal Dreams ebooking project listed above would be replaced by activities such as:
- analysing/redesigning business processes;
- designing web interfaces;
- redesigning network architecture;
- specifying software;
- planning acceptance tests;
- reporting progress.
As nearly all activities will generate a product – or else why do them? – and all products will need to have some activities that give birth to them, there may not really be much difference between the two approaches in practice.

ACTIVITY 2.1
Which products are created by each of the following?
a) testing
b) training
c) network installation
d) a project progress meeting
2.3 PRODUCT FLOW DIAGRAM
If you have adopted a product-driven approach, it is possible to draw up a product flow diagram (PFD) showing the order in which the products have to be created. This should be relatively easy to draft if you have already produced product definitions that specify from which other products each product is derived. Figure 2.2 gives an example fragment of a product flow diagram.
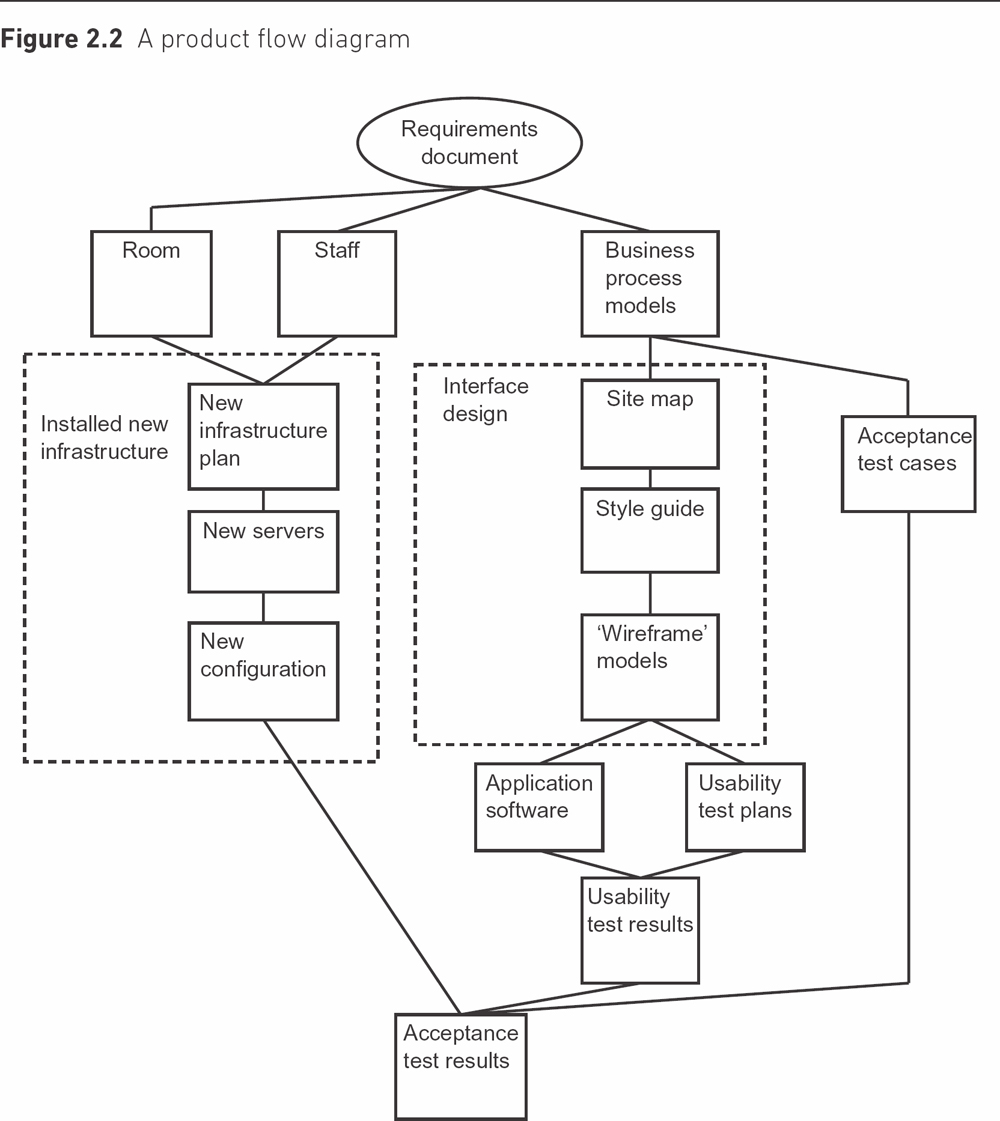
Note the oval with ‘requirements document’ in it. This refers to a product that already exists and that will be used to generate one or more of the products in the PFD. There is no one correct PFD – its structure depends on the decisions made. For instance, in Figure 2.2 the assumption is that additional network specialists will be recruited who can work on enhancing the current IT infrastructure, and then support the new operational system. An alternative would be to bring in network specialists on short-term contracts to do the enhancement work. The support of the new infrastructure could be carried out by different people – perhaps someone already working for Canal Dreams in a now-redundant role could be retrained.
The flow of a PFD is normally from top to bottom and then left to right. Looping back is not allowed – not because this cannot happen in real life, but because it can almost always be possible technically to go back and rework a product previously thought to be completed. In this case all the products depending on the reworked one might also need some reworking.
In two places in Figure 2.2 we have put boxes of broken lines around a sequence of products. This is not part of the official PFD notation: we wish to show that a group of components – in one case, site plan, style guide and ‘wire-frame’ designs – will be treated as one large product – interface design.
2.4 ACTIVITY PLANNING
Whether a product flow diagram has been drawn up or whether the planner has simply drawn up a list of activities, the next step is to draw up an activity network. This shows the activities needed and the order in which they are to be carried out.
2.4.1 Activity network diagram
There are two sets of conventions for drawing up activity networks: ‘activity on node’ and ‘activity on arrow’. Figure 2.3 shows an example of an activity on arrow diagram.
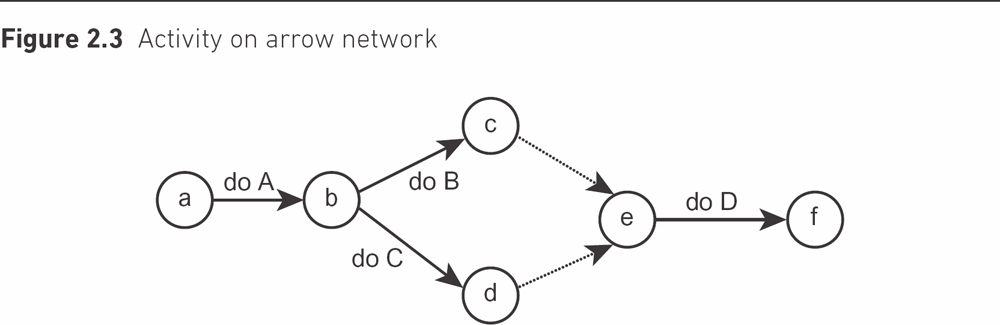
As the name implies, the arrows in an activity on arrow diagram represent activities, while the circles that link the arrows (that is, the nodes) represent the ends of some activities and the starts of others. The arrows with broken lines indicate ‘dummy activities’ which simply show a dependency between two of the event nodes – for example c, the end of ‘do B’, and e, the start of ‘do D’.
In these notes we use a different set of conventions, activity on node, which is used by most modern project planning tools, including Microsoft Project.
Figure 2.4 shows the same activities as Figure 2.3, but using activity on node notation. Here the boxes (which are the ‘nodes’ in this case) represent activities while the lines between the boxes show where the start of one activity depends on the completion of some other activity. Note that at this stage the constraints may be technical or external. A technical constraint normally means that a product has to be created by one activity so that another can use it. An example of an external constraint is a system that can only be tested out of office hours, so it has been agreed contractually that testing will take place at weekends only.
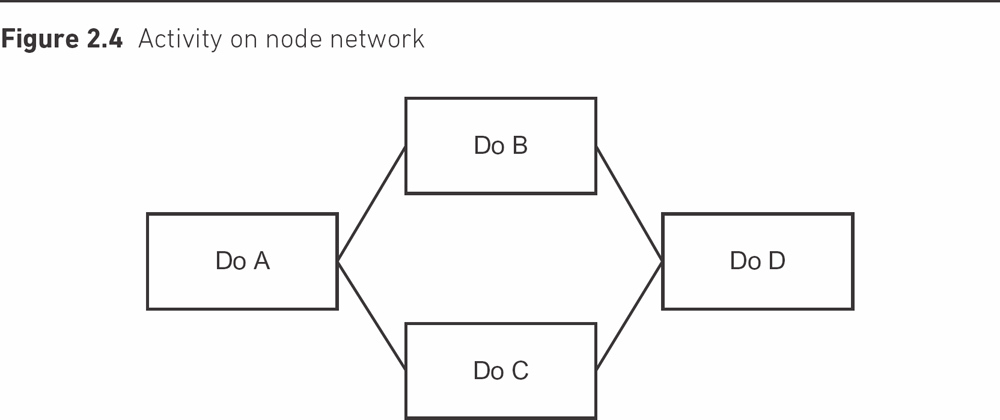
What are not taken into account at this point are resource constraints – for example, that a person will not be able to start on one task because he or she will not have finished another. These considerations are deferred because a decision might be taken, when staff are being allocated, to employ more staff.
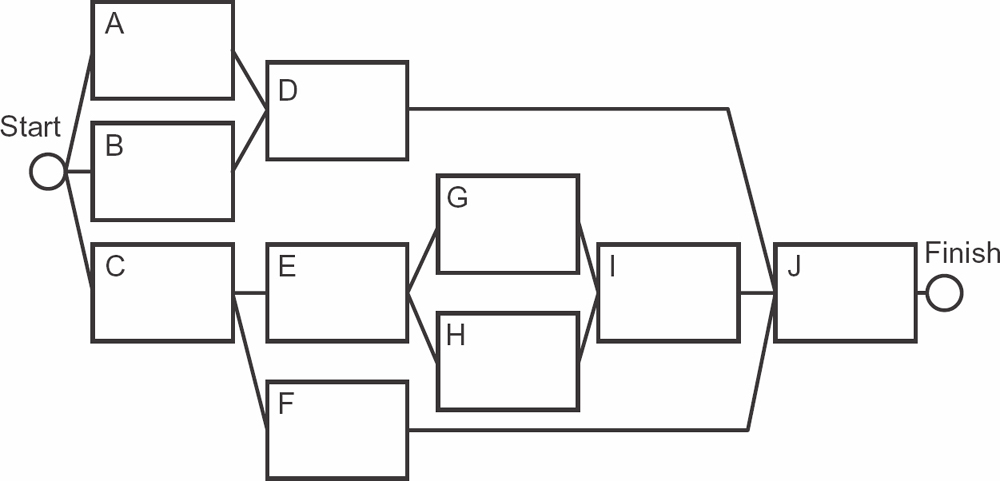
ACTIVITY 2.2
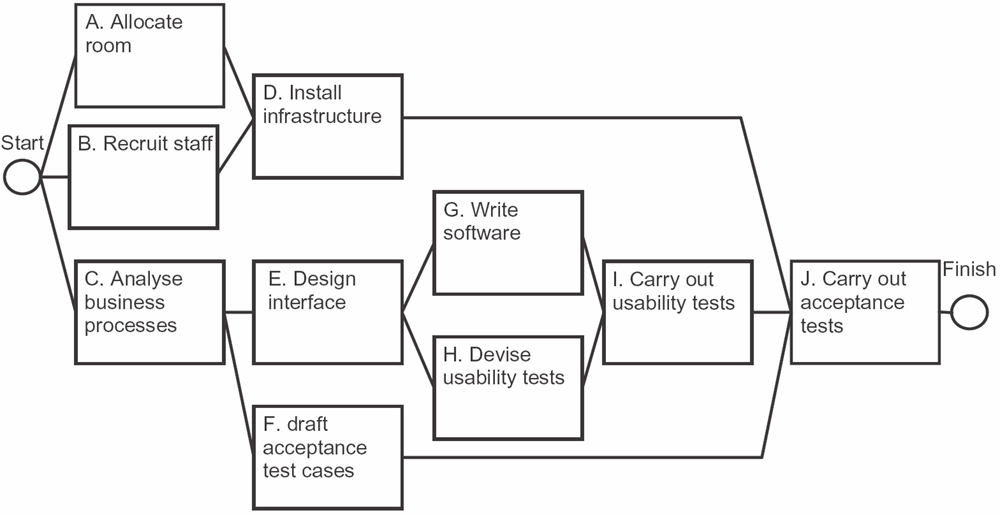
In this activity network, match the activities with the boxes so that the activity network is compatible with the product flow diagram in Figure 2.2.
… allocate room
… analyse business processes
… carry out acceptance tests
… carry out usability tests
… devise usability tests
… design interface
… draft acceptance test cases
… install infrastructure
… recruit staff
… write software
In Activity 2.2 we added a ‘start’ and ‘finish’. These are important points of time (or ‘events’) in the life of the project, but they will not actually take up any time. If, for example, the finish of the project was marked by a celebration that took up several hours, then the ‘event’ would become an activity in its own right. We call these important events milestones. Milestones can also be located in the middle of a project, for example at the end of one important phase and the start of the next. Always remember, though, that milestones do not take up time. Sometimes an important point in a project may be marked by a meeting to check that everything planned has been completed successfully before the next part of the project starts. This checkpoint would be an activity in its own right.
2.4.2 Estimating elapsed time
Having identified the activities and the order in which they have to be worked on, we now need to estimate how long we think each activity is likely to take. Note that we are concerned here about elapsed times. This is the time from the start of an activity to the finish. This is not the same as the effort spent on an activity. Effort could be more than elapsed time – for example, where we have three people working on a job for two days, the elapsed time would be two days but the effort would be six staff days. Effort could also be less than elapsed time – for example, where someone works only afternoons. Estimates of effort become important when cost planning is being done – recall Section 1.8.3.
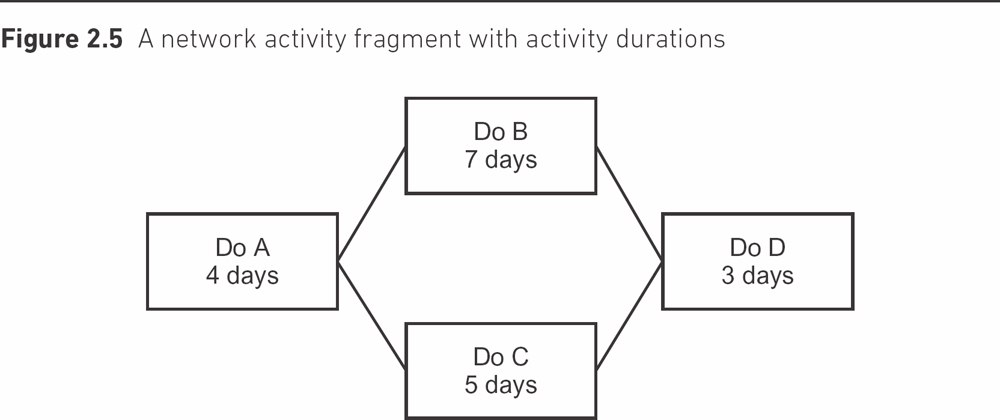
Let us assume that we can allocate estimated durations to the activities in the activity network of Figure 2.4 (see Figure 2.5).
We want to calculate the earliest day upon which each activity can start. Rather than worry about taking account of weekends and public holidays at this point, we simply allocate each day a sequence number, starting with day 0. (Technically, day 0 means ‘the end of day 0’, which means the start of day 1, as explained below.)
The earliest start date for ‘Do A’ is day 0 by definition, because it is the first activity in the network. The earliest time at which the activity can finish is day 0 plus the duration of the activity: that is, day 4.
earliest finish date = (earliest start date + activity duration)
The earliest start dates for the two activities ‘Do B’ and Do C’ are governed by the earliest finish date of the preceding activity, ‘Do A’. In fact, we can say that in this case the earliest start dates for ‘Do B’ and ‘Do C’ are the same as the earliest finish date for ‘Do A’.
You may wonder why it is not the following day. Well, the convention is that when we say ‘Do A’ finishes on day 4, we mean at the end of day 4. When we say ‘Do B’ and ‘Do C’ start on day 4 we really mean at the end of day 4, which of course really means the start of day 5. It is best just to accept this as the convention. It saves problems arising where activities do not take whole numbers of days, for example 5.5 days.
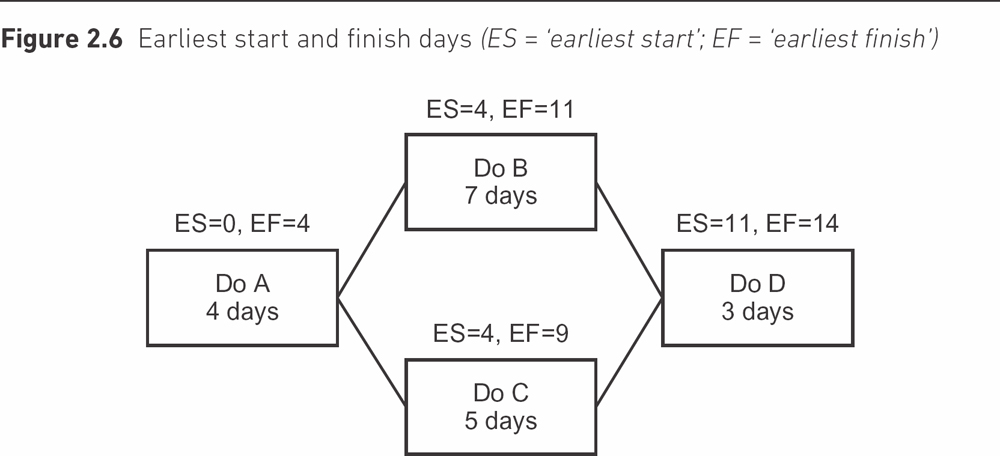
We can now work out the earliest finish days of ‘Do B’ and ‘Do C’ as day 11 and day 9, respectively. What about the earliest start date for ‘Do D’? We have two preceding earliest finish dates, so we take the one which is later: that is, day 11.
earliest start date = the latest of the earliest finish dates of the preceding activities upon which the current activity is dependent
We end up with the day numbers shown in Figure 2.6, where ES means the earliest start date and EF means the earliest finish date.
It is possible for some activities to start or finish late without the project as a whole being delayed. To see where this is the case, the latest finish and latest start dates for each activity are calculated. We will assume that we want the project as a whole to take the shortest time possible: that is, to finish on day 14. Day 14 becomes the latest finish date for the activity ‘Do D’. The latest start day for this activity is calculated by subtracting the duration from the latest finish: that is, 14 − 3 = Day 11.
latest start date = latest finish date of current activity − duration
We now work backwards. The latest start day for the activity ‘Do D’ becomes the latest finish day for ‘Do B’ and ‘Do C’. By subtracting the durations for these activities from their latest finish days we get their latest start days: that is, 11 − 7 = Day 4 for ‘Do B’ and 11 − 5 = Day 6 for ‘Do C’.
In the case of ‘Do A’ we have to decide whether to base the latest finish on the latest start date of ‘Do B’ or ‘Do C’. The earlier of the two is taken as the latest finish time for ‘Do A’ – that is, day 4 – which comes from ‘Do B’.
latest finish date = the earliest of the latest start dates of the activities that are dependent on the current activity
We now have the situation shown in Figure 2.7, where LS means latest start and LF means latest finish.
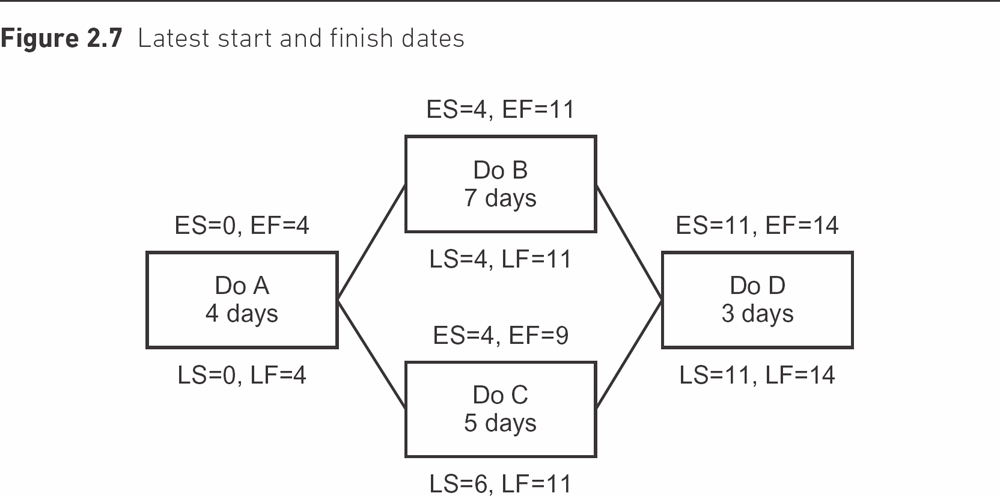
It can be seen from Figure 2.7 that for all the activities except ‘Do C’, the earliest and latest start days are the same, as are the earliest and latest finish days. This means that if these activities are late, the project as a whole will be delayed. In the case of ‘Do C’, if you look at the day numbers you can see there is a difference of two days between the earliest and latest day numbers. This means that ‘Do C’ could be one or two days late and the duration of the project as a whole would not be affected.
This leeway is called the float and can be defined as:
float = latest finish date − earliest start date − duration
A quick way of calculating this is by subtracting the earliest start from the latest start (or the earliest finish from the latest finish).
In Figure 2.7, ‘Do A’, ‘Do B’ and ‘Do D’ all have zero float. They form a small chain of three activities from the beginning to the end of the activity network. This chain is the critical path. If any activity on this path is delayed then the whole project will be delayed.
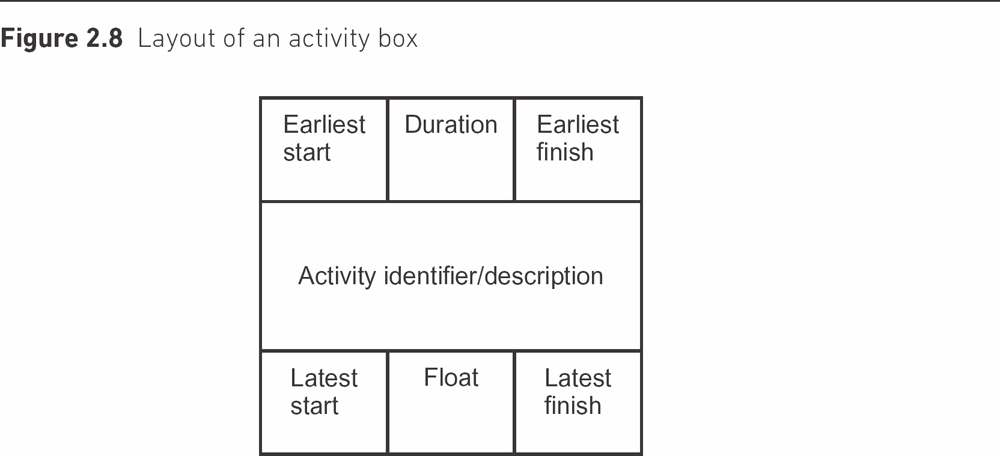
The details for each activity can be displayed more clearly if the boxes on the activity diagram are divided up as shown in Figure 2.8.
Thus for the activity ‘Do C’, the activity box in the activity network could be drawn up as in Figure 2.9.
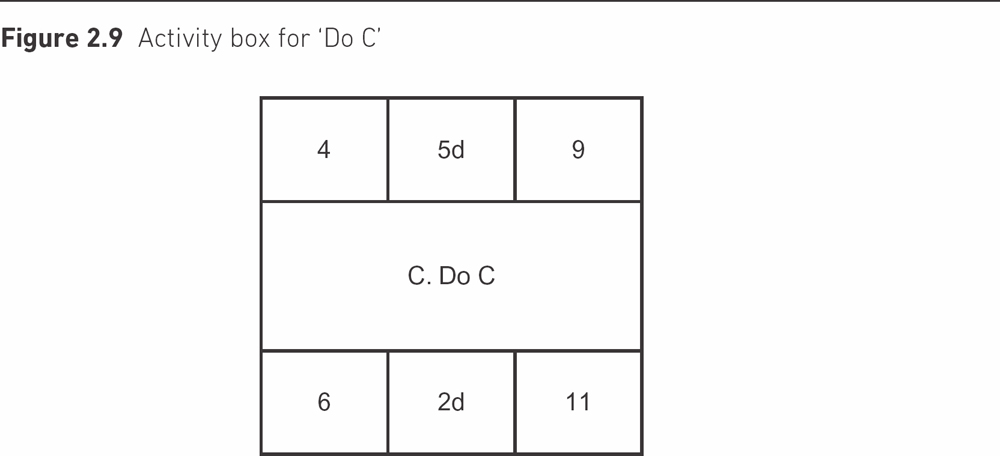
The activity span is the total period during which the activity has to take place, and is defined as:
activity span = latest finish day − earliest start day
In this case it is 11 – 4: that is, 7 days. Where an activity has float, there is a ‘window of opportunity’, reflected by the activity span (see Figure 2.10), within which the activity can start and be completed.
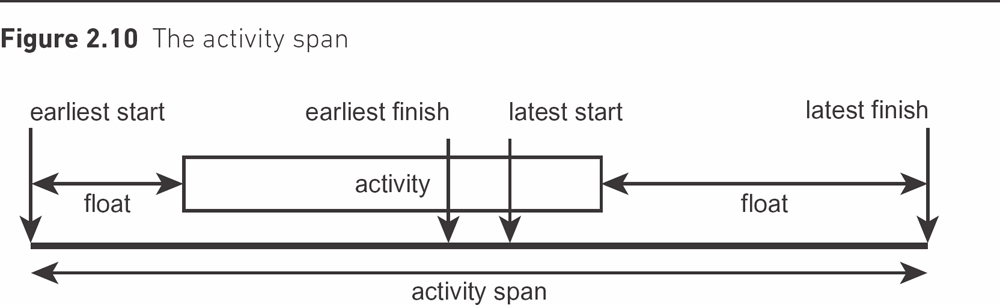
The activity has to take place within the activity span. Because there is some float, there is some freedom about when it can take place within that period. However, the start must be in the period between the earliest and the latest start. If it is not, it will not be completed within the activity span – unless its duration can be shortened in some way.
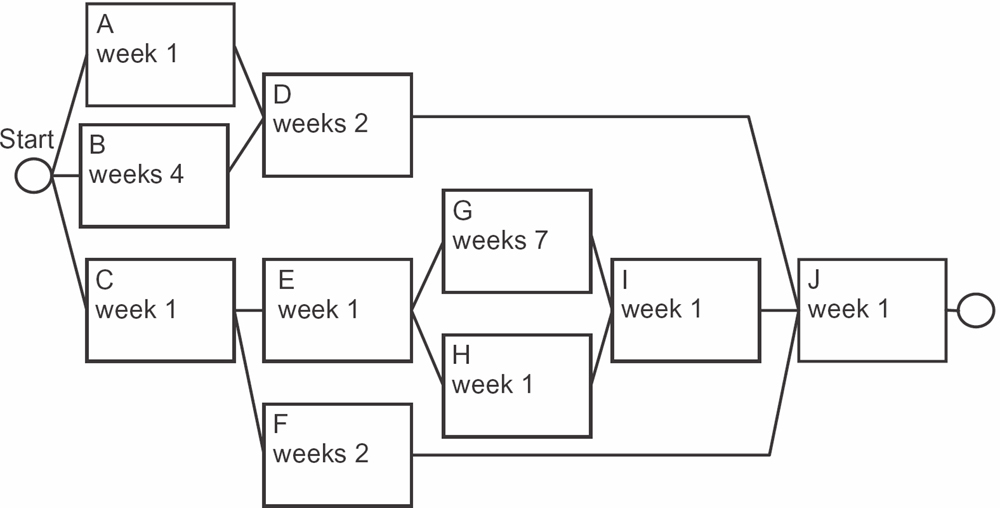
ACTIVITY 2.3
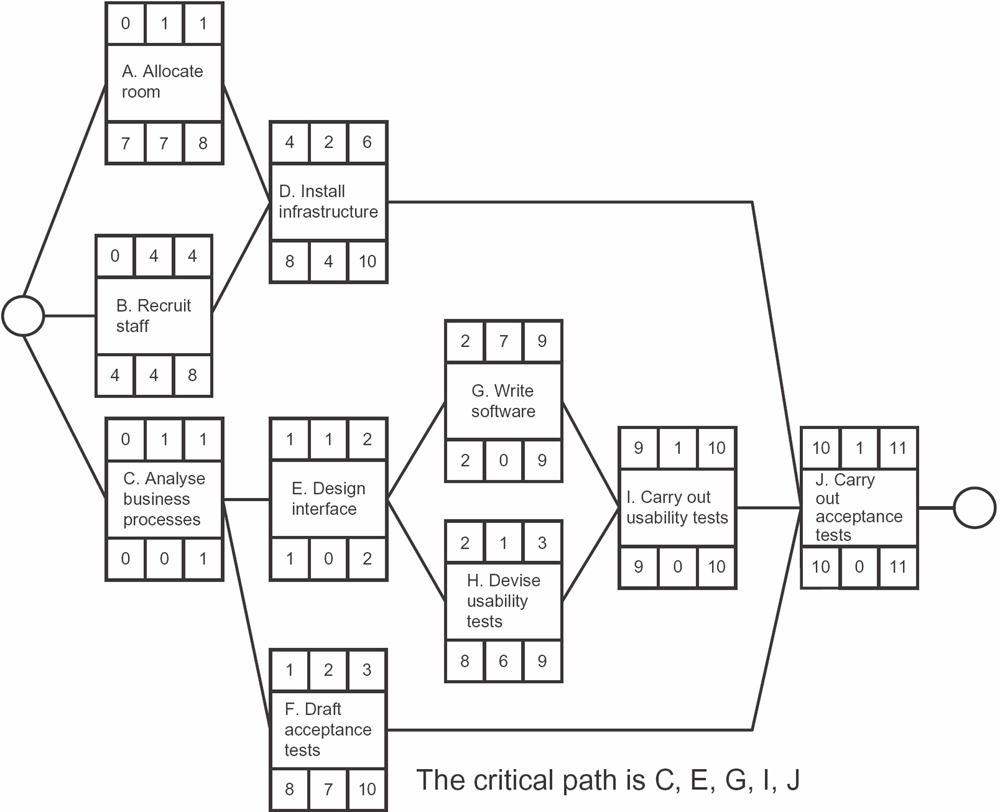
Calculate the earliest and latest start and finish weeks and floats for each of the activities in the activity network below. Use the results to identify the critical path.
In Section 1.7.4 the iterative model was introduced, where one or more activities could be repeated, with each loop creating a new version of the products of the process. Activity networks assume that all activities are executed just once. Clearly, some – such as usability tests – can be carried out more than once on revised versions of the software. We deal with this by concealing the iteration within an activity. Usability tests may be carried out a number of times on revised versions of the software, but all the iterations are together expected to take no longer than one week.
2.5 RESOURCE ALLOCATION
So far we have taken no account of the availability of the resources needed to carry out any task. It is assumed that they will be available when they are needed. The resources that now need to be considered include raw materials, staffing and equipment. Usually with IT projects, the main concern is staffing; however, sometimes equipment can also cause problems. For example, when conducting acceptance testing for a modified IT application, there is often a need for some testing of the whole operational system. This may need to be done on a public holiday or at the weekend, when no normal operational use is being made of the system. Here, we focus on staff resourcing.
For each activity, the resource types needed are identified. A resource type is a group of people of which any member could carry out a particular task. For example, if a software component needs to be written in Java, identifying Ali as the needed resource would be too precise; Jane may be equally proficient in Java. Identifying the resource simply as a software developer, on the other hand, may be too vague: Alfred is a software developer but, as a COBOL programmer, he has no knowledge of Java. Identifying the required resource as a Java programmer may be just about right.
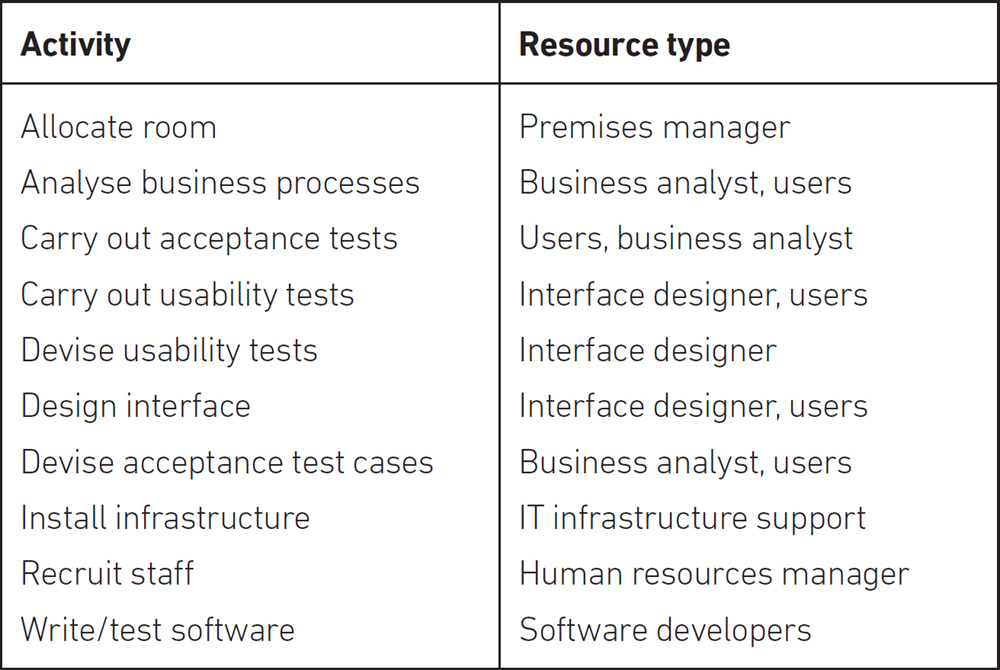
ACTIVITY 2.4
Match the following resource types and activities. More than one resource type might be needed for an activity.
Activities
allocate room
analyse business processes
carry out acceptance tests
carry out usability tests
devise usability tests
design interface
draft acceptance test cases
install infrastructure
recruit staff
write software
….
Resource types
business analyst
human resources manager
interface designer
IT infrastructure support
premises manager
software developer
users
IT manager
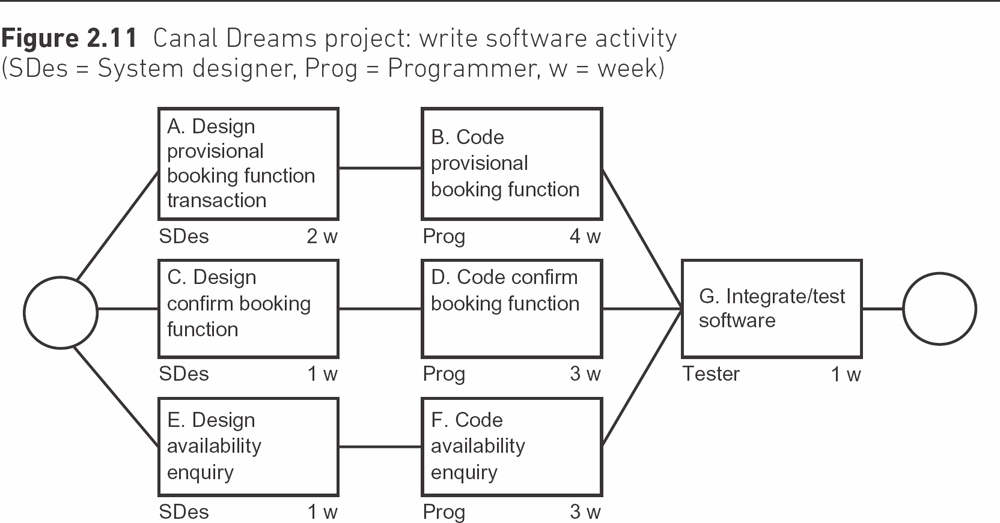
In order to illustrate the process of resource levelling and smoothing, we break down one of the activities in our Canal Dreams ebooking enhancement project, ‘write software’, into more detailed tasks (see Figure 2.11).
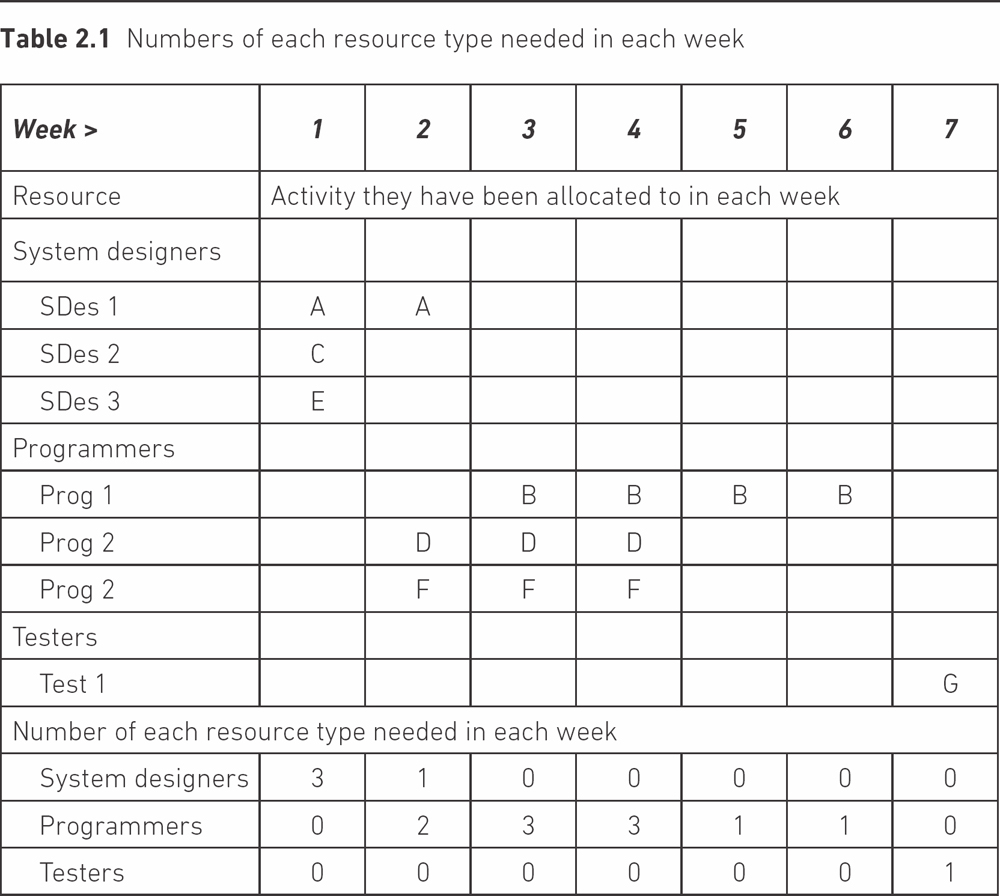
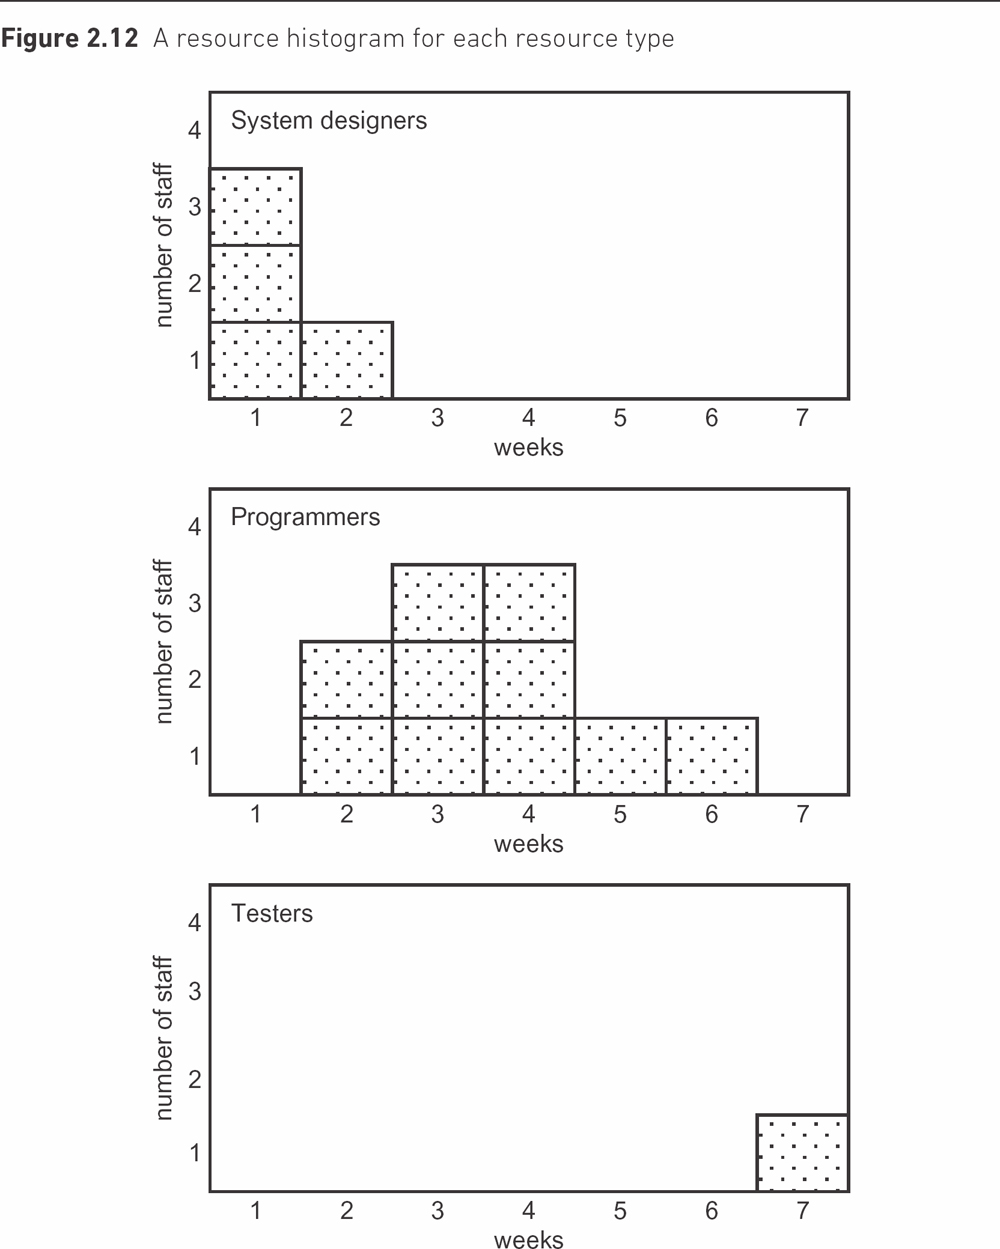
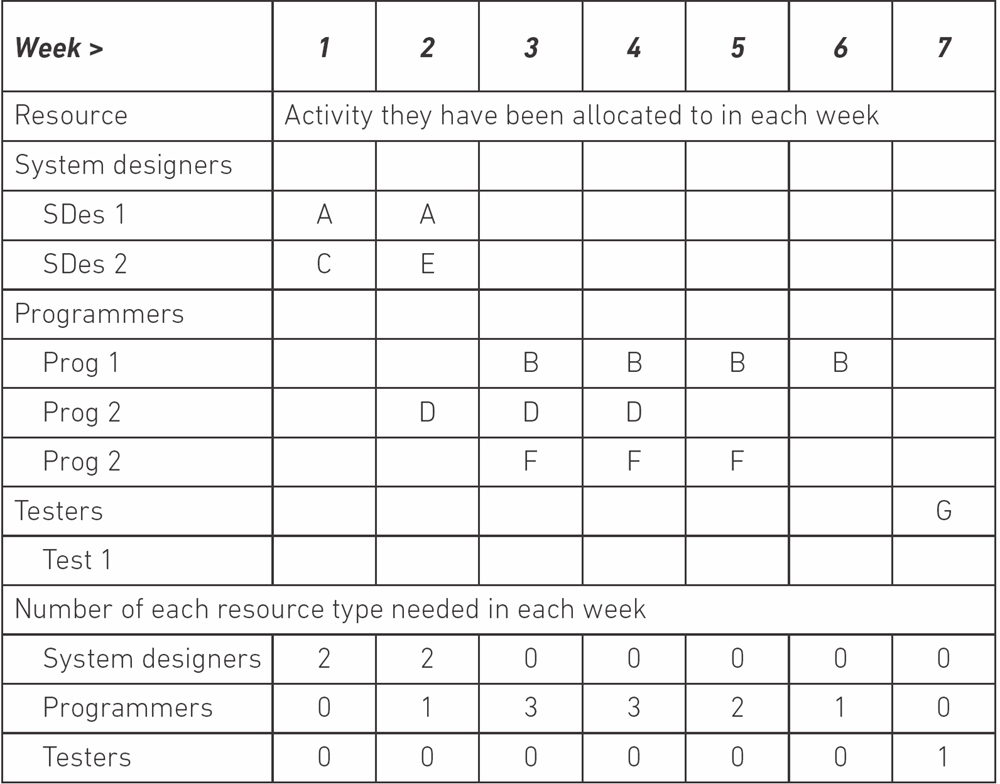
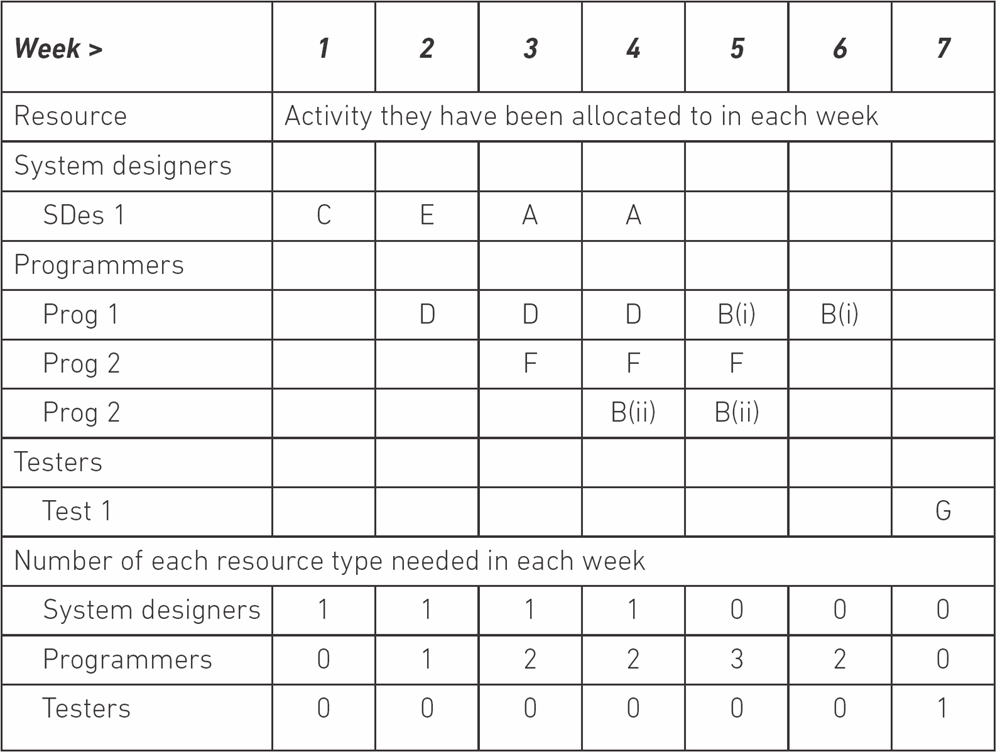
Having allocated resource types to activities, we now go through the activity network and, for each unit of calendar time (in this case each week), note the resources needed if the activity is to start at its earliest start date. In the top part of Table 2.1 we have, for example, identified the different resource types and allocated particular activities to them by putting the alphabetic characters we used in Figure 2.11 to identify each activity e.g. ‘A’ for ‘design provisional booking function’ into the relevant week cells. Where the same type of resource is needed for different activities in the same week, we identify different instances, for example SDes 1, SDes 2 and so on and allocate them to the different parallel activities where they are needed. When we have finished this allocation we can count the number of each type of staff needed in each week. We can also depict this information as a resource histogram (see Figure 2.12).
In some cases, we may find that the project plan needs more staff of a certain type than we have available. Another concern is that where we are acquiring staff from outside, we want to make sure that, as far as possible, we are able to provide a steady flow of work. Where temporary staff need to be employed on expensive contracts, we try to avoid having short periods of intense activity alternating with periods when nothing much is happening and staff are underemployed. As well as the additional costs, temporary staff’s lack of familiarity with the project may mean that they are less productive at first.
Delaying certain activities may allow peaks and troughs to be ‘smoothed’, which will lead to more economical staff costs and more productive work distribution. For example, in Figure 2.12, three system designers are needed in week 1 and only one in week 2. If we have only two system designers on the staff, then we could employ a third system designer, possibly on an expensive temporary contract, for the first week. If we calculate the float for each activity in the activity network (Figure 2.11), we can see that two of the activities needing system designers have two weeks’ float. If we delay starting one of these activities until week 2, this part of the project as a whole will not be delayed, but we will need only two system designers.
When there are not enough staff of a particular resource type to carry out the activities due to take place at a certain time, there is a resource clash. Even if there are no resource clashes, a planner should try to arrange activities so that the usage of a resource type is as stable as possible.
ACTIVITY 2.5
Redraw Table 2.1 to take account of a delay of one week to the activity ‘design availability enquiry’.
Where there is a resource clash or the demand for a resource is very uneven, the following options may be considered:
- Use the float of an activity to delay the start of some work until the required staff member is available (as in the example above).
- Delay the start of an activity even though the float has been used up. This will delay the overall completion date of the project, but that may be preferable to the extra cost of employing more staff.
- Buy in additional staff to cover the staff deficiency. This will normally increase the cost of the project.
- Split an activity into sub-activities. For example, it may be possible to split the provisional booking function into two component sub-functions, each requiring a week of design and two weeks of programming. This could allow the demand for systems design to be spread more evenly.
ACTIVITY 2.6
Redraw Table 2.1 to reflect the demand for the different types of resource if the provisional booking function is split into two equal-sized software components, each needing two weeks of coding, and a management decision is made to employ only one systems designer.
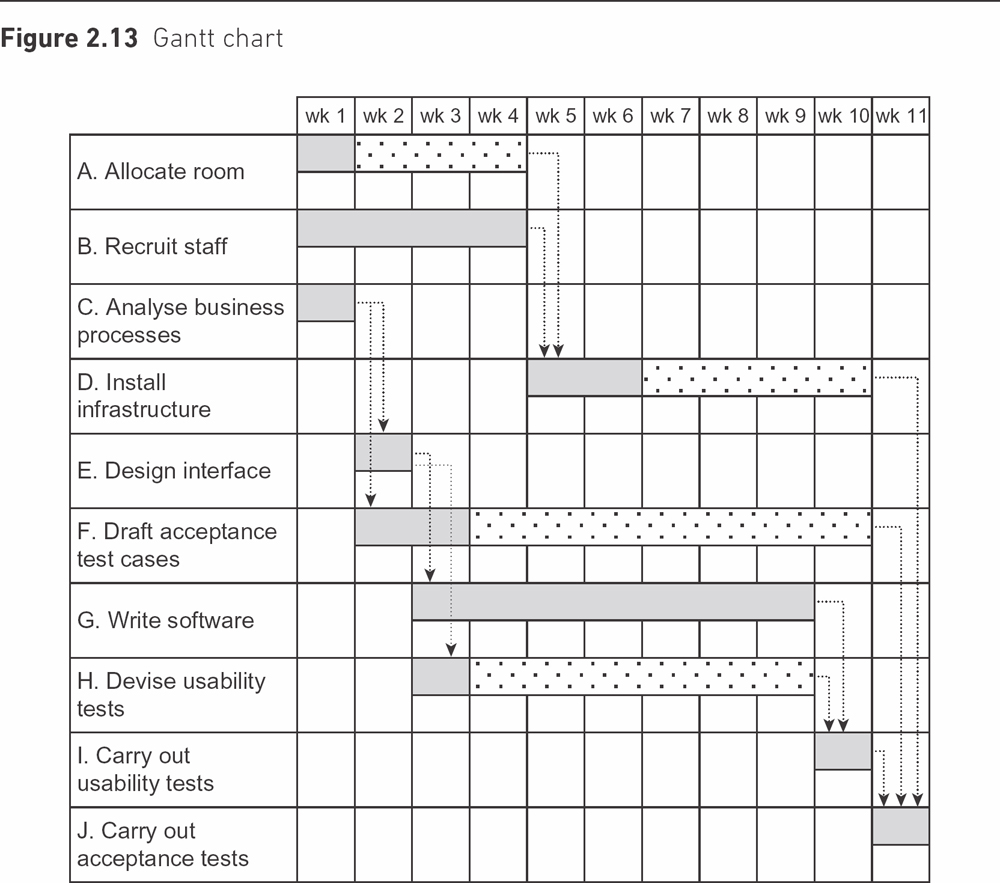
We are now in a position to put our plan into a form that will be easily understood by all those who are going to be carrying it out. The most common format used is a Gantt chart (see Figure 2.13). The activities are listed down the left-hand side and the calendar units (in this case, weeks) are shown along the top. In the body of the diagram there are block symbols for each activity, showing when the activity will be carried out. In the diagram, the free float related to each activity is indicated by the lighter blocks that extend the base period for an activity. Free float is the amount of time that an activity can be late without any other activity being late. For Activity A (Allocate room), this is 3 days. If Activity A is later than 3 days, the start of Activity D (Install infrastructure) will be delayed and Activity D’s free float will be reduced. However Activity A can be up to 7 days late and, as long as Activity D does not take longer than planned, the project as a whole will not be delayed. The 7 days is known as Activity A’s total float and is what appears on the activity network.
For a smaller project, an alternative layout is to list each member of staff down the left and show what they are doing in each time period in the body of the diagram. This is not dissimilar to the holiday planning charts on the walls of many offices showing when staff will be away. A disadvantage of this format is that activities involving more than one team member have to be duplicated.
If an activity has to be delayed until a member of staff becomes available upon the completion of some other activity, this should not be indicated by a dependency link between the two activities on the activity network. Rather, the start date of the waiting activity should simply be amended on the Gantt chart. If other staff were to be released earlier than foreseen they could be used to expedite the waiting activity. If the waiting task had a dependency link to another task, it would imply a technical reason for waiting until the other was complete and would mask the opportunity to use other staff.
ACTIVITY 2.7
What does GANTT stand for in the name ‘Gantt chart’?
2.6 USING SOFTWARE TOOLS FOR PLANNING
In this chapter it has been assumed that all the planning, and calculation of the consequences of particular planning decisions, will be done by hand with no computer assistance. It will be a relief for most people to know that there are software packages that will carry out most of the calculations for you. Examples of these are Microsoft Project and Oracle Primavera.
In most cases, for each activity you will input the activity name, the duration of the activity, the activities upon which it is dependent and the resources that it will use. Given this information, the software then produces activity networks, resource histograms, Gantt charts and other useful reports. Some packages suggest ways of resolving resource clashes, but users need to check that the results are what they really want. Where activity networks and Gantt charts are produced, the planner often has to tweak them to make them easy for others to understand. For example, a Gantt chart often spreads over several pages, many of which are blank. The advantage of using a software tool is that it is easy to make changes to the plan and see what the consequences of the changes will be.
SAMPLE QUESTIONS
Questions 1, 2 and 3 are about the diagram below. The number of days in each box show the duration of the activity.
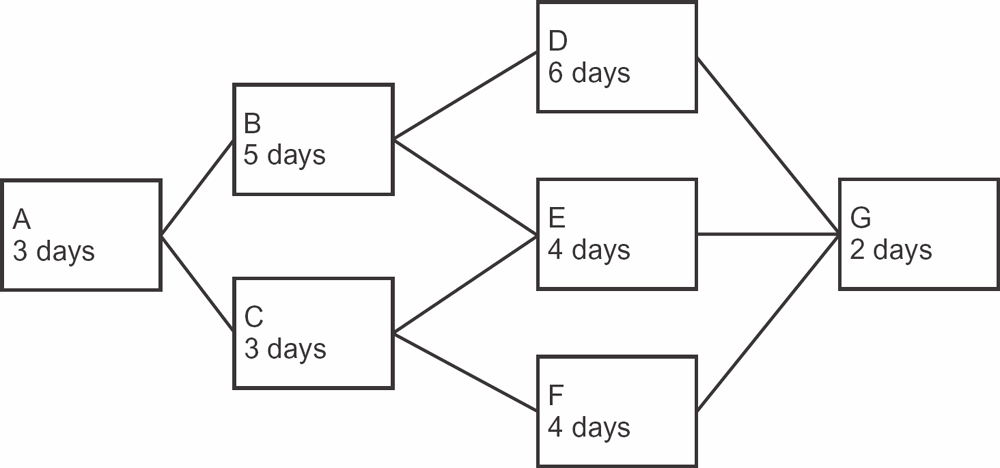
1. Which of the following is the critical path?
(a) A, B, D, G
(b) A, B, E, G
(c) A, C, E, G
(d) A, C, F, G
2. What is the float for activity F?
(a) 0 days
(b) 2 days
(c) 4 days
(d) 6 days
3. Activities B and C have to be completed by the same person. What is the delay in the end time of the project?
(a) 3 days
(b) 5 days
(c) 4 days
(d) 1 day
4. Which of the following does not take account of the dependencies between activities?
(a) Gantt chart
(b) activity network
(c) work breakdown structure
(d) resource histogram
ANSWERS TO SAMPLE QUESTIONS
1. (a) 2. (c) 3. (d) 4. (c)
POINTERS FOR ACTIVITIES
ACTIVITY 2.1
Among the products that may be created for each activity are:
(a) test results, error reports
(b) trained users
(c) a new network
(d) meeting minutes, to-do lists, updated plans
ACTIVITY 2.2
ACTIVITY 2.3
ACTIVITY 2.4 One way of allocating resources would be:
ACTIVITY 2.5
ACTIVITY 2.6
ACTIVITY 2.7
GANTT does not stand for anything. Gantt charts are named after their inventor, Henry Gantt. Gantt should, therefore, not be written in capitals!